Institutional Trading Suite Complete### Institutional Trading Suite Complete (ITS Pro) Indicator Description
#### Overview and Purpose
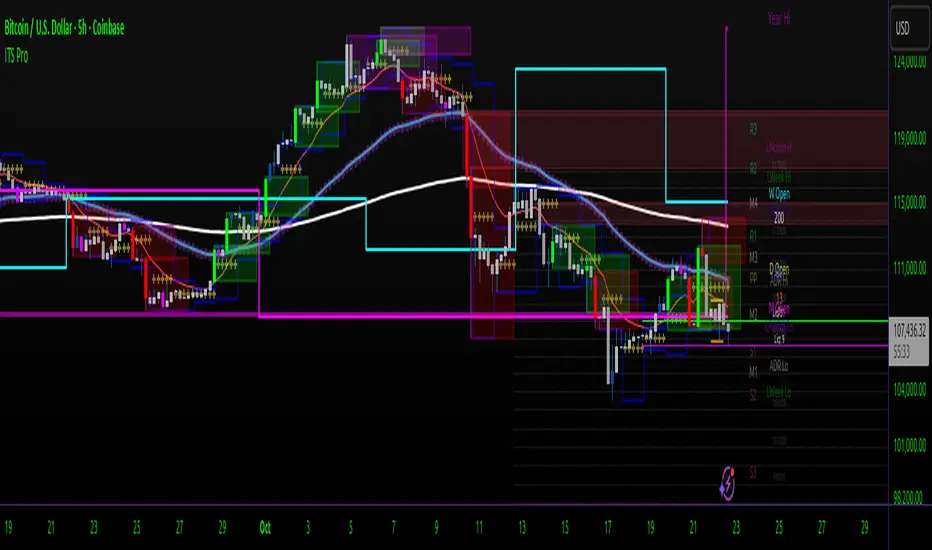
The **Institutional Trading Suite Complete (ITS Pro)** is an all-in-one overlay indicator designed for professional traders seeking a clean, comprehensive view of market structure across multiple timeframes and dimensions. Built for TradingView, this open-source tool integrates over a dozen institutional-grade features into a single, performance-optimized script, helping users identify key levels, trends, volume anomalies, and potential trade setups without cluttering the chart with multiple indicators.
Tailored for assets like forex, crypto, stocks, and indices, ITS Pro addresses the challenges of multi-timeframe analysis by combining price action tools (e.g., pivots, FVGs, order blocks), volume-based insights (PVSRA with vector zones), moving averages for trend confirmation, and statistical dashboards for quick context. Its purpose is to mimic institutional workflows—focusing on liquidity zones, fair value gaps, and average ranges—to spot high-probability entries/exits, risk areas, and market biases. For instance, a trader might use FVGs and order blocks for support/resistance while cross-referencing PVSRA vector candles for volume confirmation, all within one indicator.
This mashup isn't arbitrary; each component complements the others to create a layered analysis system. Volume tools (PVSRA) highlight momentum shifts that validate levels from pivots or psychological zones, while the dashboard provides at-a-glance metrics to tie everything together. By consolidating these, the indicator reduces lag and drawing object overhead (limited to 500 each for boxes/lines/labels), ensuring smooth performance on any timeframe.
#### Originality and Uniqueness
While individual elements like EMAs or pivots exist in basic forms on TradingView, ITS Pro's originality lies in its seamless integration and optimizations for institutional-style trading:
- **PVSRA with Clean Vector Zones**: An enhanced Price-Volume-Spread-Range Analysis that colors bars based on volume/spread ratios and draws limited, non-overlapping zones around "vector" candles (high-volume anomalies). This is unique in its lightweight implementation—capping zones to prevent clutter—allowing traders to spot climactic moves without full volume profile overhead.
- **Limited & Mitigated FVGs/Order Blocks**: Detects Fair Value Gaps and Order Blocks with strict limits (e.g., max 5 FVGs) and percentage-based mitigation (e.g., 50% fill removes the box), keeping the chart clean. Order blocks focus on swing-based bearish/bullish candles with body size filters, avoiding the noise of traditional pivot-based methods.
- **Liquidity Zones via Touch Counting**: A novel approach counting price touches within tolerance bands over a lookback, highlighting high/low liquidity areas only when a threshold is met—original for simplifying liquidity hunting without complex order flow data.
- **Multi-Timeframe Levels & Ranges**: Combines daily/weekly/monthly highs/lows/opens with average ranges (ADR/AWR/AMR) and price quartiles (dividing historical range into Q1-Q4 zones), providing a "big picture" structure not commonly bundled.
- **Dashboard & Alerts**: A customizable table summarizing key metrics (e.g., price bias, FVG/OB counts) with built-in alerts for crosses/breaks, making it a "control center" for the suite.
As open-source code, users can inspect, modify, or extend features (e.g., adjust tolerances or add symbols). It draws from concepts like ICT/Smart Money but refines them for efficiency, using Pine Script v6 optimizations like array limits and conditional drawings to handle high-bar counts without errors.
#### Credit and Acknowledgments
This script incorporates elements inspired by and adapted from the "Traders Reality" codebase, licensed under the Mozilla Public License 2.0 (mozilla.org). Original contributions include:
- Pattern formation by plasmapug.
- Rise retrace continuation to the upside by infernix, peshocore, and xtech5192.
- DST auto functions and psychological level refactor for DST by xtech5192.
- Range daily/weekly Hi/Lo added with research contributions from xtech5192.
While the code is open-source and free to use/modify, the "Traders Reality" name is protected—derivatives should not use "Traders Reality," "Pattern Watchers," or related names. Special thanks to the Traders Reality community for their foundational work on PVSRA, session handling with DST adjustments, and range calculations, which have been optimized and integrated here for enhanced performance.
#### How It Works
ITS Pro processes data in real-time, resetting calculations at timeframe changes (e.g., new days/weeks) and using security() for higher-timeframe fetches. Here's a breakdown of core features and underlying concepts:
- **PVSRA (Volume Analysis)**: Calculates average volume over 10 bars and spread-volume (range * volume). Bars are colored based on ratios: vector (≥2x avg or max spread-vol) for climaxes, strong (≥1.5x) for conviction. Zones are drawn around vectors with fixed extension (user-set bars) and capped count, using arrays for management. Optional symbol override (e.g., for crypto volume aggregation).
- **Exponential Moving Averages**: Standard EMAs (5,13,50,200,800 periods) with optional 50-period cloud. Labels show values at chart right for quick reference.
- **Daily Pivots**: Uses previous day's HLC for PP = (H+L+C)/3, R1/S1 = 2*PP - L/H, etc., up to R3/S3. M-levels are midpoints (e.g., M1 = (S1+S2)/2). Plotted as crosses with style options.
- **High/Low & Open Levels**: Fetches previous period's extremes/opens from D/W/M timeframes. Historical daily opens optional for steplines.
- **Average Ranges**: SMA of (high-low) over user lengths for ADR (daily), AWR (weekly), AMR (monthly). Projects ±50% from close as potential exhaustion levels.
- **Psychological Levels**: Rounds to multiples of spacing (e.g., 1000 for BTC), drawing limited lines (±count) around current price with dotted style.
- **Quarterly Price Zones**: Divides historical range (high-low over lookback) into 4 equal quartiles, drawing non-overlapping boxes for visual price distribution (Q1 bottom 25%, etc.).
- **Yearly Levels**: Annual high/low/open from 12M timeframe, plotted as steplines.
- **Market Sessions**: Time-based boxes for London/NY/Tokyo/Sydney with DST adjustments (US/UK/Sydney). Optional high/low lines per session, resetting at starts.
- **Fair Value Gaps (FVGs)**: Detects gaps where low > high (bullish) or high < low (bearish), drawing boxes. Mitigates when price penetrates % threshold, capping active FVGs.
- **Order Blocks**: Identifies last bearish candle before bullish swing low (or vice versa) with body size filter. Draws extendable boxes, limited count via array shift.
- **Liquidity Zones**: Counts touches near range highs/lows within % tolerance over lookback; draws if ≥threshold.
- **Dashboard**: Table on last bar showing price, levels, counts, bias (above/below PP). Custom position/size.
Alerts trigger on key crosses (e.g., PP break, vector candle).
#### How to Use It
Add ITS Pro via TradingView's indicators menu. Customize in the inputs tab—groups organize features for easy toggling (e.g., disable FVGs if not needed). Best on intraday charts (1m-1h) for stocks/crypto/forex, but scales to higher TFs.
- **Setup**: Adjust offsets for labels (e.g., 12 bars right). Enable extensions for lines/boxes. For PVSRA, override symbol if volume is unreliable (e.g., aggregate BTC exchanges).
- **Trading Examples**:
- **Bias & Trends**: Use EMA stack and PP for daily bias (above PP + golden cross = long). PVSRA vectors confirm entries.
- **Levels & Zones**: Trade bounces from order blocks/FVGs near psych levels or quarterly zones. Liquidity zones signal potential sweeps.
- **Ranges**: ADR highs/lows as take-profit; if price hits AWR early, expect expansion.
- **Sessions**: Focus entries during London/NY overlaps; session H/L as intraday S/R.
- **Dashboard/Alerts**: Monitor for "BULLISH ↑" bias; set alerts for R1 breaks or vectors.
Since it's open-source, fork the code to add features (e.g., custom alerts). Test on demo charts—feedback via comments! Developed for clean, pro analysis—happy trading!