P1 - Multi-Instrument Weekly Levels - Version 11.9.25.5Levels based on RDGD channels.
// ===========================================================================
// Multi-Instrument Weekly Levels + MSL X + Alerts + ES to SPX Converter
// Version: 11.9.25.5
//
// VERSION TRACKING:
// Format: xx.xx.xx.x (Month.Day.Year.Revision)
// - First number: Month (11 = November)
// - Second number: Day (9 = 9th)
// - Third number: Year (25 = 2025)
// - Fourth number: Revision (5 = updated MSL/NPL values and reorganized settings)
//
// CHANGE LOG:
// 11.9.25.5 - Updated MSL/NPL values and reorganized settings layout
// 11.9.25.4 - Updated NQ Monday and Weekly levels
// 11.9.25.3 - Fixed showSPXLevels variable name (capital L)
// 11.9.25.2 - Updated SPY, QQQ, ES, YM, RTY, GC weekly and daily levels
// 11.9.25.1 - Initial version saved as starting script
// ===========================================================================
Prashant

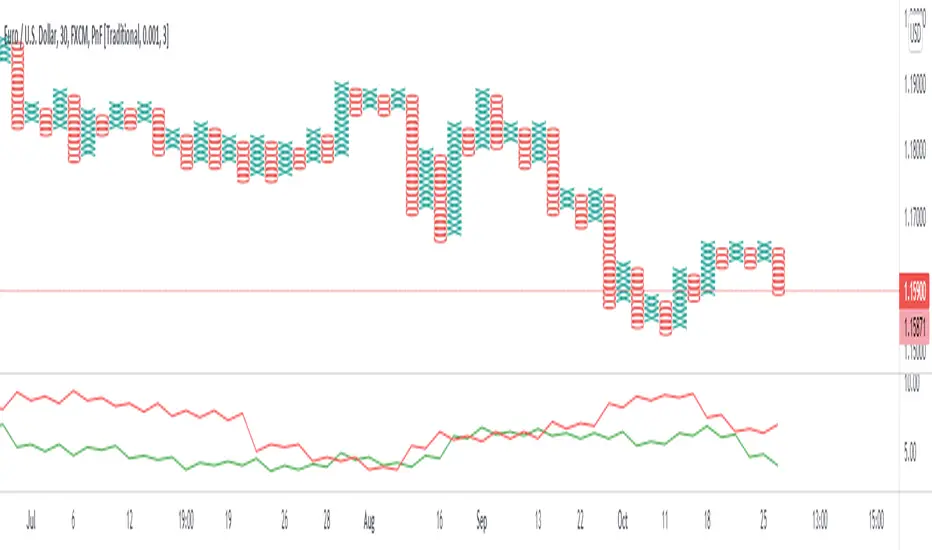
Column XO ZoneColumn XO is an indicator in Prashant Shah's book Trading The Markets The Point & Figure Way. It counts a number of Xs and Os in every column for the length period. Both Xs and Os are calculated separately. Then, both results are divided by half the number of columns which is set by length.
I personally don't find this indicator very useful, because all it can offer is very clear in Point and Figure charts. However, it was designed to give some information on volatility as well as direction.
Good luck!
Column XOColumn XO is an indicator in Prashant Shah's book Trading The Markets The Point & Figure Way. It counts a number of Xs and Os in every column for the long period. Then, the result is divided by the number of columns which is set by length.
This indicator is designed to identify changes in volatility and works well with Wyckoff's Law of Cause and Effect. The longer the price spends in the consolidation, the more volatile and far-reaching should the expansion phase be.
Good luck!
