MA Golden cross & Death crossthis indicator marks the golden cross and death cross on top of the 50 & 200 MA to use this indicator you gotta have your MA50&200 (50, close, 200, close) indicator set up @razsecretsssIndicador Pine Script®por razsecretsss31
DTCC RECAPS Dates 2020-2025This is a simple indicator which marks the RECAPS dates of the DTCC, during the periods of 2020 to 2025. These dates have marked clear settlement squeezes in the past, such as GME's squeeze of January 2021. ------------------------------------------------------------------------------------------------------------------ The Depository Trust & Clearing Corporation (DTCC) has published the 2025 schedule for its Reconfirmation and Re-pricing Service (RECAPS) through the National Securities Clearing Corporation (NSCC). RECAPS is a monthly process for comparing and re-pricing eligible equities, municipals, corporate bonds, and Unit Investment Trusts (UITs) that have aged two business days or more . At its core, the Reconfirmation and Re-pricing Service (RECAPS) is a risk management tool used by the National Securities Clearing Corporation (NSCC), a subsidiary of the DTCC. Its primary purpose is to reduce the risks associated with aged, unsettled trades in the U.S. securities market . When a trade is executed, it is sent to the NSCC for clearing and settlement. However, for various reasons, some trades may not settle on their scheduled date and become "aged." These unsettled trades create risk for both the trading parties and the clearinghouse (NSCC) because the value of the underlying securities can change over time. If a trade fails to settle and one of the parties defaults, the NSCC may have to step in to complete the transaction at the current market price, which could result in a loss. RECAPS mitigates this risk by systematically re-pricing these aged, open trading obligations to the current market value. This process ensures that the financial obligations of the clearing members accurately reflect the present value of the securities, preventing the accumulation of significant, unmanaged market risk . Detailed Mechanics: How Does it Work? The RECAPS process revolves around two key dates you asked about: the RECAPS Date and the Settlement Date . The RECAPS Date: On this day, the NSCC runs a process to identify all eligible trades that have remained unsettled for two business days or more. These "aged" trades are then re-priced to the current market value. This re-pricing is not just a simple recalculation; it generates new settlement instructions. The original, unsettled trade is effectively cancelled and replaced with a new one at the current market price. This is done through the NSCC's Obligation Warehouse. The Settlement Date: This is typically the business day following the RECAPS date. On this date, the financial settlement of the re-priced trades occurs. The difference in value between the original trade price and the new, re-priced value is settled between the two trading parties. This "mark-to-market" adjustment is processed through the members' settlement accounts at the DTCC. Essentially, the process ensures that any gains or losses due to price changes in the underlying security are realized and settled periodically, rather than being deferred until the trade is ultimately settled or cancelled. Are These Dates Used to Check Margin Requirements? Yes, indirectly, this process is closely tied to managing margin and collateral requirements for NSCC members. Here’s how: The NSCC requires its members to post collateral to a clearing fund, which acts as a mutualized guarantee against defaults. The amount of collateral each member must provide is calculated based on their potential risk exposure to the clearinghouse. By re-pricing aged trades to current market values through RECAPS, the NSCC gets a more accurate picture of each member's outstanding obligations and, therefore, their current risk profile. If a member has a large number of unsettled trades that have moved against them in value, the re-pricing will crystallize that loss, which will be settled the next day. This regular re-pricing and settlement of aged trades prevent the build-up of large, unrealized losses that could increase a member's risk profile beyond what their posted collateral can cover. While RECAPS is not the only mechanism for calculating margin (the NSCC has a complex system for daily margin calls based on overall portfolio risk), it is a crucial component for managing the specific risk posed by aged, unsettled transactions. It ensures that the value of these obligations is kept current, which in turn helps ensure that collateral levels remain adequate. -------------------------------------------------------------------------------------------------------------- Future dates of 2025: - November 12, 2025 (Wed) - November 25, 2025 (Tue) - December 11, 2025 (Thu) - December 29, 2025 (Mon) The dates for 2026 haven't been published yet at this time. The RECAPS process is essentially the industry's way of retrying the settlement of all unresolved FTDs, netting outstanding obligations, and gradually forcing resolution (either delivery or buy-in). Monitoring RECAPS cycles is one way to track the lifecycle, accumulation, and eventual resolution (or persistence) of failures to deliver in the U.S. market. The US Stock market has become a game of settlement dates and FTDs, therefore this can be useful to track.Indicador Pine Script®por Infinite_Noise30
Market SessionsMarket Sessions (Asian, London, NY, Pacific) Summary This indicator plots the main global market sessions (Asian, European, American, Pacific) as boxes on your chart, complete with dynamic high/low tracking. It's an essential tool for intraday traders to track session-based volatility patterns and visualize key support/resistance levels (like the Asian Range) that often define price action for the rest of the day. Who it’s for Intraday traders, scalpers, and day traders who need to visualize market hours and session-based ranges. If your strategy depends on the London open, the New York close, or the Asian range, this script will map it out for you. What it shows Customizable Session Boxes: Four fully configurable boxes for the Asian, European (London), American (New York), and Pacific (Sydney) sessions. Session High & Low: The script tracks and boxes the highest high and lowest low of each session, dynamically updating as the session progresses. Session Labels: Clear labels (e.g., "AS", "EU") mark each session, anchored to the start time. Key Features Powerful Timezone Control: This is the core feature. Use Exchange Timezone (Default): Simply enter session times (e.g., 8:00 for London) relative to the exchange's timezone (e.g., "NASDAQ" or "BINANCE"). Use UTC Offset: Uncheck the box and enter a UTC offset (e.g., +3 or -5). Now, all session times you enter are relative to that specific UTC offset. This gives you full control regardless of the chart you're on. Fully Customizable: Toggle any session on/off. Style Control: Change the fill color, border color, transparency, border width, and line style (Solid, Dashed, Dotted) for each session individually. Smart Labels: Labels stay anchored to the start of the session (no "sliding") and float just above the session high. Why this helps Track Volatility & Market Behavior: Visually identify the "personality" of each session. Some sessions might consistently produce powerful pumps or dumps, while others are prone to sideways "chop" or accumulation. This indicator helps you see these repeating patterns. Find Key Support/Resistance Levels: The High and Low of a session (e.g., the Asian Range) often become critical support and resistance levels for the next session (e.g., London). This script makes it easy to spot these "session-to-session" S/R flips and reactions. Aid Statistical Analysis: The script provides the core visual data for your statistical research. You can easily track how often the London session breaks the Asian high, or which session is most likely to reverse the trend, helping you build a robust trading plan. Context is King: Instantly see which market is active, which are overlapping (like the high-volume London-NY overlap), and which have closed. Quick setup Go to Timezone Settings. Decide how you want to enter times: Easy (Default): Leave Use Exchange Timezone checked. Enter session times based on the chart's native exchange (e.g., for BTC/USDT on Binance, use UTC+0 times). Manual (Pro): Uncheck Use Exchange Timezone. Enter your UTC Offset (e.g., +2 for Berlin). Now, enter all session times as they appear on the clock in Berlin. Go to each session tab (Asian, European...) to enable/disable it and set the correct start/end hours and minutes. Style the colors to match your chart theme. Disclaimer For educational/informational purposes only; not financial advice. Trading involves risk—manage it responsibly.Indicador Pine Script®por MAXmksActualizado 125
Lateral Market DetectorOverview The Lateral Market Detector is a TradingView indicator designed to identify and highlight range-bound market conditions (sideways movement) where price oscillates between defined support and resistance levels with minimal overall movement. How It Works The indicator analyzes price action using a dynamic range detection algorithm: Range Calculation: Examines the last N candlesticks (default 50, adjustable 20-200) and calculates the difference between the highest high and lowest low within this period. Laterality Detection: Compares the calculated range against a configurable tolerance threshold (in pips). If the range is smaller than the tolerance, the market is identified as laterally moving. Confirmation Logic: Counts consecutive candlesticks that remain within the detected range. The indicator only confirms a lateral condition when the minimum number of consecutive candlesticks has been reached (default 15). Visual Representation: Once confirmed, displays a colored rectangle (box) spanning from the range's start point to the current bar, with horizontal dashed lines marking the high and low levels. Dynamic Update: Continuously updates the rectangle as new candlesticks form, adjusting the top and bottom boundaries if price remains within the lateral zone. Key Features Multi-Timeframe Optimization Automatic timeframe adaptation using square root scaling When enabled, parameters adjust proportionally based on the current timeframe (M1, M5, M15, M30, H1, D1, W1, MN) Prevents the need for manual parameter adjustments across different timeframes Formula: Adjusted_Tolerance = Base_Tolerance × √(Timeframe_Multiplier) Customizable Parameters Tolerance Pip (M1): Sets the maximum range width to identify laterality Minimum Candlesticks: Minimum consecutive candles required to confirm a lateral zone Candlesticks to Analyze: Lookback period for range calculation Breakout Sensitivity: Controls the threshold for identifying range breakouts Full Visual Customization Rectangle color and transparency High/Low line color and thickness Automatic status display showing current timeframe, lateral confirmation, and active parameters Use Cases Range Trading: Identify optimal entry and exit points at support/resistance Breakout Trading: Visual confirmation before entering breakout trades Trend Analysis: Distinguish between trending and consolidating markets Risk Management: Define clear stop-loss levels based on range boundaries Technical Specifications Indicator Type: Overlay Maximum Boxes: 100 (prevents performance degradation) Supported Assets: Forex, CFDs, Stocks, Cryptocurrencies Pine Script Version: v5 Chart Display: Real-time updates on each new candlestickIndicador Pine Script®por fabio23traders118
Trend Pullback System```{"variant":"standard","id":"36492","title":"Trend Pullback System Description"} Trend Pullback System is a price-action trend continuation model that looks to enter on pullbacks, not breakouts. It’s designed to find high-quality long/short entries inside an already established trend, place the stop at meaningful structure, trail that stop as structure evolves, and warn you when the trade thesis is no longer valid. Developed by: Mohammed Bedaiwi --------------------------------- HOW IT WORKS --------------------------------- 1. Trend Detection • The strategy defines overall bias using moving averages. • Bullish environment (“uptrend”): price above the slower MA, fast MA above slow MA, and the slow MA is sloping up. • Bearish environment (“downtrend”): price below the slower MA, fast MA below slow MA, and the slow MA is sloping down. This prevents trading against chop and focuses on continuation moves in the dominant direction. 2. Pullback + Re-entry Logic • The script waits for price to pull back into structure (support in an uptrend, resistance in a downtrend), and then push back in the direction of the main trend. • That “push back” is the setup trigger. We don’t chase the first breakout candle — we buy/sell the retest + resume. 3. Structural Levels (“Diamonds”) • Green diamond (below bar): bullish pivot low formed while the trend is bullish. This marks defended support. - Use it as a re-entry zone for longs. - Use it to trail a stop higher when you’re already long. - Shorts can take profit here because buyers stepped in. • Red diamond (above bar): bearish pivot high formed while the trend is bearish. This marks defended resistance. - Use it as a re-entry zone for shorts. - Use it to trail a stop lower when you’re already short. - Longs can take profit here because sellers stepped in. 4. Entry Signals • BUY arrow (green triangle up under the candle, text like “BUY” / “BUY Zone”): - LongSetup is true. - Trend is bullish or turning bullish. - Price just bounced off recent defended support (green diamond) and reclaimed short-term momentum. Meaning: enter long here or cover/exit shorts. • SELL arrow (red triangle down above the candle): - ShortSetup is true. - Trend is bearish or turning bearish. - Price just rolled down from defended resistance (red diamond) and lost short-term momentum. Meaning: enter short here or take profit on longs. These are the primary trade entries. They are meant to be actionable. 5. Weak Setups (“W” in yellow) • Yellow triangle with “W”: - A possible long/short idea is trying to form, BUT the higher-timeframe confirmation is not fully there yet. - Think of it as early pressure / early caution, not a full signal. • You usually watch these areas rather than jumping in immediately. 6. Exit Warning (orange “EXIT” label above a bar) • The strategy will raise an EXIT marker when you’re in a trade and the *opposite* side just produced a confirmed setup. - You’re short and a valid longSetup appears → EXIT. - You’re long and a valid shortSetup appears → EXIT. • This is basically: “Close or reduce — the other side just took control.” • It’s not just a trailing stop hit; it’s a regime flip warning. 7. Stop, Target, and Trailing • On every new setup, the script records: - Initial stop: recent swing beyond the defended level (below support for longs, above resistance for shorts). - Initial target: recent opposing swing. • While you’re in position, if new confirming diamonds print in your favor, the stop can trail toward the new defended level. • This creates structure-based risk management (not just fixed % or ATR). 8. Reference Levels • The strategy also plots prior higher-timeframe closes (last week’s close, last month’s close, last year’s close). These can behave as magnets or stall points. • They’re helpful for take-profit timing and for reading “are we trading above or below last month’s close?” 9. Momentum Panel (hidden by default) • Internally, the script calculates an SMI-style momentum oscillator with overbought/oversold zones. • This is optional visual confirmation and does not drive the core entry/exit logic. --------------------------------- WHAT A TRADE LOOKS LIKE IN REAL PRICE ACTION --------------------------------- Early warning • Yellow W + red diamonds + red down arrows = “This is getting weak. Short setups are here.” • You may also see something like “My Short Entry Id.” That’s where the short side actually engages. Bearish follow-through, then exhaustion • Price bleeds down. • Then the orange EXIT appears. → Translation: “If you’re still short, close it. Buyers are stepping in hard. Risk of reversal is now high.” Regime flip • Right after EXIT, multiple green BUY arrows fire together (“BUY”, “BUYZone”). • That’s the true long trigger. → This is where you either enter long or flip from short to long. Expansion leg • After that flip, price rips up for multiple candles / days / weeks. • While it runs: - Green diamonds appear under pullbacks → “dip buy zones / trail stop up here.” - More BUY arrows show on minor pullbacks → continuation long / scale adds. Distribution / topping • Later, you start seeing new yellow W triangles again near local highs. That’s your “careful, this might be topping” warning. • You finally get a hard red candle, and green diamonds stop stacking. → That’s where you tighten risk, scale out, or assume the move is mature. In plain terms, the model is doing the following for you: • It puts you short during weakness. • It tells you when to get OUT of the short. • It flips you long right as control changes. • It gives you a structure-based trail the whole way up. • It warns you again when momentum at the top starts cracking. That is exactly how the logic was designed. --------------------------------- QUICK INTERPRETATION CHEAT SHEET --------------------------------- 🔻 Red triangle + “Short Entry” near a red diamond → Short entry zone (or take profit on a long). 🟥 Red diamond above bar → Sellers defended here. Treat it as resistance. Good place to trail short stops just above that level. Avoid chasing longs straight into it. 🟨 Yellow W → Attention only. Early pressure / possible turn. Not fully confirmed. 🟧 EXIT (orange label) → The opposite side just printed a real setup. Close the old idea (cover shorts if you’re short, exit longs if you’re long). Thesis invalid. 🟩 Burst of green BUY triangles after EXIT → Long entry. Also a “cover shorts now” alert. This is the core money entry in bullish reversals. 💎 Green diamond below bar → Bulls defended that level. Good for trailing your long stop up, and good “buy the dip in trend” locations. 📈 Blue / teal MAs stacked and rising → Confirmed bullish structure. You’re in trend continuation mode, so dips are opportunities, not automatic exits. --------------------------------- COLOR / SHAPE KEY --------------------------------- • Green triangle up (“BUY”, “BUY Zone”): Long entry / cover shorts / continuation long trigger. • Red triangle down: Short entry / take profit on longs / continuation short trigger. • Orange “EXIT” label: Opposite side just fired a real setup. The previous trade thesis is now invalid. • Green diamond below price: Bullish defended support in an uptrend. Use for dip buys, trailing stops on longs, and objective cover zones for shorts. • Red diamond above price: Bearish defended resistance in a downtrend. Use for re-entry shorts, trailing stops on shorts, and objective scale-out zones for longs. • Yellow “W”: Weak / early potential setup. Watch it, don’t blindly trust it. • Moving average bands (fast MA, slow MA, Hull MA): When stacked and rising, bullish control. When stacked and falling, bearish control. --------------------------------- INTENT --------------------------------- This system is built to: • Trade with momentum, not against it. • Enter on pullbacks into proven structure, not chase stretched breakouts. • Automate stop/target logic around actual defended swing levels. • Warn you when the other side takes over so you don’t give back gains. Typical usage: 1. In an uptrend, wait for price to pull back, print a green diamond (support proved), then take the first BUY arrow that fires. 2. In a downtrend, wait for a bounce into resistance, print a red diamond (sellers proved), then take the first SELL arrow that fires. 3. Respect EXIT when it appears — that’s the model saying “this trade is done.” --------------------------------- DISCLAIMER --------------------------------- This script is for educational and research purposes only. It is not financial advice, investment advice, or a recommendation to buy or sell any security, cryptoasset, or derivative. Markets carry risk. Past performance does not guarantee future results. You are fully responsible for your own decisions, position sizing, risk management, and compliance with all applicable laws and regulations.Estrategia Pine Script®por mbedaiwi2208
Swing High/Low (Adaptive)Swing High/Low (Adaptive) Overview The Indicator is a pivot point detection tool that identifies swing highs and lows with invalidation tracking. The key differentiator of this indicator is its adaptive invalidation system . Most pivot indicators simply mark every detected pivot without considering whether subsequent price action has made earlier pivots less relevant. How It Works The indicator uses Pine Script's native ta.pivotlow() and ta.pivothigh() functions combined with custom logic to detect swing points. The adaptive algorithm evaluates each potential pivot against the following criteria: For Low Pivots: Confirms a new low pivot when it's the next expected pivot type in the swing sequence If consecutive lows occur, only accepts a new low if it's lower than the previous low Marks the previous low as invalidated when a stronger low is detected For High Pivots: Confirms a new high pivot when it's the next expected pivot type in the swing sequence If consecutive highs occur, only accepts a new high if it's higher than the previous high Marks the previous high as invalidated when a stronger high is detected This approach ensures that the indicator maintains clean swing structure and automatically adjusts when price action creates stronger pivots, providing a more realistic view of support and resistance levels. Settings Pivot Settings: Left Bars : Number of bars to the left required for pivot confirmation (default: 5) Right Bars : Number of bars to the right required for pivot confirmation (default: 5) Pivot Display Settings: Toggle visibility for low and high pivots independently Customizable colors for valid pivot markers Low pivots marked with upward triangle (▲) High pivots marked with downward triangle (▼) Invalid Pivot Settings: Optional display of invalidated pivots Separate color customization for invalid low and high pivots Helps visualize where market structure expectations changed ZigZag Settings: Toggle ZigZag line display on/off Separate colors for upward and downward price swings Adjustable line width Use Cases 1. Market Structure Analysis Identify key swing points to understand the current market structure and trend direction. The adaptive invalidation feature ensures you're always looking at the most relevant pivots. 2. Support and Resistance Identification Use confirmed swing highs and lows as potential support and resistance levels for entry and exit planning. 3. Trend Confirmation The ZigZag visualization helps confirm trends by showing the sequence of higher highs and higher lows (uptrend) or lower highs and lower lows (downtrend). Disclaimer This indicator is designed as a technical analysis tool and should be used in conjunction with other forms of analysis and proper risk management. Past performance does not guarantee future results, and traders should thoroughly test any strategy before implementing it with real capital. Indicador Pine Script®por dchunt-stack44511
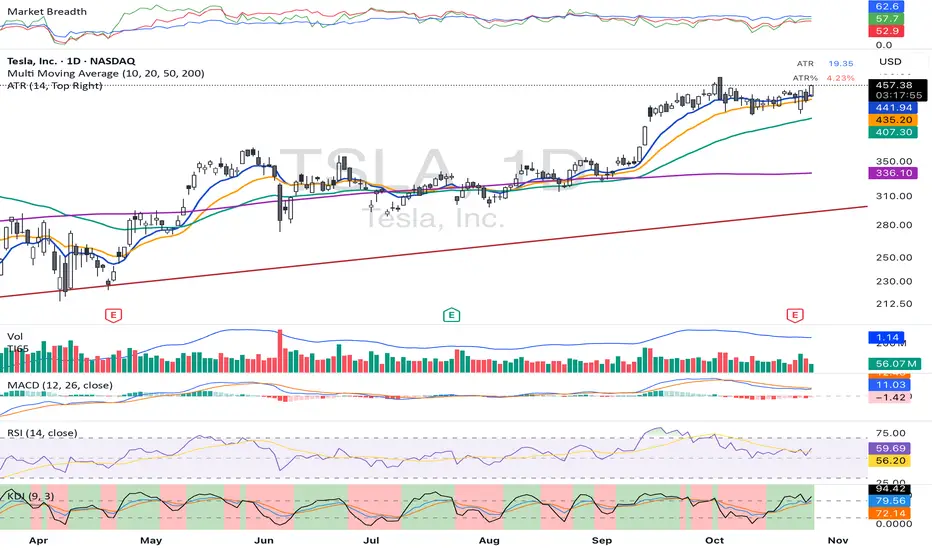
ATRThis script displays the Average True Range (ATR) value and the ATR as a percentage of the current closing price directly on the main chart as a clean table, with no lines or plots. It allows users to easily monitor both absolute volatility and its relative magnitude, making comparisons across different assets intuitive. The display position is customizable, offering flexibility for personal chart layouts. Ideal for traders seeking quick volatility insights, risk management guidance, or portfolio-wide comparisons.Indicador Pine Script®por echanxyz2
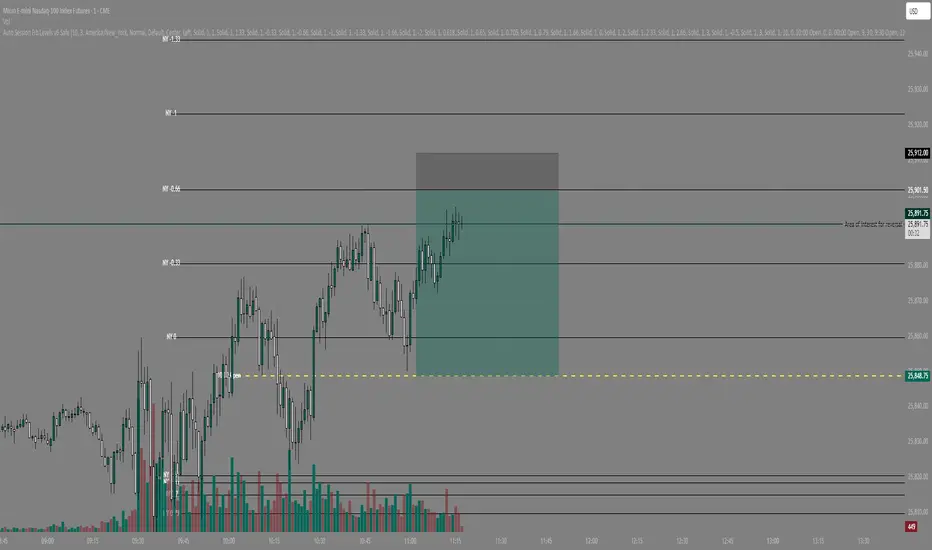
Auto Session Fib/Open LevelsThis indicator automatically plots fib levels and key opening levels so you don't have to (: Default levels are set to Longhorn Trades (Peter Kennedy) fib settings and two key openings of my liking.Indicador Pine Script®por spudtrades78
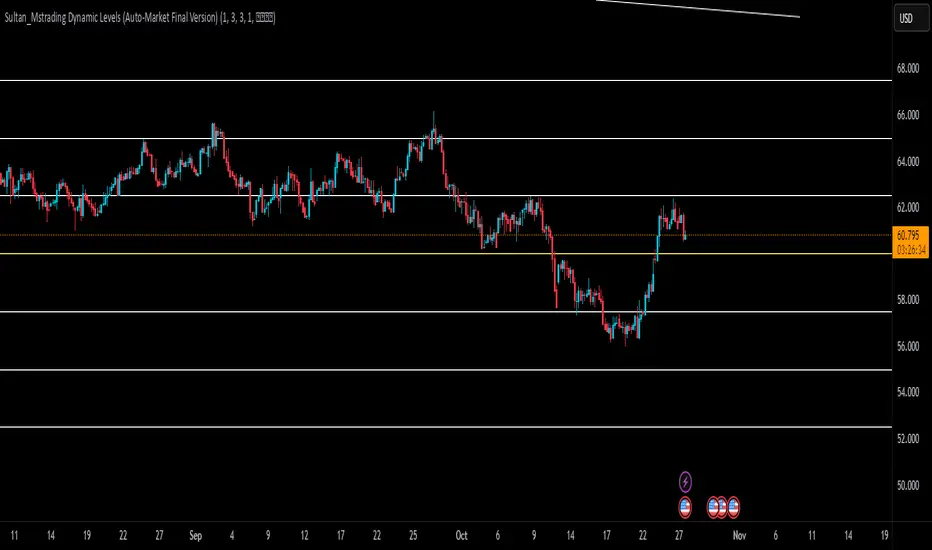
Sultan_Mstrading Dynamic Levels (Auto-Market Final Version)The Sultan_Mstrading Dynamic Levels indicator automatically generates dynamic support and resistance levels based on the market type or trading symbol (such as Gold, Bitcoin, Indices, Oil, or Forex pairs). It plots multiple levels above and below the current price with adjustable spacing, and automatically highlights the nearest level to the current price for quick visual reference Indicador Pine Script®por Mohamed_Sultan_0722233
Liquidity Levels - PMH/PWH/PDH/HODWhat is it? An indicator that tracks the main liquidity levels on TradingView, displaying the highs and lows of reference for month, week, previous day and current day. What's it for? It identifies price zones where there are many pending orders (liquidity). Traders use it to: Find support and resistance points Identify areas where price could bounce or break through Receive alerts when price touches or breaks these levels Which levels does it show? LevelDescriptionColorLinePMH/PMLPrevious month's high and lowPurpleSolidPWH/PWLPrevious week's high and lowBlueSolidPDH/PDLPrevious day's high and lowOrangeSolidHOD/LODCurrent day's high and lowGrayDotted How to use it? Apply the indicator to your chart Customize colors and enable/disable the levels you prefer Set alerts to receive notifications when price touches or breaks levels Use the levels to make trading decisions (entry, exit, stop loss) Perfect for: Scalping, Day Trading, Swing Trading on any asset (forex, crypto, stocks)Indicador Pine Script®por fabio23traders80
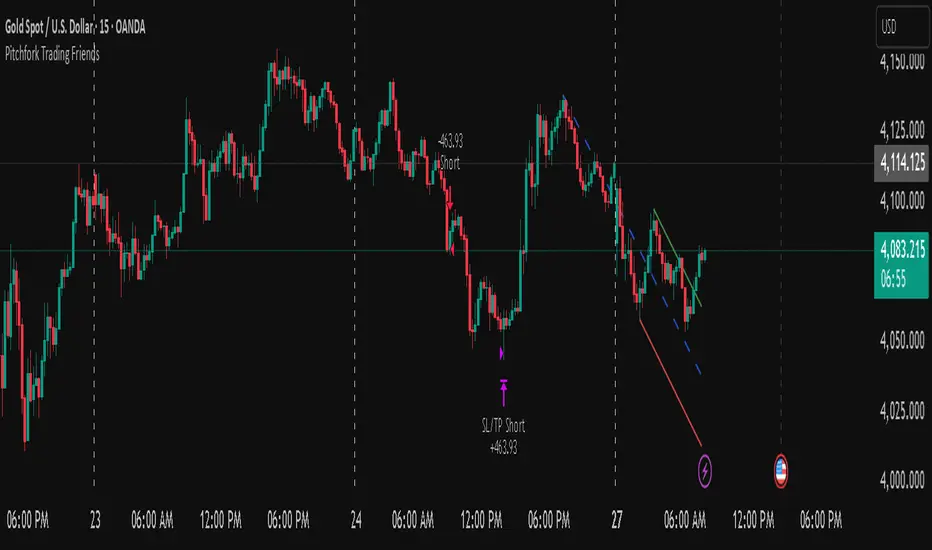
Pitchfork-Trading Friendsuses the pitchfork to give entry and exit zones, and gives a net overall summary for a beginner trader to enter into.Estrategia Pine Script®por kanwalrsingh_phull1142
THAIT Moving Averages Tight within # ATR EMA SMA convergence THAIT(tight) indicator is a powerful tool for identifying moving average convergence in price action. This indicator plots four user-defined moving averages (EMA or SMA). It highlights moments when the MAs converge within a user specified number of ATRs, adjusted by the 14-period ATR, signaling potential trend shifts or consolidation. A convergence is flagged when MA1 is the maximum, the spread between MAs is tight, and the price is above MA1, excluding cases where the longest MA (MA4) is the highest. The indicator alerts and visually marks convergence zones with a shaded green background, making it ideal for traders seeking precise entry or exit points.Indicador Pine Script®por Imready419
Session Highs and LowsThis indicator highlights the New York, London, and Asian trading sessions — plotting each session’s highs and lows directly on your chart to help visualize intraday ranges and liquidity levels. ⸻ ✨ Features • Session Range Visualization Automatically marks the high and low of each trading session with colored lines. This makes it easy to identify where price expanded, consolidated, or built liquidity during each market phase. • Session Background Zones (Optional) Toggle background fills to highlight active sessions for clearer visual separation of NY, London, and Asian trading hours. • Customizable Settings • Enable or disable each session independently • Adjust session times and colors • Choose whether to fill session backgrounds • Timezone Aware All sessions are aligned to New York time by default, ensuring consistent mapping across instruments. ⸻ 🎯 Use Case A perfect tool for traders who track session-based liquidity, breaks of structure, or session-to-session continuity. Quickly spot the Asian range, London expansion, and New York reversal windows — key components in intraday strategy development. ⸻ ⚙️ Inputs • Toggle sessions: NY / London / Asian • Background fill on/off • Label color customization • Adjustable session times ⸻ 📈 Why Use It Understanding where each session establishes its range high and low provides critical context for liquidity grabs, session overlaps, and structural shifts throughout the day. This simple yet powerful visual map enhances precision for ICT-style, smart money, or price action-based trading models.Indicador Pine Script®por EddyPips172
Previous Day High/Low Miyagimuestra PDH y PDL, lo uso para ICT/SMC simple y sencilloIndicador Pine Script®por GastonSofia14
Fixed Dollar Risk LinesFixed Dollar Risk Lines is a utility indicator that converts a user-defined dollar risk into price distance and plots risk lines above and below the current price for popular futures contracts. It helps you place stops or entries at a consistent dollar risk per trade, regardless of the market’s tick value or tick size. What it does: -You choose a dollar amount to risk (e.g., $100) and a futures contract (ES, NQ, GC, YM, RTY, PL, SI, CL, BTC). The script automatically: -Looks up the contract’s tick value and tick size -Converts your dollar risk into number of ticks -Converts ticks into price distance Plots: -Long Risk line below current price -Short Risk line above current price -Optional labels show exact price levels and an information table summarizes your settings. Key features -Consistent dollar risk across instruments -Supports major futures contracts with built‑in tick values and sizes -Toggle Long and Short risk lines independently -Customizable line width and colors (lines and labels) -Right‑axis price level display for quick reading -Compact info table with contract, risk, and computed prices Typical use -Long setups: use the green line as a stop level below entry to match your chosen dollar risk. -Short setups: use the red line as a stop level above entry to match your chosen dollar risk. -Quickly compare how the same dollar risk translates to distance on different contracts. Inputs -Risk Amount (USD) -Futures Contract (ES, NQ, GC, YM, RTY, PL, SI, CL, BTC) -Show Long/Short lines (toggles) -Line Width -Colors for lines and labels Notes -Designed for futures symbols that match the listed contracts’ tick specs. If your symbol has different tick value/size than the defaults, results will differ. -Intended for educational/informational use; not financial advice. -This tool streamlines risk placement so you can focus on execution while keeping dollar risk consistent across markets.Indicador Pine Script®por smg38725
Fib OscillatorWhat is Fib Oscillator and How to Use it? 🔶 1. Conceptual Overview The Fib Oscillator is a Fibonacci-based relative position oscillator. Instead of measuring momentum (like RSI or MACD), it measures where price currently sits between the recent swing high and swing low, expressed as a percentage within the Fibonacci range. In other words: It answers: “Where is price right now within its most recent dynamic range?” It visualizes retracement and extension zones numerically, providing continuous feedback between 0% and 100% (and beyond if extended). 🔶 2. What the Script Does The indicator: Automatically detects recent high and low levels using an adaptive lookback window, which depends on ATR volatility. Calculates the current price’s position between those levels as a percentage (0–100). Plots that percentage as an oscillator — showing visually whether price is near the top, middle, or bottom of its recent range. Overlays Fibonacci retracement levels (23.6%, 38.2%, 50%, 61.8%, 78.6%) as reference zones. Generates alerts when the oscillator crosses key Fib thresholds — which can signal retracement completion, breakout potential, or pullback exhaustion. 🔶 3. Technical Flow Breakdown (a) Inputs Input Description Default Notes atrLength ATR period used for volatility estimation 14 Used to dynamically tune lookback sensitivity minLookback Minimum lookback window (candles) 20 Ensures stability even in low volatility maxLookback Maximum lookback window 100 Limits over-expansion during high volatility isInverse Inverts chart orientation false Useful for inverse markets (e.g. shorts or inverse BTC view) (b) Volatility-Adaptive Lookback Instead of using a fixed lookback, it calculates: lookback = SMA(ATR,10) / SMA(Close,10) × 500 lookback=SMA(ATR,10)/SMA(Close,10)×500 Then it clamps this between minLookback and maxLookback. This makes the oscillator: More reactive during high volatility (shorter lookback) More stable during calm markets (longer lookback) Essentially, it self-adjusts to market rhythm — you don’t have to constantly tweak lookback manually. (c) High-Low Reference Points It takes the highest and lowest points within the dynamic lookback window. If isInverse = true, it flips the candle logic (useful if viewing inverse instruments like stablecoin pairs or when analyzing bearish setups invertedly). (d) Oscillator Core The main oscillator line: osc = ( close − low ) ( high − low ) × 100 osc= (high−low) (close−low) ×100 0% = Price is at the lookback low. 100% = Price is at the lookback high. 50% = Midpoint (balanced). Between Fibonacci percentages (23.6%, 38.2%, 61.8%, etc.), the oscillator indicates retracement stages. (e) Fibonacci Levels as Reference It overlays horizontal reference lines at: 0%, 23.6%, 38.2%, 50%, 61.8%, 78.6%, 100% These act as support/resistance bands in oscillator space. You can read it similar to how traders use Fibonacci retracements on charts, but compressed into a single line oscillator. (f) Alerts The script includes built-in alert conditions for crossovers at each major Fibonacci level. You can set TradingView alerts such as: “Oscillator crossed above 61.8%” → possible bullish continuation or breakout. “Oscillator crossed below 38.2%” → possible pullback or correction starting. This allows automated monitoring of fib retracement completions without manually drawing fib levels. 🔶 4. How to Use It 🔸 Visual Interpretation Oscillator Value Zone Market Context 0–23.6% Deep Retracement Potential exhaustion of a down-move / early reversal 23.6–38.2% Shallow retracement zone Possible continuation phase 38.2–50% Mid retracement Neutral or indecisive structure 50–61.8% Key pivot region Common trend resumption zone 61.8–78.6% Late retracement Often “last pullback” area 78.6–100% Near high range Possible overextension / profit-taking >100% Range breakout New leg formation / expansion 🔸 Practical Application Steps Load the indicator on your chart (set overlay = false, so it’s below the main price chart). Observe oscillator position relative to fib bands: Use it to determine retracement depth. Combine with structure tools: Trend lines, swing points, or HTF market structure. Use crossovers for timing: Crossing above 61.8% in an uptrend often confirms breakout continuation. Crossing below 38.2% in a downtrend signals renewed downside momentum. For range markets, oscillator swings between 23.6% and 78.6% can define accumulation/distribution boundaries. 🔶 5. When to Use It During Retracements: To gauge how deep the pullback has gone. During Range Markets: To identify relative overbought/oversold positions. Before Breakouts: Crossovers of 61.8% or 78.6% often precede impulsive moves. In Multi-Timeframe Contexts: LTF (15M–1H): Detect intraday retracement exhaustion. HTF (4H–1D): Confirm major range expansions or key reversal zones. 🔶 6. Ideal Companion Indicators The Fib Oscillator works best when contextualized with structure, volatility, and trend bias indicators. Below are optimal pairings: Companion Indicator Purpose Integration Insight Market Structure MTF Tool Identify active trend direction Use Fib Oscillator only in trend direction for cleaner signals EMA Ribbon / Supertrend Trend confirmation Align oscillator crossovers with EMA bias ATR Bands / Volatility Envelope Validate breakout strength If oscillator >78.6% & ATR rising → valid breakout Volume Oscillator Confirm retracement strength Volume contraction + oscillator under 38.2% → potential reversal HTF Fib Retracement Tool Combine LTF oscillator with HTF fib confluence Powerful multi-timeframe setups RSI or Stochastic Measure momentum relative to position RSI divergence while oscillator near 78.6% → exhaustion clue 🔶 7. Understanding the Settings Setting Function Practical Impact ATR Period (14) Controls volatility sampling Higher = smoother lookback adaptation Min Lookback (20) Smallest window allowed Lower = more reactive but noisier Max Lookback (100) Largest window allowed Higher = smoother but slower to react Inverse Candle Chart Flips oscillator vertically Useful when analyzing bearish or inverse scenarios (e.g. short-side fib mapping) Recommended Configs: For scalping/intraday: ATR 10–14, lookback 20–50 For swing/position trading: ATR 14–21, lookback 50–100 🔶 8. Example Trade Logic (Practical Use) Scenario: Uptrend on 4H chart Oscillator drops to below 38.2% → retracement zone Price consolidates → oscillator stabilizes Oscillator crosses above 50% → pullback ending Entry: Long when oscillator crosses above 61.8% Exit: Near 78.6–100% zone or upon divergence with RSI For Short Bias (Inverse Setup): Enable isInverse = true to visually flip the oscillator (so lows become highs). Use the same thresholds inversely. 🔶 9. Strengths & Limitations ✅ Strengths Dynamic, self-adapting to volatility Quantifies Fib retracement as a continuous function Compact oscillator view (no clutter on chart) Works well across all timeframes Compatible with both trending and ranging markets ⚠️ Limitations Doesn’t define trend direction — must be used with structure filters Can whipsaw during choppy consolidations The “lookback auto-adjust” may lag in sudden volatility shifts Shouldn’t be used standalone for entries without structural confluence 🔶 10. Summary The “Fib Oscillator” is a dynamic Fibonacci-relative positioning tool that merges retracement theory with adaptive volatility logic. It gives traders an intuitive, quantified view of where price sits within its recent fib range, allowing anticipation of pullbacks, reversals, or breakout momentum. Think of it as a "Fibonacci RSI", but instead of momentum strength, it shows positional depth — the vibrational location of price within its natural swing cycle.Indicador Pine Script®por TradeMing63
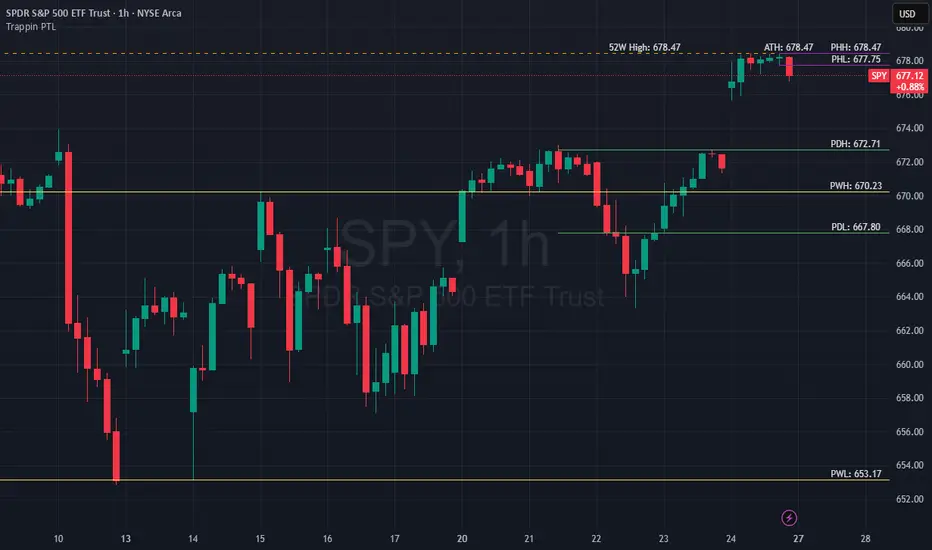
Trappin Previous Timeframe LevelsTrappin Previous Timeframe Levels (Trappin PTL) Overview Trappin PTL is a comprehensive multi-timeframe support and resistance indicator that displays key price levels from multiple timeframes on a single chart. This indicator helps traders identify critical price zones where reversals or breakouts are likely to occur, making it ideal for both intraday and swing trading strategies. 💡 Origin Story I got tired of manually drawing these lines that I learned from watching Wallstreet Trapper on Trappin Tuesdays YouTube live streams. After repeatedly marking the same previous timeframe levels on every chart, I decided to automate the process. Hope it helps you as much as it helps me! Key Features 📊 Multiple Timeframe Levels The indicator tracks and displays high/low levels from: Previous Hour (PHH/PHL) - Purple lines Previous Day (PDH/PDL) - Green lines Previous Week (PWH/PWL) - Yellow lines Previous Month (PMH/PML) - Blue lines All-Time High (ATH) - Red line 52-Week High - Orange line 🎨 Fully Customizable Colors - Change the color of each timeframe independently Line Styles - Choose between Solid, Dashed, or Dotted lines Line Widths - Adjust thickness from 1-4 pixels All settings organized in intuitive groups for easy access 📍 Smart Line Extension Lines extend back to show when the level was established Lines project forward to show current relevance Historical context helps identify key support/resistance zones 🏷️ Clear Price Labels Each level displays its exact price value (no currency symbols) Labels positioned horizontally to avoid overlap Adaptive text color for visibility on any chart theme (dark or light mode) Why "Trappin"? The name is a tribute to Wallstreet Trapper and his Trappin Tuesdays YouTube live streams, where I learned the importance of marking previous timeframe levels. The name also reflects the indicator's purpose: identifying price levels where traders often get "trapped" - whether it's bulls getting trapped below resistance or bears getting trapped above support. These levels represent zones where significant order flow and liquidity exist, making them prime areas for reversals or breakouts. Credits Created by resoh Inspired by Wallstreet Trapper and Trappin Tuesdays YouTube live streams This indicator is provided for educational and informational purposes. Always practice proper risk management and conduct your own analysis before making trading decisions. Version History v1.0 - Initial Release Multi-timeframe high/low levels All-time high tracking 52-week high tracking Fully customizable colors, styles, and widths Adaptive labels with price display Smart line extension showing historical context Indicador Pine Script®por resohActualizado 51
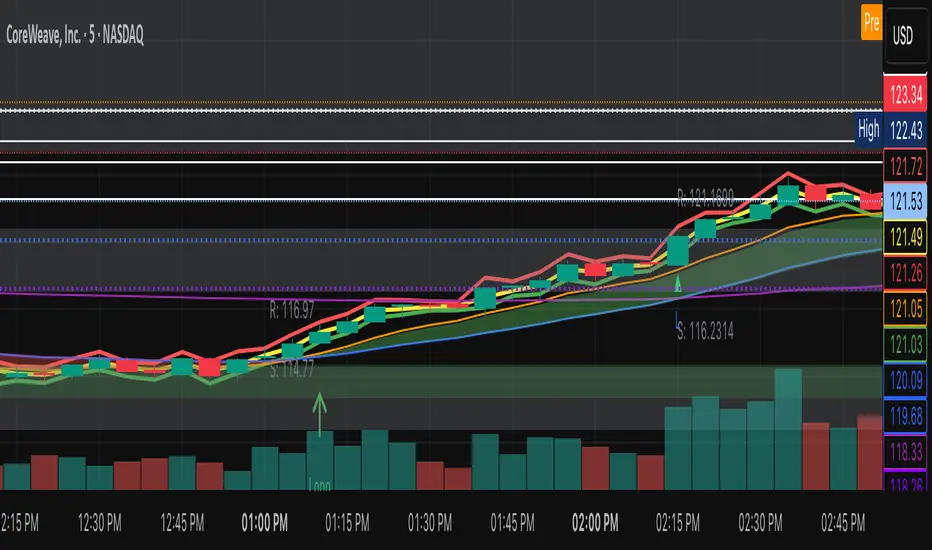
Pullback Finder AutoPullback Finder Auto — Intraday Momentum Cooling Detector Pullback Finder Auto is designed to find stocks that have made a strong intraday run from the open and are now cooling off while still positive — the classic pullback zone where continuation entries often form. It automatically measures the percentage change from today’s open and highlights bars where: the stock has already run at least a chosen amount (for example +10 % above its open), and the current price is still up but within a defined pullback range (for example between +3 % and +8 % above the open). When those two conditions are met, you’ll see green graphics on your chart: Green triangle markers under the candle. Optionally, small green PB labels such as “PB 5.2 %” showing the exact percentage from open when the setup occurs. A green highlight in the sub‑window or line plot if you left the “Change from Open %” plot active. These are your visual cues that a pullback has formed — a stock that previously ran and is now pulling back while holding strength. How it works The script continuously monitors: • High % from Open = (high − open) / open × 100 • Current % from Open = (close − open) / open × 100 A “Pullback” condition triggers only if: the high % is greater than or equal to your minimum run threshold, and the current % sits between your minimum and maximum pullback percentages. When both are true, the indicator plots the green triangle and optional label. Default parameters Min Run % = 10 Min Current % = 3 Max Current % = 8 Session Start = 09:30 – 16:00 US Eastern All can be changed to fit different volatility levels. Lower values catch smaller moves; higher values restrict signals to explosive runners. Using it in real time During live trading, Pullback Finder Auto updates with each candle. When a bar first enters the target zone, a green triangle and PB label will appear immediately under that candle. These are dynamic: if price moves out of the valid zone on the same bar, the marker may disappear. You can create an alert on “Pullback Finder Auto – Pullback Candidate” to be notified whenever new triangles appear across your active symbols. This works on any timeframe: use shorter timeframes such as 1‑minute or 5‑minute charts for fast, intraday detection, use longer timeframes for a broader view of the day’s market structure. Using it on past data (scanning backwards) When you scroll back through history, past green triangles remain visible at every bar where the condition was true at that time. The PB labels next to those candles show exactly how far above the open the stock was trading during the historical setup. Use this for visual back‑testing: study how price reacted after these pullback points, adjust the thresholds, and refine your criteria for different markets. The grey or teal line under the chart (if enabled) shows the percent‑from‑open curve so you can see the full run‑and‑cool pattern leading into each triangle signal. If you convert the indicator into a strategy, the same condition becomes historical entry points you can test with the Strategy Tester. Summary 1. Pullback Finder Auto paints green triangles and PB labels whenever an intraday pullback fits your criteria. 2. It runs dynamically in real‑time and also preserves markers for historical review. 3. Adjust the thresholds to match volatility or timeframe. 4. Ideal for visual scanning, watchlist alerts, or integration into a lightweight screening strategy.Indicador Pine Script®por UpNatem10
Daily Pivot Points LEVELS S-RThis indicator plots daily pivot points based on the previous day’s high, low, and close. It displays the main pivot line, as well as the first levels of support (S1) and resistance (R1), with optional second levels (R2, S2) for additional reference. Ideal forIndicador Pine Script®por swpittillo031627
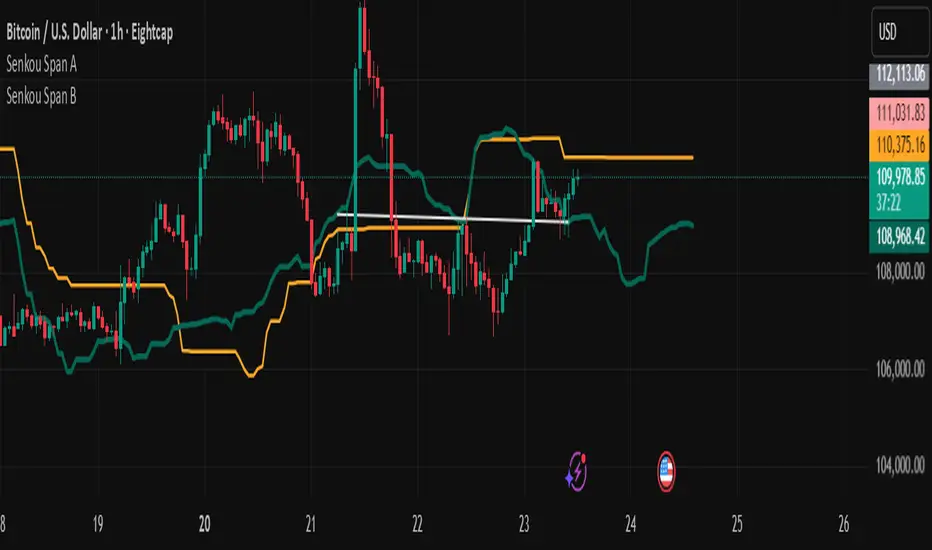
Senkou Span BUsing in conjunction with Senkou Span A to create effective kumo alert signals when kumo changes direction: bullish or bearish.Indicador Pine Script®por salva111111
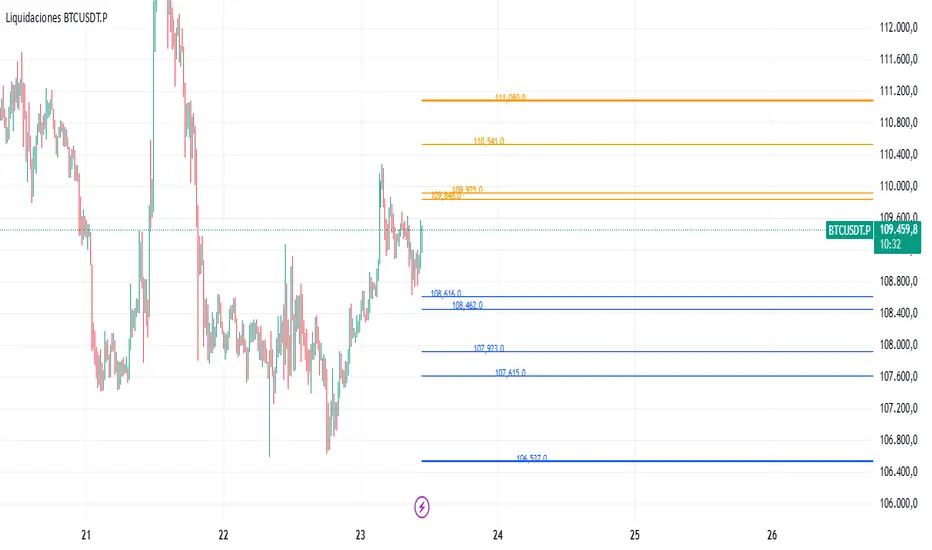
Liquidaciones BTCUSDT.PAllows you to manually record liquidation prices for both short and long positions, which are then displayed on the chart: Orange: Short liquidations Blue: Long liquidations Optionally, a specific liquidation price can be highlighted to indicate higher-volume liquidations Note: All liquidation prices must be entered manually.Indicador Pine Script®por hugfuentes32
RSI Breakout Zones█ OVERVIEW “RSI Breakout Zones” is a technical analysis tool that identifies significant zones on the chart based on the Relative Strength Index (RSI). The indicator maps overbought (OB) and oversold (OS) zones using boxes, then extends them until the next zone of the same type is detected, highlighting breakout points to aid in trade entry decisions. These zones often serve as areas of consolidation, support, or resistance. █ CONCEPTS The indicator identifies overbought (above 70) and oversold (below 30) zones, drawing boxes that extend until the next zone of the same type (OB for OB, OS for OS) is detected. Breakout signals are generated when the price crosses the zone boundaries, indicating potential shifts in market momentum. Why are RSI zones important? These zones represent areas of extreme market sentiment, often leading to corrections or reversals. Overbought zones suggest potential selling pressure, while oversold zones indicate buying opportunities. After a breakout, a zone may switch roles, e.g., from support to resistance or vice versa, making it a key element in price action analysis. Larger zones, formed during high volatility, may attract price for retests due to stronger imbalances in buyer/seller dynamics. Consolidation often occurs within these zones as the market seeks equilibrium before further moves. However, in strong trends, zones may be decisively broken without immediate pullbacks, and their significance depends on their position relative to key support and resistance levels. █ FEATURES - RSI Zone Detection: Calculates RSI with a customizable length (default 14) and identifies overbought/oversold zones based on user-defined levels (default 70/30), drawing boxes that dynamically adjust to price action within the zone. - Customizable Boxes: Zones extend until the next zone of the same type is detected. The indicator draws zones with adjustable colors for overbought (red) and oversold (green) areas, with options for box and zone transparency. - Breakout Signals: Generates upward (green triangle) and downward (red triangle) breakout signals when the price crosses the top or bottom of a zone. Signals appear below or above the bar, indicating potential trade entry points. - Midline: Automatically draws a dashed line at the midpoint of each zone, helping traders assess price behavior within the zone and potential halfway retests. - Box Management: Option to remove outdated boxes. - Alerts: Built-in support for alerts on breakout signals, enabling traders to receive notifications for key zone crossings. █ HOW TO USE Add to Chart: Apply the indicator to your TradingView chart via the Pine Editor or Indicators menu. Configure Settings: - RSI Settings: Adjust RSI Length (default 14), Overbought Level (default 70), and Oversold Level (default 30) to tailor zone detection sensitivity—higher lengths smooth signals for longer-term analysis. - Box Settings: Configure colors and transparency for overbought (red) and oversold (green) zones, including box transparency (default 90) and zone transparency (default 90). - Signal Settings: Customize breakout signal colors (green for upward, red for downward) and enable/disable keeping boxes after RSI normalization. Interpreting Signals: - Upward Breakout Signal: A green triangle below the bar indicates a breakout, suggesting potential bullish momentum and trend continuation or reversal. - Downward Breakout Signal: A red triangle above the bar indicates a breakout, suggesting potential bearish momentum. - RSI Zones: If the price re-enters a zone after a breakout, it may signal a false breakout or consolidation; persistent zones can act as future support/resistance levels. Consolidation often occurs within these zones as the market seeks equilibrium. - Use signals alongside other technical analysis tools for confirmation, such as moving averages (to confirm trend direction), Fibonacci levels (to identify key price zones), or volume indicators (to validate breakout strength). Analyze RSI zones on higher timeframes for stronger signals due to broader market context. █ APPLICATIONS - Momentum Trading: Use RSI zones as overbought/oversold filters. In an uptrend, look for buying opportunities on upward breakouts, and in a downtrend, on downward breakouts. Combining with MACD crossovers, Fibonacci levels, or pivot points enhances zone significance. - Inter-Zone Trading: Utilize breakouts from one RSI zone and hold the position until reaching the next zone, which may act as a target level or reversal point. █ NOTES - Test the indicator across different timeframes and markets (stocks, forex, crypto) to optimize RSI length and levels for your trading style. - For best results, use in trending markets where RSI extremes are more predictive; in ranging markets, additional filters are recommended to reduce false signals. - Always combine with risk management; RSI zones alone do not guarantee reversals, and false breakouts may occur in low-liquidity environments.Indicador Pine Script®por Uncle_the_shooter88 1.5 K
Adaptive Trend 1m ### Overview The "Adaptive Trend Impulse Parallel SL/TP 1m Realistic" strategy is a sophisticated trading system designed specifically for high-volatility markets like cryptocurrencies on 1-minute timeframes. It combines trend-following with momentum filters and adaptive parameters to dynamically adjust to market conditions, ensuring more reliable entries and risk management. This strategy uses SuperTrend for primary trend detection, enhanced by MACD, RSI, Bollinger Bands, and optional volume spikes. It incorporates parallel stop-loss (SL) and multiple take-profit (TP) levels based on ATR, with options for breakeven and trailing stops after the first TP. Optimized for realistic backtesting on short timeframes, it avoids over-optimization by adapting indicators to market speed and efficiency. ### Principles of Operation The strategy operates on the principle of adaptive impulse trading, where entry signals are generated only when multiple conditions align to confirm a strong trend reversal or continuation: 1. **Trend Detection (SuperTrend)**: The core signal comes from an adaptive SuperTrend indicator. It calculates upper and lower bands using ATR (Average True Range) with dynamic periods and multipliers. A buy signal occurs when the price crosses above the lower band (from a downtrend), and a sell signal when it crosses below the upper band (from an uptrend). Adaptation is based on Rate of Change (ROC) to measure market speed, shortening periods in fast markets for quicker responses. 2. **Momentum and Trend Filters**: - **MACD**: Uses adaptive fast and slow lengths. In "Trend Filter" mode (default when "Use MACD Cross" is false), it checks if the MACD line is above/below the signal for long/short. In cross mode, it requires a crossover/crossunder. - **RSI**: Adaptive period RSI must be above 50 for longs and below 50 for shorts, confirming overbought/oversold conditions dynamically. - **Bollinger Bands (BB)**: Depending on the mode ("Midline" by default), it requires the price to be above/below the BB midline for longs/shorts, or a breakout in "Breakout" mode. Deviation adapts to market efficiency. - **Volume Spike Filter** (optional): Entries require volume to exceed an adaptive multiple of its SMA, signaling strong impulse. 3. **Volatility Filter**: Entries are only allowed if current ATR percentage exceeds a historical minimum (adaptive), preventing trades in low-volatility ranges. 4. **Risk Management (Parallel SL/TP)**: - **Stop-Loss**: Set at an adaptive ATR multiple below/above entry for long/short. - **Take-Profits**: Three levels at adaptive ATR multiples, with partial position closures (e.g., 51% at TP1, 25% at TP2, remainder at TP3). - **Post-TP1 Features**: Optional breakeven moves SL to entry after TP1. Trailing SL uses BB midline as a dynamic trail. - All levels are calculated per trade using the ATR at entry, making them "realistic" for 1m charts by widening SL and tightening initial TPs. The strategy enters long on buy signals with all filters met, and short on sell signals. It uses pyramid margin (100% long/short) for full position sizing. Adaptation is driven by: - **Market Speed (normSpeed)**: Based on ROC, tightens multipliers in volatile periods. - **Efficiency Ratio (ER)**: Measures trend strength, adjusting periods for trending vs. ranging markets. This ensures the strategy "adapts" without manual tweaks, reducing false signals in varying conditions. ### Main Advantages - **Adaptability**: Unlike static strategies, parameters dynamically adjust to market volatility and trend strength, improving performance across ranging and trending phases without over-optimization. - **Realistic Risk Management for 1m**: Wider SL and tiered TPs prevent premature stops in noisy short-term charts, while partial profits lock in gains early. Breakeven/trailing options protect profits in extended moves. - **Multi-Filter Confirmation**: Combines trend, momentum, and volume for high-probability entries, reducing whipsaws. The volatility filter avoids flat markets. - **Debug Visualization**: Built-in plots for signals, levels, and component checks (when "Show Debug" is enabled) help users verify logic on charts. - **Efficiency**: Low computational load, suitable for real-time trading on TradingView with alerts. Backtesting shows robust results on volatile assets, with a focus on sustainable risk (e.g., SL at 3x ATR avoids excessive drawdowns). ### Uniqueness What sets this strategy apart is its **fully adaptive framework** integrating multiple indicators with real-time market metrics (ROC for speed, ER for efficiency). Most trend strategies use fixed parameters, leading to poor adaptation; here, every key input (periods, multipliers, deviations) scales dynamically within bounds, creating a "self-tuning" system. The "parallel SL/TP with 1m realism" adds custom handling for micro-timeframes: tightened initial TPs for quick wins and adaptive min-ATR filter to skip low-vol bars. Unlike generic mashups, it justifies the combination—SuperTrend for trend, MACD/RSI/BB for impulse confirmation, volume for conviction—working synergistically to capture "trend impulses" while filtering noise. The post-TP1 breakeven/trailing tied to BB adds a unique profit-locking mechanism not common in open-source scripts. ### Recommended Settings These settings are optimized and recommended for trading ASTER/USDT on Bybit, with 1-minute chart, x10 leverage, and cross margin mode. They provide a balanced risk-reward for this volatile pair: - **Base Inputs**: - Base ATR Period: 10 - Base SuperTrend ATR Multiplier: 2.5 - Base MACD Fast: 8 - Base MACD Slow: 17 - Base MACD Signal: 6 - Base RSI Period: 9 - Base Bollinger Period: 12 - Bollinger Deviation: 1.8 - Base Volume SMA Period: 19 - Base Volume Spike Multiplier: 1.8 - Adaptation Window: 54 - ROC Length: 10 - **TP/SL Settings**: - Use Stop Loss: True - Base SL Multiplier (ATR): 3 - Use Take Profits: True - Base TP1 Multiplier (ATR): 5.5 - Base TP2 Multiplier (ATR): 10.5 - Base TP3 Multiplier (ATR): 19 - TP1 % Position: 51 - TP2 % Position: 25 - Breakeven after TP1: False - Trailing SL after TP1: False - Base Min ATR Filter: 0.001 - Use Volume Spike Filter: True - BB Condition: Midline - Use MACD Cross (false=Trend Filter): True - Show Debug: True For backtesting, use initial capital of 30 USD, base currency USDT, order size 100 USDT, pyramiding 1, commission 0.1%, slippage 0 ticks, long/short margin 0%. Always backtest on your platform and use risk management—risk no more than 1-2% per trade. This is not financial advice; trade at your own risk.Estrategia Pine Script®por Mr_Octopus_22388