Bober XM v2.0# ₿ober XM v2.0 Trading Bot Documentation
**Developer's Note**: While our previous Bot 1.3.1 was removed due to guideline violations, this setback only fueled our determination to create something even better. Rising from this challenge, Bober XM 2.0 emerges not just as an update, but as a complete reimagining with multi-timeframe analysis, enhanced filters, and superior adaptability. This adversity pushed us to innovate further and deliver a strategy that's smarter, more agile, and more powerful than ever before. Challenges create opportunity - welcome to Cryptobeat's finest work yet.
## !!!!You need to tune it for your own pair and timeframe and retune it periodicaly!!!!!
## Overview
The ₿ober XM v2.0 is an advanced dual-channel trading bot with multi-timeframe analysis capabilities. It integrates multiple technical indicators, customizable risk management, and advanced order execution via webhook for automated trading. The bot's distinctive feature is its separate channel systems for long and short positions, allowing for asymmetric trade strategies that adapt to different market conditions across multiple timeframes.
### Key Features
- **Multi-Timeframe Analysis**: Analyze price data across multiple timeframes simultaneously
- **Dual Channel System**: Separate parameter sets for long and short positions
- **Advanced Entry Filters**: RSI, Volatility, Volume, Bollinger Bands, and KEMAD filters
- **Machine Learning Moving Average**: Adaptive prediction-based channels
- **Multiple Entry Strategies**: Breakout, Pullback, and Mean Reversion modes
- **Risk Management**: Customizable stop-loss, take-profit, and trailing stop settings
- **Webhook Integration**: Compatible with external trading bots and platforms
### Strategy Components
| Component | Description |
|---------|-------------|
| **Dual Channel Trading** | Uses either Keltner Channels or Machine Learning Moving Average (MLMA) with separate settings for long and short positions |
| **MLMA Implementation** | Machine learning algorithm that predicts future price movements and creates adaptive bands |
| **Pivot Point SuperTrend** | Trend identification and confirmation system based on pivot points |
| **Three Entry Strategies** | Choose between Breakout, Pullback, or Mean Reversion approaches |
| **Advanced Filter System** | Multiple customizable filters with multi-timeframe support to avoid false signals |
| **Custom Exit Logic** | Exits based on OBV crossover of its moving average combined with pivot trend changes |
### Note for Novice Users
This is a fully featured real trading bot and can be tweaked for any ticker — SOL is just an example. It follows this structure:
1. **Indicator** – gives the initial signal
2. **Entry strategy** – decides when to open a trade
3. **Exit strategy** – defines when to close it
4. **Trend confirmation** – ensures the trade follows the market direction
5. **Filters** – cuts out noise and avoids weak setups
6. **Risk management** – controls losses and protects your capital
To tune it for a different pair, you'll need to start from scratch:
1. Select the timeframe (candle size)
2. Turn off all filters and trend entry/exit confirmations
3. Choose a channel type, channel source and entry strategy
4. Adjust risk parameters
5. Tune long and short settings for the channel
6. Fine-tune the Pivot Point Supertrend and Main Exit condition OBV
This will generate a lot of signals and activity on the chart. Your next task is to find the right combination of filters and settings to reduce noise and tune it for profitability.
### Default Strategy values
Default values are tuned for: Symbol BITGET:SOLUSDT.P 5min candle
Filters are off by default: Try to play with it to understand how it works
## Configuration Guide
### General Settings
| Setting | Description | Default Value |
|---------|-------------|---------------|
| **Long Positions** | Enable or disable long trades | Enabled |
| **Short Positions** | Enable or disable short trades | Enabled |
| **Risk/Reward Area** | Visual display of stop-loss and take-profit zones | Enabled |
| **Long Entry Source** | Price data used for long entry signals | hl2 (High+Low/2) |
| **Short Entry Source** | Price data used for short entry signals | hl2 (High+Low/2) |
The bot allows you to trade long positions, short positions, or both simultaneously. Each direction has its own set of parameters, allowing for fine-tuned strategies that recognize the asymmetric nature of market movements.
### Multi-Timeframe Settings
1. **Enable Multi-Timeframe Analysis**: Toggle 'Enable Multi-Timeframe Analysis' in the Multi-Timeframe Settings section
2. **Configure Timeframes**: Set appropriate higher timeframes based on your trading style:
- Timeframe 1: Default is now 15 minutes (intraday confirmation)
- Timeframe 2: Default is 4 hours (trend direction)
3. **Select Sources per Indicator**: For each indicator (RSI, KEMAD, Volume, etc.), choose:
- The desired timeframe (current, mtf1, or mtf2)
- The appropriate price type (open, high, low, close, hl2, hlc3, ohlc4)
### Entry Strategies
- **Breakout**: Enter when price breaks above/below the channel
- **Pullback**: Enter when price pulls back to the channel
- **Mean Reversion**: Enter when price is extended from the channel
You can enable different strategies for long and short positions.
### Core Components
### Risk Management
- **Position Size**: Control risk with percentage-based position sizing
- **Stop Loss Options**:
- Fixed: Set a specific price or percentage from entry
- ATR-based: Dynamic stop-loss based on market volatility
- Swing: Uses recent swing high/low points
- **Take Profit**: Multiple targets with percentage allocation
- **Trailing Stop**: Dynamic stop that follows price movement
## Advanced Usage Strategies
### Moving Average Type Selection Guide
- **SMA**: More stable in choppy markets, good for higher timeframes
- **EMA/WMA**: More responsive to recent price changes, better for entry signals
- **VWMA**: Adds volume weighting for stronger trends, use with Volume filter
- **HMA**: Balance between responsiveness and noise reduction, good for volatile markets
### Multi-Timeframe Strategy Approaches
- **Trend Confirmation**: Use higher timeframe RSI (mtf2) for overall trend, current timeframe for entries
- **Entry Precision**: Use KEMAD on current timeframe with volume filter on mtf1
- **False Signal Reduction**: Apply RSI filter on mtf1 with strict KEMAD settings
### Market Condition Optimization
| Market Condition | Recommended Settings |
|------------------|----------------------|
| **Trending** | Use Breakout strategy with KEMAD filter on higher timeframe |
| **Ranging** | Use Mean Reversion with strict RSI filter (mtf1) |
| **Volatile** | Increase ATR multipliers, use HMA for moving averages |
| **Low Volatility** | Decrease noise parameters, use pullback strategy |
## Webhook Integration
The strategy features a professional webhook system that allows direct connectivity to your exchange or trading platform of choice through third-party services like 3commas, Alertatron, or Autoview.
The webhook payload includes all necessary parameters for automated execution:
- Entry price and direction
- Stop loss and take profit levels
- Position size
- Custom identifier for webhook routing
## Performance Optimization Tips
1. **Start with Defaults**: Begin with the default settings for your timeframe before customizing
2. **Adjust One Component at a Time**: Make incremental changes and test the impact
3. **Match MA Types to Market Conditions**: Use appropriate moving average types based on the Market Condition Optimization table
4. **Timeframe Synergy**: Create logical relationships between timeframes (e.g., 5min chart with 15min and 4h higher timeframes)
5. **Periodic Retuning**: Markets evolve - regularly review and adjust parameters
## Common Setups
### Crypto Trend-Following
- MLMA with EMA or HMA
- Higher RSI thresholds (75/25)
- KEMAD filter on mtf1
- Breakout entry strategy
### Stock Swing Trading
- MLMA with SMA for stability
- Volume filter with higher threshold
- KEMAD with increased filter order
- Pullback entry strategy
### Forex Scalping
- MLMA with WMA and lower noise parameter
- RSI filter on current timeframe
- Use highest timeframe for trend direction only
- Mean Reversion strategy
## Webhook Configuration
- **Benefits**:
- Automated trade execution without manual intervention
- Immediate response to market conditions
- Consistent execution of your strategy
- **Implementation Notes**:
- Requires proper webhook configuration on your exchange or platform
- Test thoroughly with small position sizes before full deployment
- Consider latency between signal generation and execution
### Backtesting Period
Define a specific historical period to evaluate the bot's performance:
| Setting | Description | Default Value |
|---------|-------------|---------------|
| **Start Date** | Beginning of backtest period | January 1, 2025 |
| **End Date** | End of backtest period | December 31, 2026 |
- **Best Practice**: Test across different market conditions (bull markets, bear markets, sideways markets)
- **Limitation**: Past performance doesn't guarantee future results
## Entry and Exit Strategies
### Dual-Channel System
A key innovation of the Bober XM is its dual-channel approach:
- **Independent Parameters**: Each trade direction has its own channel settings
- **Asymmetric Trading**: Recognizes that markets often behave differently in uptrends versus downtrends
- **Optimized Performance**: Fine-tune settings for both bullish and bearish conditions
This approach allows the bot to adapt to the natural asymmetry of markets, where uptrends often develop gradually while downtrends can be sharp and sudden.
### Channel Types
#### 1. Keltner Channels
Traditional volatility-based channels using EMA and ATR:
| Setting | Long Default | Short Default |
|---------|--------------|---------------|
| **EMA Length** | 37 | 20 |
| **ATR Length** | 13 | 17 |
| **Multiplier** | 1.4 | 1.9 |
| **Source** | low | high |
- **Strengths**:
- Reliable in trending markets
- Less prone to whipsaws than Bollinger Bands
- Clear visual representation of volatility
- **Weaknesses**:
- Can lag during rapid market changes
- Less effective in choppy, non-trending markets
#### 2. Machine Learning Moving Average (MLMA)
Advanced predictive model using kernel regression (RBF kernel):
| Setting | Description | Options |
|---------|-------------|--------|
| **Source MA** | Price data used for MA calculations | Any price source (low/high/close/etc.) |
| **Moving Average Type** | Type of MA algorithm for calculations | SMA, EMA, WMA, VWMA, RMA, HMA |
| **Trend Source** | Price data used for trend determination | Any price source (close default) |
| **Window Size** | Historical window for MLMA calculations | 5+ (default: 16) |
| **Forecast Length** | Number of bars to forecast ahead | 1+ (default: 3) |
| **Noise Parameter** | Controls smoothness of prediction | 0.01+ (default: ~0.43) |
| **Band Multiplier** | Multiplier for channel width | 0.1+ (default: 0.5-0.6) |
- **Strengths**:
- Predictive rather than reactive
- Adapts quickly to changing market conditions
- Better at identifying trend reversals early
- **Weaknesses**:
- More computationally intensive
- Requires careful parameter tuning
- Can be sensitive to input data quality
### Entry Strategies
| Strategy | Description | Ideal Market Conditions |
|----------|-------------|-------------------------|
| **Breakout** | Enters when price breaks through channel bands, indicating strong momentum | High volatility, emerging trends |
| **Pullback** | Enters when price retraces to the middle band after testing extremes | Established trends with regular pullbacks |
| **Mean Reversion** | Enters at channel extremes, betting on a return to the mean | Range-bound or oscillating markets |
#### Breakout Strategy (Default)
- **Implementation**: Enters long when price crosses above the upper band, short when price crosses below the lower band
- **Strengths**: Captures strong momentum moves, performs well in trending markets
- **Weaknesses**: Can lead to late entries, higher risk of false breakouts
- **Optimization Tips**:
- Increase channel multiplier for fewer but more reliable signals
- Combine with volume confirmation for better accuracy
#### Pullback Strategy
- **Implementation**: Enters long when price pulls back to middle band during uptrend, short during downtrend pullbacks
- **Strengths**: Better entry prices, lower risk, higher probability setups
- **Weaknesses**: Misses some strong moves, requires clear trend identification
- **Optimization Tips**:
- Use with trend filters to confirm overall direction
- Adjust middle band calculation for market volatility
#### Mean Reversion Strategy
- **Implementation**: Enters long at lower band, short at upper band, expecting price to revert to the mean
- **Strengths**: Excellent entry prices, works well in ranging markets
- **Weaknesses**: Dangerous in strong trends, can lead to fighting the trend
- **Optimization Tips**:
- Implement strong trend filters to avoid counter-trend trades
- Use smaller position sizes due to higher risk nature
### Confirmation Indicators
#### Pivot Point SuperTrend
Combines pivot points with ATR-based SuperTrend for trend confirmation:
| Setting | Default Value |
|---------|---------------|
| **Pivot Period** | 25 |
| **ATR Factor** | 2.2 |
| **ATR Period** | 41 |
- **Function**: Identifies significant market turning points and confirms trend direction
- **Implementation**: Requires price to respect the SuperTrend line for trade confirmation
#### Weighted Moving Average (WMA)
Provides additional confirmation layer for entries:
| Setting | Default Value |
|---------|---------------|
| **Period** | 15 |
| **Source** | ohlc4 (average of Open, High, Low, Close) |
- **Function**: Confirms trend direction and filters out low-quality signals
- **Implementation**: Price must be above WMA for longs, below for shorts
### Exit Strategies
#### On-Balance Volume (OBV) Based Exits
Uses volume flow to identify potential reversals:
| Setting | Default Value |
|---------|---------------|
| **Source** | ohlc4 |
| **MA Type** | HMA (Options: SMA, EMA, WMA, RMA, VWMA, HMA) |
| **Period** | 22 |
- **Function**: Identifies divergences between price and volume to exit before reversals
- **Implementation**: Exits when OBV crosses its moving average in the opposite direction
- **Customizable MA Type**: Different MA types provide varying sensitivity to OBV changes:
- **SMA**: Traditional simple average, equal weight to all periods
- **EMA**: More weight to recent data, responds faster to price changes
- **WMA**: Weighted by recency, smoother than EMA
- **RMA**: Similar to EMA but smoother, reduces noise
- **VWMA**: Factors in volume, helpful for OBV confirmation
- **HMA**: Reduces lag while maintaining smoothness (default)
#### ADX Exit Confirmation
Uses Average Directional Index to confirm trend exhaustion:
| Setting | Default Value |
|---------|---------------|
| **ADX Threshold** | 35 |
| **ADX Smoothing** | 60 |
| **DI Length** | 60 |
- **Function**: Confirms trend weakness before exiting positions
- **Implementation**: Requires ADX to drop below threshold or DI lines to cross
## Filter System
### RSI Filter
- **Function**: Controls entries based on momentum conditions
- **Parameters**:
- Period: 15 (default)
- Overbought level: 71
- Oversold level: 23
- Multi-timeframe support: Current, MTF1 (15min), or MTF2 (4h)
- Customizable price source (open, high, low, close, hl2, hlc3, ohlc4)
- **Implementation**: Blocks long entries when RSI > overbought, short entries when RSI < oversold
### Volatility Filter
- **Function**: Prevents trading during excessive market volatility
- **Parameters**:
- Measure: ATR (Average True Range)
- Period: Customizable (default varies by timeframe)
- Threshold: Adjustable multiplier
- Multi-timeframe support
- Customizable price source
- **Implementation**: Blocks trades when current volatility exceeds threshold × average volatility
### Volume Filter
- **Function**: Ensures adequate market liquidity for trades
- **Parameters**:
- Threshold: 0.4× average (default)
- Measurement period: 5 (default)
- Moving average type: Customizable (HMA default)
- Multi-timeframe support
- Customizable price source
- **Implementation**: Requires current volume to exceed threshold × average volume
### Bollinger Bands Filter
- **Function**: Controls entries based on price relative to statistical boundaries
- **Parameters**:
- Period: Customizable
- Standard deviation multiplier: Adjustable
- Moving average type: Customizable
- Multi-timeframe support
- Customizable price source
- **Implementation**: Can require price to be within bands or breaking out of bands depending on strategy
### KEMAD Filter (Kalman EMA Distance)
- **Function**: Advanced trend confirmation using Kalman filter algorithm
- **Parameters**:
- Process Noise: 0.35 (controls smoothness)
- Measurement Noise: 24 (controls reactivity)
- Filter Order: 6 (higher = more smoothing)
- ATR Length: 8 (for bandwidth calculation)
- Upper Multiplier: 2.0 (for long signals)
- Lower Multiplier: 2.7 (for short signals)
- Multi-timeframe support
- Customizable visual indicators
- **Implementation**: Generates signals based on price position relative to Kalman-filtered EMA bands
## Risk Management System
### Position Sizing
Automatically calculates position size based on account equity and risk parameters:
| Setting | Default Value |
|---------|---------------|
| **Risk % of Equity** | 50% |
- **Implementation**:
- Position size = (Account equity × Risk %) ÷ (Entry price × Stop loss distance)
- Adjusts automatically based on volatility and stop placement
- **Best Practices**:
- Start with lower risk percentages (1-2%) until strategy is proven
- Consider reducing risk during high volatility periods
### Stop-Loss Methods
Multiple stop-loss calculation methods with separate configurations for long and short positions:
| Method | Description | Configuration |
|--------|-------------|---------------|
| **ATR-Based** | Dynamic stops based on volatility | ATR Period: 14, Multiplier: 2.0 |
| **Percentage** | Fixed percentage from entry | Long: 1.5%, Short: 1.5% |
| **PIP-Based** | Fixed currency unit distance | 10.0 pips |
- **Implementation Notes**:
- ATR-based stops adapt to changing market volatility
- Percentage stops maintain consistent risk exposure
- PIP-based stops provide precise control in stable markets
### Trailing Stops
Locks in profits by adjusting stop-loss levels as price moves favorably:
| Setting | Default Value |
|---------|---------------|
| **Stop-Loss %** | 1.5% |
| **Activation Threshold** | 2.1% |
| **Trailing Distance** | 1.4% |
- **Implementation**:
- Initial stop remains fixed until profit reaches activation threshold
- Once activated, stop follows price at specified distance
- Locks in profit while allowing room for normal price fluctuations
### Risk-Reward Parameters
Defines the relationship between risk and potential reward:
| Setting | Default Value |
|---------|---------------|
| **Risk-Reward Ratio** | 1.4 |
| **Take Profit %** | 2.4% |
| **Stop-Loss %** | 1.5% |
- **Implementation**:
- Take profit distance = Stop loss distance × Risk-reward ratio
- Higher ratios require fewer winning trades for profitability
- Lower ratios increase win rate but reduce average profit
### Filter Combinations
The strategy allows for simultaneous application of multiple filters:
- **Recommended Combinations**:
- Trending markets: RSI + KEMAD filters
- Ranging markets: Bollinger Bands + Volatility filters
- All markets: Volume filter as minimum requirement
- **Performance Impact**:
- Each additional filter reduces the number of trades
- Quality of remaining trades typically improves
- Optimal combination depends on market conditions and timeframe
### Multi-Timeframe Filter Applications
| Filter Type | Current Timeframe | MTF1 (15min) | MTF2 (4h) |
|-------------|-------------------|-------------|------------|
| RSI | Quick entries/exits | Intraday trend | Overall trend |
| Volume | Immediate liquidity | Sustained support | Market participation |
| Volatility | Entry timing | Short-term risk | Regime changes |
| KEMAD | Precise signals | Trend confirmation | Major reversals |
## Visual Indicators and Chart Analysis
The bot provides comprehensive visual feedback on the chart:
- **Channel Bands**: Keltner or MLMA bands showing potential support/resistance
- **Pivot SuperTrend**: Colored line showing trend direction and potential reversal points
- **Entry/Exit Markers**: Annotations showing actual trade entries and exits
- **Risk/Reward Zones**: Visual representation of stop-loss and take-profit levels
These visual elements allow for:
- Real-time strategy assessment
- Post-trade analysis and optimization
- Educational understanding of the strategy logic
## Implementation Guide
### TradingView Setup
1. Load the script in TradingView Pine Editor
2. Apply to your preferred chart and timeframe
3. Adjust parameters based on your trading preferences
4. Enable alerts for webhook integration
### Webhook Integration
1. Configure webhook URL in TradingView alerts
2. Set up receiving endpoint on your trading platform
3. Define message format matching the bot's output
4. Test with small position sizes before full deployment
### Optimization Process
1. Backtest across different market conditions
2. Identify parameter sensitivity through multiple tests
3. Focus on risk management parameters first
4. Fine-tune entry/exit conditions based on performance metrics
5. Validate with out-of-sample testing
## Performance Considerations
### Strengths
- Adaptability to different market conditions through dual channels
- Multiple layers of confirmation reducing false signals
- Comprehensive risk management protecting capital
- Machine learning integration for predictive edge
### Limitations
- Complex parameter set requiring careful optimization
- Potential over-optimization risk with so many variables
- Computational intensity of MLMA calculations
- Dependency on proper webhook configuration for execution
### Best Practices
- Start with conservative risk settings (1-2% of equity)
- Test thoroughly in demo environment before live trading
- Monitor performance regularly and adjust parameters
- Consider market regime changes when evaluating results
## Conclusion
The ₿ober XM v2.0 represents a significant evolution in trading strategy design, combining traditional technical analysis with machine learning elements and multi-timeframe analysis. The core strength of this system lies in its adaptability and recognition of market asymmetry.
### Market Asymmetry and Adaptive Approach
The strategy acknowledges a fundamental truth about markets: bullish and bearish phases behave differently and should be treated as distinct environments. The dual-channel system with separate parameters for long and short positions directly addresses this asymmetry, allowing for optimized performance regardless of market direction.
### Targeted Backtesting Philosophy
It's counterproductive to run backtests over excessively long periods. Markets evolve continuously, and strategies that worked in previous market regimes may be ineffective in current conditions. Instead:
- Test specific market phases separately (bull markets, bear markets, range-bound periods)
- Regularly re-optimize parameters as market conditions change
- Focus on recent performance with higher weight than historical results
- Test across multiple timeframes to ensure robustness
### Multi-Timeframe Analysis as a Game-Changer
The integration of multi-timeframe analysis fundamentally transforms the strategy's effectiveness:
- **Increased Safety**: Higher timeframe confirmations reduce false signals and improve trade quality
- **Context Awareness**: Decisions made with awareness of larger trends reduce adverse entries
- **Adaptable Precision**: Apply strict filters on lower timeframes while maintaining awareness of broader conditions
- **Reduced Noise**: Higher timeframe data naturally filters market noise that can trigger poor entries
The ₿ober XM v2.0 provides traders with a framework that acknowledges market complexity while offering practical tools to navigate it. With proper setup, realistic expectations, and attention to changing market conditions, it delivers a sophisticated approach to systematic trading that can be continuously refined and optimized.
Puntos pivote y niveles

SMPivot Gaussian Trend Strategy [Js.K]This open-source strategy combines a Gaussian-weighted moving average with “Smart Money” swing-pivot breaks (BoS = Break-of-Structure) to capture trend continuations and early reversals. It is intended for educational and research purposes only and must not be interpreted as financial advice.
How the logic works
-------------------
1. Gaussian Moving Average (GMA)
• A custom Gaussian kernel (length = 30 by default) smooths price while preserving turning points.
• A second pass (“Smoothed GMA”) further filters noise; only its direction is used for bias.
2. Swing-Pivot detection
• High/Low pivots are found with a symmetric look-back/forward window (Pivot Length = 20).
• The most recent confirmed pivot creates a dynamic structure level (UpdatedHigh / UpdatedLow).
3. Entry rules
Long
• Price closes above the most recent pivot high **and** above Smoothed GMA.
Short
• Price closes below the most recent pivot low **and** below Smoothed GMA.
4. Exit rules
• Fixed stop-loss and take-profit in percent of current price (user-defined).
• Separate parameters and on/off switches for longs and shorts.
5. Visuals
• GMA (dots) and Smoothed GMA (line).
• Structure break lines plus “BoS PH/PL” labels at the midpoint between pivot and break.
Inputs
------
Gaussian
• Gaussian Length (default 30) – smoothing window.
• Gaussian Scatterplot – toggle GMA dots.
Smart-Money Pivot
• Pivot Length (default 20).
• Bull / Bear colors.
Risk settings
• Long / Short enable.
• Individual SL % and TP % (default 1 % SL, 30 % TP).
• Strategy uses percent-of-equity sizing; initial capital defaults to 10 000 USD.
Adjust these to reflect your own account size, realistic commission and slippage.
Best practice & compliance notes
--------------------------------
• Test on a data sample that yields ≥ 100 trades to obtain statistically relevant results.
• Keep risk per trade below 5–10 % of equity; the default values comply with this guideline.
• Explain any custom settings you publish that differ from the defaults.
• Do **not** remove the code header or licence notice (MPL-2.0).
• Include realistic commission and slippage in your back-test before publishing.
• The script does **not** repaint; orders are processed on bar close.
Usage
-----
1. Add the script to any symbol / timeframe; intraday and swing timeframes both work—adjust lengths accordingly.
2. Configure SL/TP and position size to match your personal risk management.
3. Run “List of trades” and the performance summary to evaluate expectancy; forward-test before live use.
Disclaimer
----------
Trading involves substantial risk. Past performance based on back-testing is not necessarily indicative of future results. The author is **not** responsible for any financial losses arising from the use of this script.

Smart Money Pivot Strategy [Jason Kasei]This strategy is designed to identify key pivot points (Pivot High and Pivot Low) in the market and leverage the "Smart Money" concept to capture price breakout opportunities. It supports both long and short trades, offering customizable stop-loss (SL) and take-profit (TP) settings, while visually plotting pivot points and breakout signals on the chart.
Core Features
Pivot Point Detection:
Utilizes ta.pivothigh and ta.pivotlow functions to detect the highest (Pivot High) and lowest (Pivot Low) points within a specified period (default: 20 bars).
Trading Signals:
Long Signal: Triggered when the price breaks above a previous Pivot High, indicating a potential uptrend.
Short Signal: Triggered when the price breaks below a previous Pivot Low, indicating a potential downtrend.
How It Works
Detects Pivot High (PH) and Pivot Low (PL) over the specified period and records their price and time.
Triggers a long entry when the price breaks above a Pivot High and a short entry when it falls below a Pivot Low.
Sets exit conditions automatically based on predefined SL and TP percentages after entry.
Plots breakout points and levels on the chart for analysis.
Considerations
The strategy relies on accurate pivot point detection; adjust the period parameter based on market volatility.
In highly volatile markets, consider widening the stop loss to avoid frequent triggering.
Combine with other indicators or analysis methods to validate signals and avoid blind trading.

PVSRA v5Overview of the PVSRA Strategy
This strategy is designed to detect and capitalize on volume-driven threshold breaches in price candles. It operates on the premise that when a high-volume candle breaks a critical price threshold, not all orders are filled within that candle’s range. This creates an imbalance—similar to a physical system being perturbed—causing the price to revert toward the level where the breach occurred to “absorb” the residual orders.
Key Features and Their Theoretical Underpinnings
Dynamic Volume Analysis and Threshold Detection
Volume Surges as Market Perturbations:
The script computes a moving average of volume over a short window and flags moments when the current volume significantly exceeds this average. These surges act as a perturbation—injecting “energy” into the market.
Adaptive Abnormal Volume Threshold:
By calculating a dynamic abnormal threshold using a daily volume average (via an 89-period VWMA) and standard deviation, the strategy identifies when the current volume is abnormally high. This mechanism mirrors the idea that when a system is disturbed (here, by a volume surge), it naturally seeks to return to equilibrium.
Candle Coloring and Visual Signal Identification
Differentiation of Candle Types:
The script distinguishes between bullish (green) and bearish (red) candles. It applies different colors based on the strength of the volume signal, providing a clear, visual representation of whether a candle is likely to trigger a price reversion.
Implication of Unfilled Orders:
A red (bearish) candle with high volume implies that sell pressure has pushed the price past a critical threshold—yet not all buy orders have been fulfilled. Conversely, a green (bullish) candle indicates that aggressive buying has left pending sell orders. In both cases, the market is expected to reverse toward the breach point to restore balance.
Trade Execution Logic: Normal and Reversal Trades
Normal Trades:
When a high-volume candle breaches a threshold and meets the directional conditions (e.g., a red candle paired with price above a daily upper band), the strategy enters a trade anticipating a reversion. The underlying idea is that the market will move back to the level where the threshold was crossed—clearing the residual orders in a manner analogous to a system following the path of least resistance.
Reversal Trades:
The strategy also monitors for clusters of consecutive signals within a short lookback period. When multiple signals accumulate, it interprets this as the market having overextended and, in a corrective move, reverses the typical trade direction. This inversion captures the market’s natural tendency to “correct” itself by moving in discrete, quantized steps—each step representing the absorption of a minimum quantum of order imbalance.
Risk and Trade Management
Stop Loss and Take Profit Buffers:
Both normal and reversal trades include predetermined buffers for stop loss and take profit levels. This systematic risk management approach is designed to capture the anticipated reversion while minimizing potential losses, aligning with the idea that market corrections follow the most energy-efficient path back to equilibrium.
Symbol Flexibility:
An option to override the chart’s symbol allows the strategy to be applied consistently across different markets, ensuring that the volume and price dynamics are analyzed uniformly.
Conceptual Bridge: From Market Dynamics to Trade Execution
At its core, the strategy treats market price movements much like a physical system that seeks to minimize “transactional energy” or inefficiency. When a price candle breaches a key threshold on high volume, it mimics an injection of energy into the system. The subsequent price reversion is the market’s natural response—moving in the most efficient path back to balance. This perspective is akin to the principle of least action, where the system evolves along the trajectory that minimizes cumulative imbalance, and it acknowledges that these corrections occur in discrete steps reflective of quantized order execution.
This unified framework allows the PVSRA strategy to not only identify when significant volume-based threshold breaches occur but also to systematically execute trades that benefit from the expected corrective moves.

Rally Base Drop SND Pivots Strategy [LuxAlgo X PineIndicators]This strategy is based on the Rally Base Drop (RBD) SND Pivots indicator developed by LuxAlgo. Full credit for the concept and original indicator goes to LuxAlgo.
The Rally Base Drop SND Pivots Strategy is a non-repainting supply and demand trading system that detects pivot points based on Rally, Base, and Drop (RBD) candles. This strategy automatically identifies key market structure levels, allowing traders to:
Identify pivot-based supply and demand (SND) zones.
Use fixed criteria for trend continuation or reversals.
Filter out market noise by requiring structured price formations.
Enter trades based on breakouts of key SND pivot levels.
How the Rally Base Drop SND Pivots Strategy Works
1. Pivot Point Detection Using RBD Candles
The strategy follows a rigid market structure methodology, where pivots are detected only when:
A Rally (R) consists of multiple consecutive bullish candles.
A Drop (D) consists of multiple consecutive bearish candles.
A Base (B) is identified as a transition between Rallies and Drops, acting as a pivot point.
The pivot level is confirmed when the formation is complete.
Unlike traditional fractal-based pivots, RBD Pivots enforce stricter structural rules, ensuring that each pivot:
Has a well-defined bullish or bearish price movement.
Reduces false signals caused by single-bar fluctuations.
Provides clear supply and demand levels based on structured price movements.
These pivot levels are drawn on the chart using color-coded boxes:
Green zones represent bullish pivot levels (Rally Base formations).
Red zones represent bearish pivot levels (Drop Base formations).
Once a pivot is confirmed, the high or low of the base candle is used as the reference level for future trades.
2. Trade Entry Conditions
The strategy allows traders to select from three trading modes:
Long Only – Only takes long trades when bullish pivot breakouts occur.
Short Only – Only takes short trades when bearish pivot breakouts occur.
Long & Short – Trades in both directions based on pivot breakouts.
Trade entry signals are triggered when price breaks through a confirmed pivot level:
Long Entry:
A bullish pivot level is formed.
Price breaks above the bullish pivot level.
The strategy enters a long position.
Short Entry:
A bearish pivot level is formed.
Price breaks below the bearish pivot level.
The strategy enters a short position.
The strategy includes an optional mode to reverse long and short conditions, allowing traders to experiment with contrarian entries.
3. Exit Conditions Using ATR-Based Risk Management
This strategy uses the Average True Range (ATR) to calculate dynamic stop-loss and take-profit levels:
Stop-Loss (SL): Placed 1 ATR below entry for long trades and 1 ATR above entry for short trades.
Take-Profit (TP): Set using a Risk-Reward Ratio (RR) multiplier (default = 6x ATR).
When a trade is opened:
The entry price is recorded.
ATR is calculated at the time of entry to determine stop-loss and take-profit levels.
Trades exit automatically when either SL or TP is reached.
If reverse conditions mode is enabled, stop-loss and take-profit placements are flipped.
Visualization & Dynamic Support/Resistance Levels
1. Pivot Boxes for Market Structure
Each pivot is marked with a colored box:
Green boxes indicate bullish demand zones.
Red boxes indicate bearish supply zones.
These boxes remain on the chart to act as dynamic support and resistance levels, helping traders identify key price reaction zones.
2. Horizontal Entry, Stop-Loss, and Take-Profit Lines
When a trade is active, the strategy plots:
White line → Entry price.
Red line → Stop-loss level.
Green line → Take-profit level.
Labels display the exact entry, SL, and TP values, updating dynamically as price moves.
Customization Options
This strategy offers multiple adjustable settings to optimize performance for different market conditions:
Trade Mode Selection → Choose between Long Only, Short Only, or Long & Short.
Pivot Length → Defines the number of required Rally & Drop candles for a pivot.
ATR Exit Multiplier → Adjusts stop-loss distance based on ATR.
Risk-Reward Ratio (RR) → Modifies take-profit level relative to risk.
Historical Lookback → Limits how far back pivot zones are displayed.
Color Settings → Customize pivot box colors for bullish and bearish setups.
Considerations & Limitations
Pivot Breakouts Do Not Guarantee Reversals. Some pivot breaks may lead to continuation moves instead of trend reversals.
Not Optimized for Low Volatility Conditions. This strategy works best in trending markets with strong momentum.
ATR-Based Stop-Loss & Take-Profit May Require Optimization. Different assets may require different ATR multipliers and RR settings.
Market Noise May Still Influence Pivots. While this method filters some noise, fake breakouts can still occur.
Conclusion
The Rally Base Drop SND Pivots Strategy is a non-repainting supply and demand system that combines:
Pivot-based market structure analysis (using Rally, Base, and Drop candles).
Breakout-based trade entries at confirmed SND levels.
ATR-based dynamic risk management for stop-loss and take-profit calculation.
This strategy helps traders:
Identify high-probability supply and demand levels.
Trade based on structured market pivots.
Use a systematic approach to price action analysis.
Automatically manage risk with ATR-based exits.
The strict pivot detection rules and built-in breakout validation make this strategy ideal for traders looking to:
Trade based on market structure.
Use defined support & resistance levels.
Reduce noise compared to traditional fractals.
Implement a structured supply & demand trading model.
This strategy is fully customizable, allowing traders to adjust parameters to fit their market and trading style.
Full credit for the original concept and indicator goes to LuxAlgo.

Breakouts With Timefilter Strategy [LuciTech]This strategy captures breakout opportunities using pivot high/low breakouts while managing risk through dynamic stop-loss placement and position sizing. It includes a time filter to limit trades to specific sessions.
How It Works
A long trade is triggered when price closes above a pivot high, and a short trade when price closes below a pivot low.
Stop-loss can be set using ATR, prior candle high/low, or a fixed point value. Take-profit is based on a risk-reward multiplier.
Position size adjusts based on the percentage of equity risked.
Breakout signals are marked with triangles, and entry, stop-loss, and take-profit levels are plotted.
moving average filter: Bullish breakouts only trigger above the MA, bearish breakouts below.
The time filter shades the background during active trading hours.
Customization:
Adjustable pivot length for breakout sensitivity.
Risk settings: percentage risked, risk-reward ratio, and stop-loss type.
ATR settings: length, smoothing method (RMA, SMA, EMA, WMA).
Moving average filter (SMA, EMA, WMA, VWMA, HMA) to confirm breakouts.

Trend Vanguard StrategyHow to Use:
Trend Vanguard Strategy is a multi-feature Pine Script strategy designed to identify market pivots, draw dynamic support/resistance, and generate trade signals via ZigZag breakouts. Here’s how it works and how to use it:
ZigZag Detection & Pivot Points
The script locates significant swing highs and lows using configurable Depth, Deviation, and Backstep values.
It then connects these pivots with lines (ZigZag) to highlight directional changes and prints labels (“Buy,” “Sell,” etc.) at key turning points.
Support & Resistance Trendlines
Pivot highs and lows are used to draw dashed S/R lines in real-time.
When price crosses these lines, the script triggers a breakout signal (long or short).
EMA Overlays
Up to four EMAs (with customizable lengths and colors) can be overlaid on the chart for added trend confirmation.
Enable/disable each EMA independently via the settings.
Repaint Option
Turning on “Smooth Indicator Lines” (repaint) uses future data to refine past pivots.
This can make historical signals look cleaner but does not reflect true historical conditions.
Turning it off ensures signals remain fixed once they appear.
Strategy Entries & Exits
On each new ZigZag “Buy” or “Sell” signal, the script closes any open position and flips to the opposite side (if desired).
Works with the built-in TradingView Strategy engine for backtesting.
Additional Inputs (Placeholders)
Volume Filter and RSI Filter settings exist but are not fully implemented in the current code. Future versions may incorporate these filters more directly.
How to Use
Add to Chart: Click “Indicators” → “Invite-Only Scripts” (or “My Scripts”) and select “Trend Vanguard Strategy.”
Configure Settings:
Adjust ZigZag Depth, Deviation, and Backstep to fine-tune pivot sensitivity.
Enable or disable each EMA to see how it aligns with market trends.
Toggle “Smooth Indicator Lines” on or off depending on whether you want repainting.
Backtest and Forward Test:
Use TradingView’s “Strategy Tester” tab to review hypothetical performance.
Remember that repainting can alter past signals if enabled.
Monitor Live:
Watch for breakout triangles or ZigZag labels to identify potential reversal or breakout trades in real time.
Disclaimer: This script is purely educational and not financial advice. Always combine it with sound risk management and thorough analysis. Enjoy exploring the script, and feel free to experiment with the different settings to match your trading style!

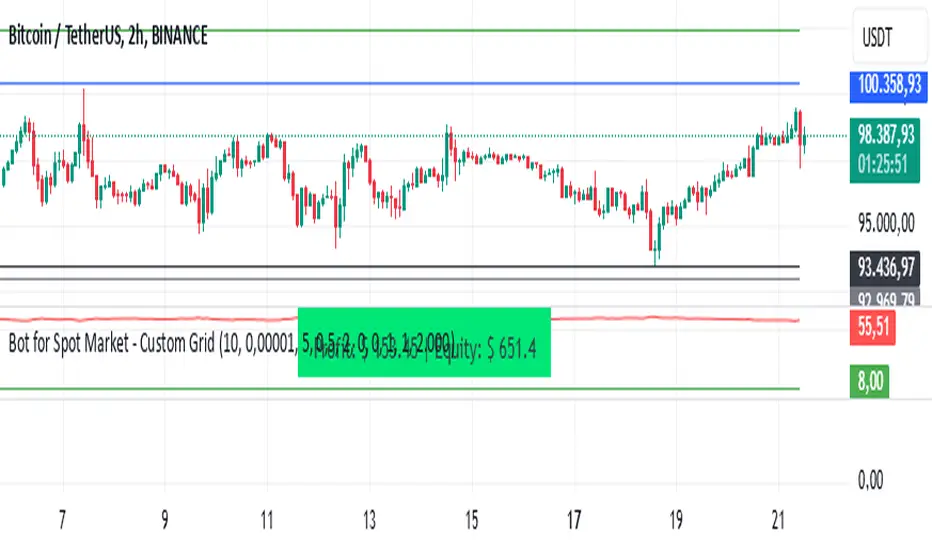
Bot for Spot Market - Custom GridThis script is designed to create a trading bot for the spot market, specifically for buying and selling bitcoins profitably. Recommended for timeframes above two hours. Here are the main functions and features of the script:
Strategy Setup: The bot is set up with a custom grid strategy, defining parameters like pyramiding (allowed number of simultaneous trades), margin requirements, commission, and initial capital.
Order Requirements: It calculates the order price and amount based on the minimum requirements set by the exchange and rounds them appropriately.
Entry Conditions: The bot makes new entries if the closing price falls a certain percentage below the last entry price. It continues to make entries until the closing price rises a certain percentage above the average entry price.
Targets and Plots:
It calculates and plots the target profit level.
It plots the average entry price and the last entry price.
It plots the next entry price based on the defined conditions.
It plots the maximum number of orders allowed based on equity and the number of open orders.
Timerange: The bot can start trading from a specific date and time defined by the user.
Entries: It places orders if the timerange conditions are met. It also places new orders if the closing price is below the last entry price by a defined percentage.
Profit Calculation: The script calculates open profit or loss for the open positions.
Exit Conditions: It closes all positions if the open profit is positive and the closing price is above the target profit level.
Performance Table: The bot maintains and displays statistics like the number of open and closed trades, net profit, and equity in a table format.
The script is customizable, allowing users to adjust parameters like initial capital, commission, order values, and profit targets to fit their specific trading needs and exchange requirements.
Dynamic Support and Resistance Pivot Strategy The Dynamic Support and Resistance Pivot Strategy is a flexible and adaptive tool designed to identify short-term support and resistance levels using the concept of price pivots.
### Key Elements of the Strategy
1. Pivot points as support and resistance levels
Pivots are significant turning points on the price chart, often marking local highs and lows where the price has reversed direction. A pivot high occurs when the price forms a local peak, while a pivot low occurs when the price forms a local trough. When a new pivot high is formed, it creates a resistance level. Conversely, when a new pivot low is formed, it creates a support level.
The strategy continuously updates these levels as new pivots are detected, ensuring they remain relevant to the current market conditions. By identifying these price levels, the strategy dynamically adjusts to market conditions, allowing it to adapt to both trending and ranging markets, since it has a long target and can perform reversal operations.
2. Entry Criteria
- Buy (Long): A long position is triggered when the price is near the support level and then crosses it from below to above. This suggests that the price has found support and may start moving upwards.
- Sell (Short): A short position is triggered when the price is near the resistance level and then crosses it from above to below. This indicates that the price may be reversing and moving downward.
3. Support/Resistance distance (%)
- This parameter establishes a percentage range around the identified support and resistance level. For example, if the Support Resistance Distance is 0.4% (default), the closing price must be within a range of 0.4% above support or below the resistance to be considered "close" and trigger a trade.
4. Exit criteria
- Take profit = 27 %
- Stop loss = 10 %
- Reversal if a new entry point is identified in the opposite direction
5. No Repainting
- The Dynamic Support and Resistance Pivot Strategy is not subject to repainting.
6. Position Sizing by Equity and risk management
- This strategy has a default configuration to operate with 35% of the equity. The stop loss is set to 10% from the entry price. This way, the strategy is putting at risk about 10% of 35% of equity, that is, around 3.5% of equity for each trade. The percentage of equity and stop loss can be adjusted by the user according to their risk management.
7. Backtest results
- This strategy was subjected to backtest and operations in replay mode on **1000000MOGUSDT.P**, with the inclusion of transaction fees at 0.12% and slipagge of 5 ticks, and the past results have shown consistent profitability. Past results are no guarantee of future results. The strategy's backtest results may even be due to overfitting with past data.
8. Chart Visualization
- Support and resistance levels are displayed as green (support) and red (resistance) lines.
- Pivot prices are displayed as green (pivot low) and red (pivot high) labels.
In this image above, the Support/Resistance distance (%) parameter was set to 0.8.
9. Default Configuration
Chart Timeframe: 1h
Pivot Lengh: 2
Support/Resistance distance (%): 0.4*
Stop Loss: 10 %
Take Profit: 27 %
* This parameter can alternatively be set to 0.8.
10. Alternative Configuration
Chart Timeframe: 20 min
Pivot Lengh: 4
Support/Resistance distance (%): 0.1
Stop Loss: 10 %
Take Profit: 25 %
BYBIT:1000000MOGUSDT.P

Swing High/Low Pivots Strategy [LV]The Swing High/Low Pivots Strategy was developed as a counter-momentum trading tool.
The strategy is suitable for any market and the default values used in the input settings menu are set for Bitcoin (best on 15min). These values, expressed in minimum ticks (or pips if symbol is Forex) make this tool perfectly adaptable to every symbol and/or timeframe.
Check tooltips in the settings menu for more details about every user input.
STRTEGY ENTRY & EXIT MECHANISMS:
Trades Entry based on the detection of swing highs and lows for short and long entries respectively, validated by:
- Limit orders placed after each new pivot level confirmation
- Moving averages trend filter (if enabled)
- No active trade currently open
Trades Exit when the price reaches take-profit or stop-loss level as defined in the settings menu. A double entry/second take-profit level can be enabled for partial exits, with dynamic stop-loss adjustment for the remaining position.
Enhanced Trade Precision:
By limiting entries to confirmed swing high (HH, LH) or swing low (HL, LL) pivot points, the strategy ensures that trades occur at levels of significant price reversals. This precision reduces the likelihood of entering trades in the midst of a trend or during uncertain price action.
Risk Management Optimization:
The strategy incorporates clearly defined stop-loss (SL) and take-profit (TP) levels derived from the pivot points. This structured approach minimizes potential losses while locking in profits, which is critical for consistent performance in volatile markets.
Trend Filtering for Better Entry:
The use of a configurable moving average filter adds a layer of trend validation. This prevents entering trades against the dominant market trend, increasing the probability of success for each trade.
Avoidance of Noise:
The lookback period (length parameter) confirms pivots only after a set number of bars, effectively filtering out market noise and ensuring that entries are based on reliable, well-defined price movements.
Adaptability Across Markets:
The strategy is versatile and can be applied across different markets (Forex, stocks, crypto) due to its dynamic use of ticks and pips converters. It adapts seamlessly to varying price scales and asset types.
Dual Quantity Entries:
The original and optionnal double-entry mechanism allows traders to capture both short-term and extended profits by scaling out of positions. This adaptive approach caters to varying risk appetites and market conditions.
Clear Visualization:
The plotted pivot points, entry limits, SL, and TP levels provide visual clarity, making it easy for traders to track the strategy's behavior and make informed decisions.
Automated Execution with Alerts:
Integrated alerts for both entries and exits ensure timely actions without the need for constant market monitoring, enhancing efficiency. Configurable alert messages are suitable for API use.
Any feedback, comments, or suggestions for improvement are always welcome.
Hope you enjoy!

BBSR Extreme Strategy [nachodog]The Bollinger Bands Stochastic RSI Extreme Strategy is a comprehensive trading approach designed for use on the TradingView platform, employing a combination of Bollinger Bands and the Stochastic RSI to identify potential entry and exit points in the market. This strategy is converted into Pine Script version 5 and is specifically tailored as a strategy rather than a mere study, allowing traders to simulate and backtest their trades within the TradingView environment.
Strategy Overview:
Bollinger Bands serve as the primary tool for volatility and price level analysis. By calculating the standard deviation of price movements around a simple moving average (SMA), this strategy identifies the upper and lower bounds of price fluctuations, helping traders spot potential reversal points.
Stochastic RSI is used to gauge the momentum by comparing the closing price's position relative to its price range over a certain period. This indicator helps in determining overbought or oversold conditions, providing insights into potential bullish or bearish momentum.
Entry Signals:
Bullish Entry: The strategy signals a long entry when the price moves from below to above the lower Bollinger Band, coupled with a Stochastic RSI indicating an exit from oversold conditions. This suggests an uptrend initiation, prompting a buy order.
Bearish Entry: Conversely, a short entry is signaled when the price drops from above to below the upper Bollinger Band while the Stochastic RSI moves from overbought territory. This condition indicates a potential downtrend, triggering a sell order.
Exit Criteria:
Stop Loss: A key feature of this strategy is the inclusion of a user-defined stop loss percentage, which helps manage risk by specifying the maximum allowable loss per trade.
Bearish Exit for Long Positions: Long positions are exited either when a bearish signal is detected or when the price crosses below the lower Bollinger Band, suggesting a reversal or weakening of the bullish trend.
Bullish Exit for Short Positions: Short positions are closed upon a bullish signal or when the price crosses above the upper Bollinger Band, indicating a potential reversal or diminishing bearish momentum.
Strategy Benefits:
The strategy provides a structured framework for entering and exiting trades, leveraging the strengths of both Bollinger Bands and Stochastic RSI.
It includes parameters for customization, such as the stop loss percentage, allowing traders to align the strategy with their risk tolerance and trading objectives.
The ability to backtest and simulate trades on TradingView enhances its utility, offering insights into the strategy's performance under historical market conditions.
Overall, the Bollinger Bands Stochastic RSI Extreme Strategy is designed for traders who seek to capitalize on trend reversals and momentum shifts, with built-in risk management features to safeguard against significant losses.
TrippleMACDCryptocurrency Scalping Strategy for 1m Timeframe
Introduction:
Welcome to our cutting-edge cryptocurrency scalping strategy tailored specifically for the 1-minute timeframe. By combining three MACD indicators with different parameters and averaging them, along with applying RSI, we've developed a highly effective strategy for maximizing profits in the cryptocurrency market. This strategy is designed for automated trading through our bot, which executes trades using hooks. All trades are calculated for long positions only, ensuring optimal performance in a fast-paced market.
Key Components:
MACD (Moving Average Convergence Divergence):
We've utilized three MACD indicators with varying parameters to capture different aspects of market momentum.
Averaging these MACD indicators helps smooth out noise and provides a more reliable signal for trading decisions.
RSI (Relative Strength Index):
RSI serves as a complementary indicator, providing insights into the strength of bullish trends.
By incorporating RSI, we enhance the accuracy of our entry and exit points, ensuring timely execution of trades.
Strategy Overview:
Long Position Entries:
Initiate long positions when all three MACD indicators signal bullish momentum and the RSI confirms bullish strength.
This combination of indicators increases the probability of successful trades, allowing us to capitalize on uptrends effectively.
Utilizing Linear Regression:
Linear regression is employed to identify consolidation phases in the market.
Recognizing consolidation periods helps us avoid trading during choppy price action, ensuring optimal performance.
Suitability for Grid Trading Bots:
Our strategy is well-suited for grid trading bots due to frequent price fluctuations and opportunities for grid activation.
The strategy's design accounts for price breakthroughs, which are advantageous for grid trading strategies.
Benefits of the Strategy:
Consistent Performance Across Cryptocurrencies:
Through rigorous testing on various cryptocurrency futures contracts, our strategy has demonstrated favorable results across different coins.
Its adaptability makes it a versatile tool for traders seeking consistent profits in the cryptocurrency market.
Integration of Advanced Techniques:
By integrating multiple indicators and employing linear regression, our strategy leverages advanced techniques to enhance trading performance.
This strategic approach ensures a comprehensive analysis of market conditions, leading to well-informed trading decisions.
Conclusion:
Our cryptocurrency scalping strategy offers a sophisticated yet user-friendly approach to trading in the fast-paced environment of the 1-minute timeframe. With its emphasis on automation, accuracy, and adaptability, our strategy empowers traders to navigate the complexities of the cryptocurrency market with confidence. Whether you're a seasoned trader or a novice investor, our strategy provides a reliable framework for achieving consistent profits and maximizing returns on your investment.

AI SuperTrend x Pivot Percentile - Strategy [PresentTrading]█ Introduction and How it is Different
The AI SuperTrend x Pivot Percentile strategy is a sophisticated trading approach that integrates AI-driven analysis with traditional technical indicators. Combining the AI SuperTrend with the Pivot Percentile strategy highlights several key advantages:
1. Enhanced Accuracy in Trend Prediction: The AI SuperTrend utilizes K-Nearest Neighbors (KNN) algorithm for trend prediction, improving accuracy by considering historical data patterns. This is complemented by the Pivot Percentile analysis which provides additional context on trend strength.
2. Comprehensive Market Analysis: The integration offers a multi-faceted approach to market analysis, combining AI insights with traditional technical indicators. This dual approach captures a broader range of market dynamics.
BTC 6H L/S Performance
Local
█ Strategy: How it Works - Detailed Explanation
🔶 AI-Enhanced SuperTrend Indicators
1. SuperTrend Calculation:
- The SuperTrend indicator is calculated using a moving average and the Average True Range (ATR). The basic formula is:
- Upper Band = Moving Average + (Multiplier × ATR)
- Lower Band = Moving Average - (Multiplier × ATR)
- The moving average type (SMA, EMA, WMA, RMA, VWMA) and the length of the moving average and ATR are adjustable parameters.
- The direction of the trend is determined based on the position of the closing price in relation to these bands.
2. AI Integration with K-Nearest Neighbors (KNN):
- The KNN algorithm is applied to predict trend direction. It uses historical price data and SuperTrend values to classify the current trend as bullish or bearish.
- The algorithm calculates the 'distance' between the current data point and historical points. The 'k' nearest data points (neighbors) are identified based on this distance.
- A weighted average of these neighbors' trends (bullish or bearish) is calculated to predict the current trend.
For more please check: Multi-TF AI SuperTrend with ADX - Strategy
🔶 Pivot Percentile Analysis
1. Percentile Calculation:
- This involves calculating the percentile ranks for high and low prices over a set of predefined lengths.
- The percentile function is typically defined as:
- Percentile = Value at (P/100) × (N + 1)th position
- Where P is the desired percentile, and N is the number of data points.
2. Trend Strength Evaluation:
- The calculated percentiles for highs and lows are used to determine the strength of bullish and bearish trends.
- For instance, a high percentile rank in the high prices may indicate a strong bullish trend, and vice versa for bearish trends.
For more please check: Pivot Percentile Trend - Strategy
🔶 Strategy Integration
1. Combining SuperTrend and Pivot Percentile:
- The strategy synthesizes the insights from both AI-enhanced SuperTrend and Pivot Percentile analysis.
- It compares the trend direction indicated by the SuperTrend with the strength of the trend as suggested by the Pivot Percentile analysis.
2. Signal Generation:
- A trading signal is generated when both the AI-enhanced SuperTrend and the Pivot Percentile analysis agree on the trend direction.
- For instance, a bullish signal is generated when both the SuperTrend is bullish, and the Pivot Percentile analysis shows strength in bullish trends.
🔶 Risk Management and Filters
- ADX and DMI Filter: The strategy uses the Average Directional Index (ADX) and the Directional Movement Index (DMI) as filters to assess the trend's strength and direction.
- Dynamic Trailing Stop Loss: Based on the SuperTrend indicator, the strategy dynamically adjusts stop-loss levels to manage risk effectively.
This strategy stands out for its ability to combine real-time AI analysis with established technical indicators, offering traders a nuanced and responsive tool for navigating complex market conditions. The equations and algorithms involved are pivotal in accurately identifying market trends and potential trade opportunities.
█ Usage
To effectively use this strategy, traders should:
1. Understand the AI and Pivot Percentile Indicators: A clear grasp of how these indicators work will enable traders to make informed decisions.
2. Interpret the Signals Accurately: The strategy provides bullish, bearish, and neutral signals. Traders should align these signals with their market analysis and trading goals.
3. Monitor Market Conditions: Given that this strategy is sensitive to market dynamics, continuous monitoring is crucial for timely decision-making.
4. Adjust Settings as Needed: Traders should feel free to tweak the input parameters to suit their trading preferences and to respond to changing market conditions.
█Default Settings and Their Impact on Performance
1. Trading Direction (Default: "Both")
Effect: Determines whether the strategy will take long positions, short positions, or both. Adjusting this setting can align the strategy with the trader's market outlook or risk preference.
2. AI Settings (Neighbors: 3, Data Points: 24)
Neighbors: The number of nearest neighbors in the KNN algorithm. A higher number might smooth out noise but could miss subtle, recent changes. A lower number makes the model more sensitive to recent data but may increase noise.
Data Points: Defines the amount of historical data considered. More data points provide a broader context but may dilute recent trends' impact.
3. SuperTrend Settings (Length: 10, Factor: 3.0, MA Source: "WMA")
Length: Affects the sensitivity of the SuperTrend indicator. A longer length results in a smoother, less sensitive indicator, ideal for long-term trends.
Factor: Determines the bandwidth of the SuperTrend. A higher factor creates wider bands, capturing larger price movements but potentially missing short-term signals.
MA Source: The type of moving average used (e.g., WMA - Weighted Moving Average). Different MA types can affect the trend indicator's responsiveness and smoothness.
4. AI Trend Prediction Settings (Price Trend: 10, Prediction Trend: 80)
Price Trend and Prediction Trend Lengths: These settings define the lengths of weighted moving averages for price and SuperTrend, impacting the responsiveness and smoothness of the AI's trend predictions.
5. Pivot Percentile Settings (Length: 10)
Length: Influences the calculation of pivot percentiles. A shorter length makes the percentile more responsive to recent price changes, while a longer length offers a broader view of price trends.
6. ADX and DMI Settings (ADX Length: 14, Time Frame: 'D')
ADX Length: Defines the period for the Average Directional Index calculation. A longer period results in a smoother ADX line.
Time Frame: Sets the time frame for the ADX and DMI calculations, affecting the sensitivity to market changes.
7. Commission, Slippage, and Initial Capital
These settings relate to transaction costs and initial investment, directly impacting net profitability and strategy feasibility.

Grid Bot BacktestingBinance, Bybit, Bitget, and other cross-exchange (grid) trading bot backtesting.
Auto bound: Automatically setting upper and lower price bounds.
Manual: Setting upper and lower price bounds manually.
The graph below represents the overall asset changes (initial investment amount + current position profit + grid profit).
Try using backtesting when setting up a grid bot on the exchange!
바이낸스, 바이비트, 비트겟 등 교차거래(그리드) 봇 백테스팅
Auto bound : 자동으로 상,하단 가격 설정
Manual : 직접 상,하단 가격 설정
아래 그래프는 총 자산 변화입니다.(초기투자금액 + 현재 포지션 수익 + 그리드 수익)
거래소에서 그리드 봇 설정할 때 백테스팅 유용하게 써보세요!

Pivot Percentile Trend - Strategy [presentTrading]
█ Introduction and How it is Different
The "Pivot Percentile Trend - Strategy" from PresentTrading represents a paradigm shift in technical trading strategies. What sets this strategy apart is its innovative use of pivot percentiles, a method that goes beyond traditional indicator-based analyses. Unlike standard strategies that might depend on single-dimensional signals, this approach takes a multi-layered view of market movements, blending percentile calculations with SuperTrend indicators for a more nuanced and dynamic market analysis.
This strategy stands out for its ability to process multiple data points across various timeframes and pivot lengths, thereby capturing a broader and more detailed picture of market trends. It's not just about following the price; it's about understanding its position in the context of recent historical highs and lows, offering a more profound insight into potential market movements.
BTC 6h L/S
Where traditional methods might react to market changes, the Pivot Percentile Trend strategy anticipates them, using a calculated approach to identify trend strengths and weaknesses. This foresight gives traders a significant advantage, allowing for more strategic decision-making and potentially increasing the chances of successful trades.
In essence, this strategy introduces a more comprehensive and proactive approach to trading, harnessing the power of advanced percentile calculations combined with the robustness of SuperTrend indicators. It's a strategy designed for traders who seek a deeper understanding of market dynamics and a more calculated approach to their trading decisions.
Local picture
█ Strategy, How It Works: Detailed Explanation
🔶 Percentile Calculations
- The strategy employs percentile calculations to assess the relative position of current market prices against historical data.
- For a set of lengths (e.g., `length * 1`, `length * 2`, up to `length * 7`), it calculates the 75th percentile for high values (`percentilesHigh`) and the 25th percentile for low values (`percentilesLow`).
- These percentiles provide a sense of where the current price stands compared to recent price ranges.
Length - 10
Length - 15
🔶 SuperTrend Indicator
- The SuperTrend indicator is a key component, providing trend direction signals.
- It uses the `currentTrendValue`, derived from the difference between bull and bear strengths calculated from the percentile data.
* used the Supertrend toolkit by @EliCobra
🔶 Trend Strength Counts
- The strategy calculates counts of bullish and bearish indicators based on comparisons between the current high and low against high and low percentiles.
- `countBull` and `countBear` track the number of times the current high is above the high percentiles and the current low is below the low percentiles, respectively.
- Weak bullish (`weakBullCount`) and bearish (`weakBearCount`) counts are also determined by how often the current lows and highs fall within the percentile range.
*The idea of this strength counts mainly comes from 'Trend Strength Over Time' @federalTacos5392b
🔶 Trend Value Calculation
- The `currentTrendValue` is a crucial metric, computed as `bullStrength - bearStrength`.
- It indicates the market's trend direction, where a positive value suggests a bullish trend and a negative value indicates a bearish trend.
🔶 Trade Entry and Exit Logic
- The entry points for trades are determined by the combination of the trend value and the direction indicated by the SuperTrend indicator.
- For a long entry (`shouldEnterLong`), the `currentTrendValue` must be positive and the SuperTrend indicator should show a downtrend.
- Conversely, for a short entry (`shouldEnterShort`), the `currentTrendValue` should be negative with the SuperTrend indicating an uptrend.
- The strategy closes positions when these conditions reverse.
█ Trade Direction
The strategy is versatile, allowing traders to choose their preferred trading direction: long, short, or both. This flexibility enables traders to tailor their strategies to their market outlook and risk appetite.
█ Default Settings and Customization
1. Trade Direction: Selectable as Long, Short, or Both, affecting the type of trades executed.
2. Indicator Source: Pivot Percentile Calculations, key for identifying market trends and reversals.
3. Lengths for Percentile Calculation: Various configurable lengths, influencing the scope of trend analysis.
4. SuperTrend Settings: ATR Length 20, Multiplier 18, affecting indicator sensitivity and trend detection.
5. Style Options: Custom colors for bullish (green) and bearish (red) trends, aiding visual interpretation.
6. Additional Settings: Includes contrarian signals and UI enhancements, offering strategic and visual flexibility.

Long-Only Opening Range Breakout (ORB) with Pivot PointsIntraday Trading Strategy: Long-Only Opening Range Breakout (ORB) with Pivot Points
Background:
Opening Range Breakout (ORB) is a popular long-only trading strategy that capitalizes on the early morning volatility in financial markets. It's based on the idea that the initial price movements during the first few minutes or hours of the trading day can set the tone for the rest of the session. The strategy involves identifying a price range within which the asset trades during the opening period and then taking long positions when the price breaks out to the upside of this range.
Pivot Points are a widely used technical indicator in trading. They represent potential support and resistance levels based on the previous day's price action. Pivot points are calculated using the previous day's high, low, and close prices and can help traders identify key price levels for making trading decisions.
How to Use the Script:
Initialization: This script is written in Pine Script, a domain-specific language for trading strategies on the TradingView platform. To use this script, you need to have access to TradingView.
Apply the Script: You can do this by adding it to your favorites, then selecting the script in the indicators list under favorites or by searching for it by name under community scripts.
Customize Settings: The script allows you to customize various settings through the TradingView interface. These settings include:
Opening Session: You can set the time frame for the opening session.
Max Trades per Day: Specify the maximum number of long trades allowed per trading day.
Initial Stop Loss Type: Choose between using a percentage-based stop loss or the previous candles low for stop loss calculations.
Stop Loss Percentage: If you select the percentage-based stop loss, specify the percentage of the entry price for the stop loss.
Backtesting Start and End Time: Set the time frame for backtesting the strategy.
Strategy Signals:
The script will display pivot points in blue (R1, R2, R3, R4, R5) and half-pivot points in gray (R0.5, R1.5, R2.5, R3.5, R4.5) on your chart.
The green line represents the opening range.
The script generates long (buy) signals based on specific conditions:
---The open price is below the opening range high (h).
---The current high price is above the opening range high.
---Pivot point R1 is above the opening range high.
---It's a long-only strategy designed to capture upside breakouts.
---It also respects the maximum number of long trades per day.
The script manages long positions, calculates stop losses, and adjusts long positions according to the defined rules.
Trailing Stop Mechanism
The script incorporates a dynamic trailing stop mechanism designed to protect and maximize profits for long positions. Here's how it works:
1. Initialization:
The script allows you to choose between two types of initial stop loss:
---Percentage-based: This option sets the initial stop loss as a percentage of the entry price.
---Previous day's low: This option sets the initial stop loss at the previous day's low.
2. Setting the Initial Stop Loss (`sl_long0`):
The initial stop loss (`sl_long0`) is calculated based on the chosen method:
---If "Percentage" is selected, it calculates the stop loss as a percentage of the entry price.
---If "Previous Low" is selected, it sets the stop loss at the previous day's low.
3. Dynamic Trailing Stop (`trail_long`):
The script then monitors price movements and uses a dynamic trailing stop mechanism (`trail_long`) to adjust the stop loss level for long positions.
If the current high price rises above certain pivot point levels, the trailing stop is adjusted upwards to lock in profits.
The trailing stop levels are calculated based on pivot points (`r1`, `r2`, `r3`, etc.) and half-pivot points (`r0.5`, `r1.5`, `r2.5`, etc.).
The script checks if the high price surpasses these levels and, if so, updates the trailing stop accordingly.
This dynamic trailing stop allows traders to secure profits while giving the position room to potentially capture additional gains.
4. Final Stop Loss (`sl_long`):
The script calculates the final stop loss level (`sl_long`) based on the following logic:
---If no position is open (`pos == 0`), the stop loss is set to zero, indicating there is no active stop loss.
---If a position is open (`pos == 1`), the script calculates the maximum of the initial stop loss (`sl_long0`) and the dynamic trailing stop (`trail_long`).
---This ensures that the stop loss is always set to the more conservative of the two values to protect profits.
5. Plotting the Stop Loss:
The script plots the stop loss level on the chart using the `plot` function.
It will only display the stop loss level if there is an open position (`pos == 1`) and it's not a new trading day (`not newday`).
The stop loss level is shown in red on the chart.
By combining an initial stop loss with a dynamic trailing stop based on pivot points and half-pivot points, the script aims to provide a comprehensive risk management mechanism for long positions. This allows traders to lock in profits as the price moves in their favor while maintaining a safeguard against adverse price movements.
End of Day (EOD) Exit:
The script includes an "End of Day" (EOD) exit mechanism to automatically close any open positions at the end of the trading day. This feature is designed to manage and control positions when the trading day comes to a close. Here's how it works:
1. Initialization:
At the beginning of each trading day, the script identifies a new trading day using the `is_newbar('D')` condition.
When a new trading day begins, the `newday` variable becomes `true`, indicating the start of a new trading session.
2. Plotting the "End of Day" Signal:
The script includes a plot on the chart to visually represent the "End of Day" signal. This is done using the `plot` function.
The plot is labeled "DayEnd" and is displayed as a comment on the chart. It signifies the EOD point.
3. EOD Exit Condition:
When the script detects that a new trading day has started (`newday == true`), it triggers the EOD exit condition.
At this point, the script proceeds to close all open positions that may have been active during the trading day.
4. Closing Open Positions:
The `strategy.close_all` function is used to close all open positions when the EOD exit condition is met.
This function ensures that any remaining long positions are exited, regardless of their current profit or loss.
The function also includes an `alert_message`, which can be customized to send an alert or notification when positions are closed at EOD.
Purpose of EOD Exit
The "End of Day" exit mechanism serves several essential purposes in the trading strategy:
Risk Management: It helps manage risk by ensuring that positions are not left open overnight when markets can experience increased volatility.
Capital Preservation: Closing positions at EOD can help preserve trading capital by avoiding potential adverse overnight price movements.
Rule-Based Exit: The EOD exit is rule-based and automatic, ensuring that it is consistently applied without emotions or manual intervention.
Scalability: It allows the strategy to be applied to various markets and timeframes where EOD exits may be appropriate.
By incorporating an EOD exit mechanism, the script provides a comprehensive approach to managing positions, taking profits, and minimizing risk as each trading day concludes. This can be especially important in volatile markets like cryptocurrencies, where overnight price swings can be significant.
Backtesting: The script includes a backtesting feature that allows you to test the strategy's performance over historical data. Set the start and end times for backtesting to see how the long-only strategy would have performed in the past.
Trade Execution: If you choose to use this script for live trading, make sure you understand the risks involved. It's essential to set up proper risk management, including position sizing and stop loss orders.
Monitoring: Monitor the long-only strategy's performance over time and be prepared to make adjustments as market conditions change.
Disclaimer: Trading carries a risk of capital loss. This script is provided for educational purposes and as a starting point for your own long-only strategy development. Always do your own research and consider seeking advice from a qualified financial professional before making trading decisions.

Pivot Point SuperTrend Strategy +TrendFilterIn the dynamic world of financial markets, traders are always on the lookout for innovative strategies to identify trends and make timely trades. The "Pivot Point SuperTrend strategy +TrendFilter" has emerged as an intriguing approach, combining two popular indicators - Pivot Points and SuperTrend, while introducing an additional trend filter for added precision. This strategy draws inspiration from Lonesome TheBlue's "Pivot Point SuperTrend" script, aiming to provide traders with a reliable tool for trend following while minimizing false signals.
The Core Concept:
The strategy's foundation lies in the fusion of Pivot Points and SuperTrend indicators, and the addition of a robust trend filter. It begins by calculating Pivot Highs and Lows over a specified period, serving as crucial reference points for trend analysis. Through a weighted average calculation, these Pivot Points create a center line, refining the overall indicator.
Next, based on the center line and the Average True Range (ATR) with a user-defined Factor, upper and lower bands are generated. These bands adapt to market volatility, adding flexibility to the strategy. The heart of the "Pivot Point SuperTrend" strategy lies in accurately identifying the prevailing trend, with the indicator smoothly transitioning between bullish and bearish signals as the price interacts with the SuperTrend bands.
The additional trend filter introduced into the strategy further enhances its capabilities. This filter is based on a moving average, providing a dynamic assessment of the trend's strength and direction. By combining this trend filter with the original Pivot Point SuperTrend signals, the strategy aims to make more informed and reliable trading decisions.
Advantages of "Pivot Point SuperTrend" with Trend Filter:
1. Enhanced Precision: The incorporation of a trend filter improves the strategy's accuracy by confirming the overall trend direction before generating signals.
2. Trend Continuation: The integration of Pivot Points and SuperTrend, along with the trend filter, aims to prolong trades during strong market trends, potentially maximizing profit opportunities.
3. Reduced Whipsaws: The strategy's weighted average calculation, coupled with the trend filter, helps minimize false signals and reduces whipsaws during uncertain or sideways market conditions.
4. Support and Resistance Insights: The strategy continues to provide additional support and resistance levels based on the Pivot Points, offering valuable contextual information to traders.

Liquidity Breakout - Strategy [presentTrading]- Introduction and How It Is Different
The Liquidity Breakout Strategy is a unique trading strategy that focuses on identifying and leveraging patterns in market price data. This strategy, mainly inspired by the script "Master Pattern" by LuxAlgo, takes a different approach from many traditional strategies that rely on technical indicators or fundamental analysis. Instead, the Liquidity Breakout is based on the concept of contraction detection and liquidity levels. This approach allows traders to identify potential trading opportunities that other strategies might miss.
BTCUSDT 6h
The strategy is different from other trading strategies because it uses a unique combination of pattern detection, liquidity levels, and user-defined trading direction. This combination allows the strategy to adapt to various market conditions and trading styles, making it a versatile tool for traders.
- Strategy: How It Works
1. Contraction Detection: The strategy uses a lookback period defined by the user (default is 10 bars) to identify contractions in the market. A contraction is a period where the market is consolidating, often followed by a significant price movement. The strategy identifies contractions by finding pivot highs and pivot lows within the lookback period. If a pivot high is lower than the previous pivot high and a pivot low is higher than the previous pivot low, a contraction is detected.
2. liquidity Levels:
What are Liquidity levels? Liquidity levels, also known as liquidity pools or zones, are price levels at which there is a significant amount of trading activity. They are often areas where large institutional traders (like banks or hedge funds) have placed orders. These levels are important because they can act as support or resistance levels, and price often reacts at these levels.
In the context of this strategy, liquidity levels are used to identify potential entry and exit points for trades. When the price reaches a liquidity level, it could indicate a potential trading opportunity. For example, if the price breaks through a liquidity level, it could signal the start of a new trend. On the other hand, if the price approaches a liquidity level and then reverses, it could signal a potential reversal.
The strategy uses these two elements to identify potential trading opportunities. When a contraction is detected, the strategy will look for a breakout in the direction of the trend. If the breakout occurs at a liquidity level, the strategy will execute a trade.
The strategy also allows traders to set their stop loss based on either the Average True Range (ATR) or a fixed percentage. This flexibility allows traders to manage their risk according to their personal risk tolerance and trading style.
- Trade Direction
One of the unique features of the Master Pattern Strategy is the ability to choose the trading direction. Traders can choose to trade in the "Long" direction, the "Short" direction, or "Both". This feature allows traders to adapt the strategy to their personal trading style and market outlook.
For example, if a trader believes that the market is in an uptrend, they can choose to trade only in the "Long" direction. Conversely, if the market is in a downtrend, they can choose to trade only in the "Short" direction. If the trader believes that the market is volatile and there are opportunities in both directions, they can choose to trade in "Both" directions.
- Usage
To use the strategy, traders need to input their preferred settings, including the contraction detection lookback period, liquidity levels, stop loss type, and trading direction. Once these settings are input, the strategy will automatically detect potential trading opportunities and execute trades according to the defined parameters.
- Default Settings
The default settings for the Master Pattern Strategy are as follows:
Contraction Detection Lookback: 10
Liquidity Levels: 20
Stop Loss Type: ATR
ATR Length: 20
ATR Multiplier: 3.0
Fixed Percentage: 0.01
Trading Direction: Both
These settings can be adjusted according to the trader's personal preferences and market conditions. It's recommended that traders experiment with different settings to find the ones that work best for their trading style and goals.

Yesterday’s High Breakout - Trend Following StrategyYesterday’s High Breakout it is a trading system based on the analysis of yesterday's highs, it works in trend-following mode therefore it opens a long position at the breakout of yesterday's highs even if they occur several times in one day.
There are several methods for exiting a trade, each with its own unique strategy. The first method involves setting Take-Profit and Stop-Loss percentages, while the second utilizes a trailing-stop with a specified offset value. The third method calls for a conditional exit when the candle closes below a reference EMA.
Additionally, operational filters can be applied based on the volatility of the currency pair, such as calculating the percentage change from the opening or incorporating a gap to the previous day's high levels. These filters help to anticipate or delay entry into the market, mitigating the risk of false breakouts.
In the specific case of NULS, a 9% Take-Profit and a 3% Stop-Loss were set, with an activated trailing-stop percentage. To postpone entry and avoid false breakouts, a 1% gap was added to the price of yesterday's highs.
Name : Yesterday's High Breakout - Trend Follower Strategy
Author : @tumiza999
Category : Trend Follower, Breakout of Yesterday's High.
Operating mode : Spot or Futures (only long).
Trade duration : Intraday.
Timeframe : 30M, 1H, 2H, 4H
Market : Crypto
Suggested usage : Short-term trading, when the market is in trend and it is showing high volatility.
Entry : When there is a breakout of Yesterday's High.
Exit : Profit target or Trailing stop, Stop loss or Crossunder EMA.
Configuration :
- Gap to anticipate or postpone the entry before or after the identified level
- Rate of Change for Entry Condition
- Take Profit, Stop Loss and Trailing Stop
- EMA length
Backtesting :
⁃ Exchange: BINANCE
⁃ Pair: NULSUSDT
⁃ Timeframe: 2H
⁃ Fee: 0.075%
⁃ Slippage: 1
- Initial Capital: 10000 USDT
- Position sizing: 10% of Equity
- Start : 2018-07-26 (Out Of Sample from 2022-12-23)
- Bar magnifier: on
Credits : LucF for Pine Coders (f_security function to avoid repainting using security)
Disclaimer : Risk Management is crucial, so adjust stop loss to your comfort level. A tight stop loss can help minimise potential losses. Use at your own risk.
How you or we can improve? Source code is open so share your ideas!
Leave a comment and smash the boost button!
Thanks for your attention, happy to support the TradingView community.

Risk Reward Calculator [lovealgotrading]
OVERVIEW:
This Risk Reward Calculator strategy can help you maximize your RR value with help of algorithmic trading.
INDICATOR:
I wanted to setup my trades more easier with this indicator, I didn't want to calculate everytime before orders, with help this indicator we can calculate R:R value, avarage price, stoploss price, take-profit price, order prices, all position cost and more ...
Our strategy is a risk revard calculation indicator that is made easy to use by using visualized lines and panels, and also has algorithmic trading support.
With the help of this indicator, we can quickly and easily calculate our risk reward values and enter the positions.
If we want to ensure that our balance grows regularly while trading in the stock market, we need to manage the risks and rewards otherwise we may fall below our initial balance at the end of the day, even if we seem to be winning.
What is the Risk-Reward value ?
This value is a value that shows how many times the amount of risk we take when entering the position is successful, we will earn.
- For example, you risked $100 while entering the trade, so if your trade stops, you will lose 100 $.
Your Risk-Reward(RR) value is 2 means that if your position is successful, you will have 200 $ in your pocket.
A trader's success is determined by the amount of R he earns monthly or yearly, not how much money he makes.
What is different in this indicator ?
I want to say thank you to © EvoCrypto. His Calculator (weighted) – evo indicator helped me when I was developed my indicator.
I want to explain what I have improved:
1-In this strategy, we can determine the time period in which we want to open our positions.
2-We can open a maximum of 4 positions in the same direction and close our positions at a single level. StopLoss or TakeProfit
3-This indicator, which works in the form of a strategy, shows where our positions have been opened or closed. With the help of this, it helps us to determine our strategy in our future positions more accurately.
4-The most important improvement is that we do not miss our positions with the help of alarms (WEB HOOK). if we want, we receive by quickly connecting all these positions to our robot, the software can enter and exit the position while we are busy.
IMPLEMENTATION DETAILS – SETTINGS:
1 - We can set the start and end dates of the positions we will take.
2- We can set our take profit, stoploss levels.
3- If your trade is stopped, we can determine the amount of the trade that we will lose.
4- We can adjust our entry levels to positions and our position sizes at entry levels.
(Sum of positions weight must be 100%)
5- We can receive our positions even if we are busy with the help of algorithmic trading. For this, we must paste our Jshon codes into the fields specified in the settings panel.
6- Finally, we can change the settings we want and don't want to have in our visual elements.
Let's make a LONG side example together
We have determined our positions to enter stoploss, take profit and long positions. We did not forget to set the start time of our strategy
Our strategy appear on the graph as follows.
Our strategy has calculated the total position size, our R-R value, the distance of the current price to the stop and take profit levels, in short, a lot of things we could look visually.
Notes:
If you're going to connect this bot to an automatic Long or Short direction,
Don’t forget! you need to Webhook URL,
Don’t miss paste this code to your message window {{strategy.order.alert_message}}
ALSO:
If you have any ideas what to add to my work to add more sources or make calculations cooler, feel free to write me.

Boftei's StrategyI wrote this strategy about a year ago, but decided to publish it just now. I have not been able to implement this strategy in the market. If you can, then I will be happy for you.
This strategy is based on my "Botvenko Script". (It finds the difference between the logarithms of closing prices from different days.) (Check this script in my profile)
Then the strategy makes trades when the "Botvenko Script" indicator crosses the levels set earlier and manually selected for each currency pair/shares: long/short opening/closing levels, long/short re-entry levels. (They are drawn with horizontal dotted lines.) The names of these lines are: buy/sell level, long/short retry - too low/high, long close up/down, dead - close the short. Manual selection of each of the parameters provides a qualitative entry of the strategy into the deal. However, without restraining mechanisms, the strategy enters into rather controversial deals. In order to avoid going long/short during bear/bull markets, which is unacceptable, I added a fan of EMA lines.
The fan consists of several EMA lines, which are set according to Fibonacci numbers (21, 55, 89, 144). If the lines in the fan are arranged in ascending order (ema_21>ema_55 and ema_55>ema_89 and ema_89>ema_144), then this indicates a bull market, during which I banned shorting. And vice versa: during the bear market (ema_21

Combined Strategy Trading Bot (RSI ADX 20SMA)Trading Bot V1, This code implements a combined trading strategy that uses several indicators and strategies to make buy and sell decisions in the market. The code is written in Pine Script™, which is a programming language used in the TradingView platform. By BraelonWhitfield.Eth
The strategy uses the Average Directional Movement Index (ADX) and the Pine SuperTrend indicator to identify trends and price movements in the market. The SuperTrend indicator is a popular technical analysis tool that helps to identify the direction of the current trend and provides entry and exit points for trades.
The strategy also uses the Relative Strength Index (RSI) to identify overbought and oversold conditions in the market. The RSI is a momentum indicator that measures the speed and change of price movements in the market.
The first part of the code defines the inputs for the ADX and DI Length, which are used to calculate the ADX and DI values. The dirmov() function is used to calculate the positive and negative directional indicators (plusDM and minusDM) based on the high and low prices. The truerange variable is then calculated using the True Range (TR) formula. Finally, the plus and minus variables are calculated using the smoothed moving average of the plusDM and minusDM values.
The adx() function is then used to calculate the ADX values based on the plus and minus variables. The Pine SuperTrend indicator is defined using the pine_supertrend() function. This function uses the high-low average (hl2) and the Average True Range (ATR) to calculate the upper and lower bands for the indicator. The direction of the current trend is then determined based on whether the current price is above or below the upper or lower bands.
The RSI values are then calculated using the ta.rsi() function, with the inputs for the close price and the RSI period. The overbought and oversold conditions are defined using the OB and OS inputs, which specify the threshold values for the RSI. The upTrend and downTrend variables are defined based on the direction of the Pine SuperTrend indicator.
The next part of the code defines the 20-period Simple Moving Average (SMA) using the ta.sma() function. The os and ob variables are then calculated based on the RSI values and the OB and OS inputs. The strategy.entry() function is used to define the buy and sell orders based on the upTrend and downTrend variables, as well as the Pine SuperTrend indicator, the 20-period SMA, and the os variable.
The final part of the code defines the Channel Breakout Strategy using the ta.highest() and ta.lowest() functions to calculate the upper and lower bounds of the channel. The strategy.entry() function is then used to define the buy and sell orders based on whether the current price is above or below the upper or lower bounds.
In summary, this code implements a combined trading strategy that uses several indicators and strategies to make buy and sell decisions in the market. The strategy is designed to identify trends and price movements in the market, as well as overbought and oversold conditions, to provide entry and exit points for trades. The strategy uses the Pine SuperTrend indicator, the ADX and DI indicators, the RSI, and the 20-period SMA, as well as the Channel Breakout Strategy to make informed trading decisions.

12/26-IT strategyBase of this Strategy is crossover of 12EMA on 26EMA.
Also multiple other criteria has to meet for buy signal, Criterias mentioned below
//////////////////////////////////
There two entry option to select. Either one or both can be selected:
1. Only 12/26 Cross over
a. 12/26 crossover.
b. RSI (14) value to be between a range (RSI is inbuilt, but lower and upper range can be defined in settings)
c. MACD (12, 26) to be positive and above signal line (this is inbuilt)
2. Recent 12/26 Cross over and closing above pivot point(resistance)
a. 12/26 crossover has to be recent, CrossOverLookbackCandles value will look for crossover in # previous candles..
b. RSI (14) value to be between a range (RSI is inbuilt, but lower and upper range can be defined in settings)
c. MACD (12, 26) to be positive and above signal line (this is inbuilt)
d. closing above resistance line
//////////////////////////////////
For Exit we have three options. you can select any SL as per your need, multiple SLs can also be selected
1. Trailing Stop Loss.
Source for TSL is adjustable(open, close, high or low), also you have to mention % below your source TSL has to be placed.
Once closing is below TSL, exit will be triggered.
2. Closing below 7SMA
After 7SMA SL is enabled, 7SMA will be plotted on chart and exit signal will be triggered when closing is below 7SMA.
Choose this option for LESS risk and rewards
3. 12/26 Crossdown
Once 12EMA crossdown below 26EMA, exit will be triggered.
Choose this option for HIGH risk and rewards
//////////////////////////////////
Resistance line is plotted based on left and right candles, if 10(can be changed) is used for both left and right, indicator will look for 10 candles in left and 10 candles in right and if both left and right candle are lower then a line is plotted.
Source has to be selected (close or high)
//////////////////////////////////
Qty mentioned in Buy trigger will be based on BUYVALUE entered
//////////////////////////////////
Multiple Target option is available, if first target is matched how much percentage of qty to be sold can be defined.
If you wish to have only one Target, then exit qty in first target must be 100