MMMTRENDThis is a simple indicator that finds trends in all financial exchange markets. The code is simple, It looks at the previous 50 bars( which can be changed to the number of bars you like) compared to the current bar. If the current bar is higher, it shows green background and if its lower it shows red background.
Puntos pivote

MMMBREAKOUTThis is a simple script that alerts breakouts to either the upside or the downside. It is used for all financial exchange markets. The code simply finds the highest point or lowest in the last 30 bars(this can be changed to any number of pasted bars) and changes the background color to green if the high is broken to the upside or to red if the low is broken to the downside.

FXReaper X (Master) P1
OANDA:GBPAUD
This indicator includes all of the best indicators utilized for optimal trading.
The indicator includes the following:
- Fibonacci
- MA Ribbon
- SuperTrend
- Buy & Sell Signals
How to Use
How to use this indicator depends on you as the trader, how to best utilize this objectively is to apply it as confluence to your analysis.
- Buy/Sell signal (In your bias direction)
- Fibonacci golden zone (entry)
- SuperTrend (fits your trend bias)
- Ribbon (additional trend bias)
Ideally, you would use this to catch the best entries near support/resistance levels.
I.e. Buying off bounce of support level using signal and super trend.
Disclaimer
This by no means is a guaranteed signal. These should be used as confluence to your own technical/fundamental analysis.
Do not rely on this solely unless you know what you are doing.
These indicators were pulled and modified from existing indicators and adjusted to our personal preferences.
There are custom inputs for those to adjust to their own liking.
How to Get Access
To get access please send me a private message via TradingView.

Ultimate Pivot PointsLately, there are a plethora of Pivot scripts on TV, I'll be adding one more :3
This is a combination that I use for my personal use so I've coded accordingly. Its the best combination of the regular pivot, woodie pivot, fib, and cams, in my humble opinion. Also added previous day high and low as those are the key levels for intraday traders.
Also, this is a multi-timeframe version.
Enjoy~

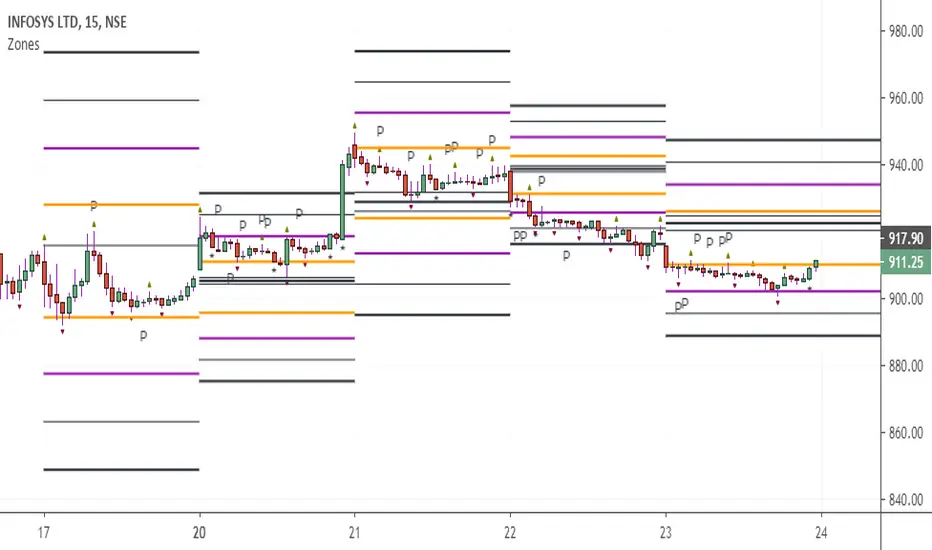
Trade4Wealth Software-ITrade4wealth Software-I
DESCRIPTION:
This Alert indicator utilizes the Heiken Ashi with non-lag MA was a scalping and intraday trading. The Heiken Ashi candles are great as price action trending indicator, they shows smooth strong and clear price fluctuations with price. The maximum & minimum movement of price capture by Pivot Lines.
Financial Markets: NSE/BSE/MCX
> Optimised settings for 3 min, 5 min and 15 min Time Frame.
Indicators used in calculations:
> Moving Average
> Pivot Points
How to use:
> Use software with Default Settings.
For Buy :
> When Price takes Support at Green Pivot Line with Trade4wealth Green Signal Go Long.
For Sell :
> When Price takes Resistance at Red Pivot Line with Trade4wealth Red Signal Go Short.
HINTS:
- Always Trade in Trend Direction (Refer Monthly, Weekly, Daily, Hourly Charts for Trend Directions).
How to get access:
Please click on the link in the signature or send me a private message to get access.

Pivot Reversal AlertsPivot Reversal Study script, for generating Alerts and visual plotting of Pivot Reversal lines on the charts. Use a Strategy script (like Figs & Dates), for backtesting different settings on various time frames and charts.

Ely Waves PivotsThese pivot points are used to create an expected range based on open and closing candle data. It's a mixture of two different types of pivots and together they form an expected range for various time frames. You can set them up from as little as 4 hours to 1 month. My personal favorites are 4 hour, 1 day, 1 week, and 1 month.
The dashed lines create the pivot area for the time frame chosen, and the thick lines create the expected high and low for the chosen time frame.
These are very powerful if used correctly!
Hope you enjoy!

CAMZONEAdded Fractals which establishes high and low based on Bill Williams definition. Added one type of Pinbar (where the open and close is near extreme of the range and with long shadow that is at least 80% of the range). It is a powerful reversal pattern especially on the daily charts. These bars are identified with the character P. Also included dots below momentum candles.


Magic CPRThis is not a simple CPR, this includes much more than a simple CPR. Typically a price action based trader use some other support and resistance combined with CPR and I am trying to combine all of them in one single indicator.
In the case of CPR this indicator supports only daily CPR but shows Weakly and Monthly pivot if you want on chart. Other than CPR, this indicator support,
1. Daily time frame Swing Low and High : Implemented, You have to set the number of days you have to consider calculating Swing high and Swing Low. yes this is not 100% automated but really useful.
2. Yesterday High
3. Yesterday Low
4. Today Open : Today Open and Yesterday Low / High will help you to see the gap.
5. Virgin CPR : Yes, I did not see any other indicator which shows Virgin CPR on your chart. This will draw virgin CPR if any virgin CPR exists in the last 6 days. I think people consider only last few days virgin CPR only .
Why This indicator
1. It is difficult for the trader to draw all the above drawings every day
2. Even if you want to use indicators to draw these, it is extremely difficult to configure and manage it in multiple indicators.
3. If you are using a free account you are limited with the number of indicators on the chart as well.
4. Most important, there is no other indicator draw virgin CPR for you
5. Typically people do not want the CPR and pivot data for older days, I provide an option to hide all older pivot data from chart
5. Even though Pivot can be calculated for the entire day, most of the pivots show pivot data till current time. In this indicator, the pivot data will be plotted to you for the entire day at 9:15 AM.
What I am expecting from you
1. Please let me know the feedback
2. Let me know if you are looking for any improvements
3. let me know if you find any bugs

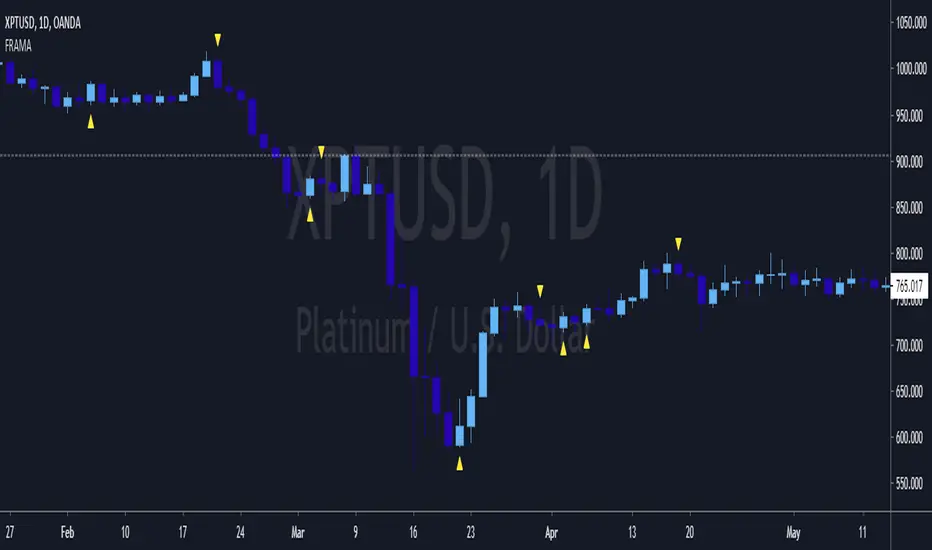
Fractal Adaptive Entry IndicatorThis entry indicator was inspired by John Ehle'rs "Fractal Adaptive Moving Average"
It's a very sensitive entry indicator that must be paired with a long-term trend detector in order to filter false positives.
Warning I have not backtested this indicator and will not make any claims to its performance.
Visually, it looks promising, however, backtesting and statistical analysis takes time.
Happy trading
<3
True Strong Classical Support/Resistance LevelsThis script is based on the approach of filtering signals by checking higher timeframes.
So basically setting higher numbers in "Strength Of Levels" option, will make the indicator check for support and/or resistance levels in timeframes higher than the current.
Unfortunately, I was forced to still use inefficient built-in functions pivothigh() and pivotlow(). I hope they fix them up soon!
I'm looking for any opinion about the idea and if you like any of my scripts, anything you send means a lot to me.
This script is published for the third time because of some moderators absurd behavior.
But thank heavens, the code is now more clean and of course the option "Strength Of Levels" accepts float numbers.


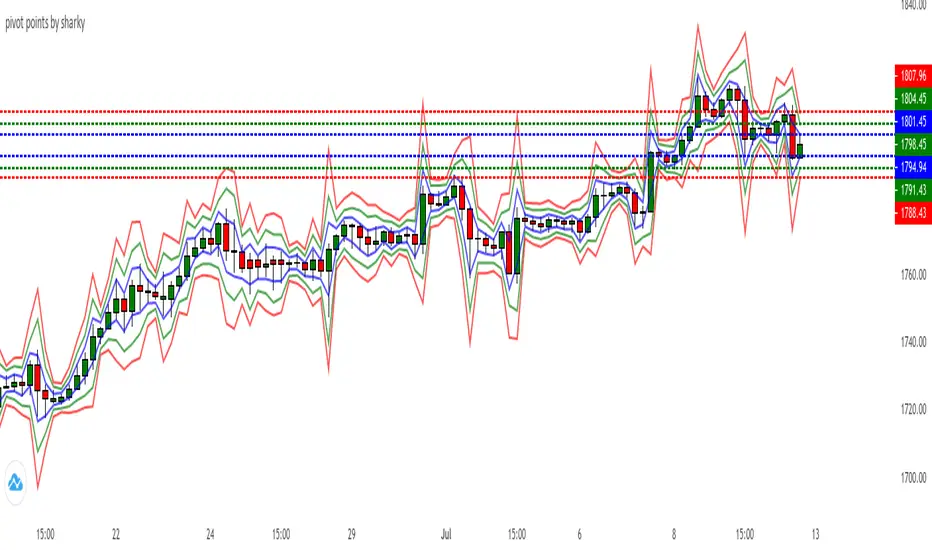
Rolling Fibonacci Pivot Points [QuantNomad]Standard Fibonacci Pivot Points are calculated from the previous day (or another period) close/low/high. But what is the day close for cryptocurrencies trading 24/7 on exchange? Does it make sense to use a specific time price as a close if it continue trading after that?
So I decided to solve that issue with Rolling Fibonacci Pivot Points where I calculate pivot points not at the end of the period but for every bar. Every time recalculating pivot points I look at a window of period length in bars and base my calculations on these bars. This way you get smooth pivot points changing with every bar and it seems like levels might be really nice support and resistance for the price.
I implemented 6 periods: Auto, Day, Week, Month, Quarter, Year. For the Auto period, I select the most suitable period for the timeframe of your chart.
On the chart, you can see by default 7 levels plotted:
PP – Pivot Point
S1 – Support on 0.382 fib level
S2 – Support on 0.618 fib level
S3 – Support on 1.000 fib level
R1 – Resistance on 0.382 fib level
R2 – Resistance on 0.618 fib level
R3 – Resistance on 1.000 fib level
Also in parameters you can display additional midpoints:
S0.5 – Support on 0.236 fib level
S1.5 – Support on 0.500 fib level
S2.5 – Support on 0.786 fib level
R0.5 – Resistance on 0.236 fib level
R1.5 – Resistance on 0.500 fib level
R2.5 – Resistance on 0.786 fib level
####################
It's a pro indicator, you can have access to it for a small fee. Link to my PRO indicators you can find in my signature.
####################
Disclaimer
Please remember that past performance may not be indicative of future results.
Due to various factors, including changing market conditions, the strategy may no longer perform as good as in historical backtesting.
This post and the script don’t provide any financial advice.

IndianPivotBoss_ADRAverage Daily Range indicator
This indicator shows the average daily range. By default shows one day Daily Range. It can be customised upto 100 days. Strongly suggested to use 1-5 days only.
It also plots 4 lines which are by default 10 day average Daily Range (ADR) with 50% of ADR, 75% of ADR, 100% of ADR and 125% of ADR.
These are used to calculate potential daily targets.
However, the most important usage is on daily chart for the next day analysis for trading intraday. If DR is less than 50% of the ADR (BOTTOM MOST LINE), the color of the bar will be in red which indicates that there is heavy contraction which could possibly followed by expansion. This could possibly lead to a trending day and hence traders can prepare well in advance.

Borsa Akademi Daytrade Hardcore by HassonyaThe Daytrade Hardcore Indicator is a strategy indicator for scalping in a 5-minute time period. Indicator was produced by me by following my way through the daytrade scanning options of my respected teacher ÖZKANFİLİZ(Best Scalper in Turkey). This scan consists of 14 conditions.
We use this scan in a 5-minute time frame. Daytrade Hardcore indicator can show us how many of these conditions in bars are listed and sequentially. You can open which one you want to use.
The Daytrade Hardcore indicator has a 3-day central pivot range. If you want, you can use it to strengthen your buying and selling decision. If the bars can hold on the 3x pivot line, you're safe.
Unless the 3-day central pivot line is shattered, you can move your stocks if you wish.
The strategy also includes DHardcore Trend, Stoploss, First Support, Indicator List, Support/Resistence and S/R Zones, 3dhx central pivot, pivot points, bollinger middle bands,
You should be careful if the 3dhx central pivot breaks down. If you want, you can stop here, you can follow it for new purchase. If you want, you can watch the support point for the new purchase or follow the list and wait for the 3-day pivot to go back when the list supports the 12-13-14 condition.
Sometimes the first support point and stoploss point may change, you can follow it yourself. In this case, you will use the bottom red first support point as a stoploss.
Thanks for your support
Türkçe Açıklama
-------------------
Daytrade Hardcore indikatörü 5 dakikalık periyotta scalping içindir. İndikatör saygıdeğer hocam Türkiye'deki en iyi scalper ÖZKANFİLİZ'in daytrade taraması baz alınarak tarafımdan yaratılmıştır. Bu taramada bildiğiniz üzere 14 tane şart bulunmaktadır. Tarama 17:30 dan kapanışa kadar 5 dakikalık zaman diliminde hisse takipçisinde izlenmektedir.
Taramayı 5 dakikalık zaman diliminde kullanıyoruz. Daytrade Hardcore indikaötür bize barlarda kaç tane şart olduğunu anlık tarayarak ister liste halinde istersek sequential şeklinde gösterebilir. İsterseniz tek tek isterseniz iki seçeneği de kullanabilirsiniz.
Daytrade Hardcore indikatöründe 3 günlük merkezi pivot aralığı bulunmaktadır. Eğer isterseniz, bunu alım satım olarak kullanabilirsiniz. Eğer barlar 3 günlük merkezi pivot çizgisi üzerinde tutunabiliyorsa bu size güvenli olduğunu gösterebilir. Alım için hacim, liste ve RMI'yi kollayabilirsiniz.
3 günlük merkezi pivot noktası kırılmadığı sürece isterseniz hissenizi taşıyabilirsiniz ve mavi çizgi aşağı kırıldığı zaman çıkış yapabilirsiniz.
Bu strateji indikatöründe DHardcore Trend, Stop Noktası, İlk Destek, İndikatör İsim Listesi, Destek/Direnç(Bölgeleri), 3dhx merkezi pivot, pivot noktaları, bollinder orta band içerir.
3 günlük merkezi pivot kırılımına dikkat etmelisiniz. Eğer isterseniz, bunu izleyerek stop olabilirsiniz ve takip ederek yeni alım noktası için izlersiniz. Bunun için isterseniz destek noktası izlersiniz isterseniz mavi çizgi üstünde tutunmasını beklersiniz.Bazı belirtiler nedir? Hacmin ortalama üzerine atması, Liste 12-13-14 olması, fiyatın bollinger orta band üstüne çıkması, fiyatın pivot üzerinde olması.
Bazı zamanlarda ilk destek noktasıyla stoploss noktası değişir. Bunu izleyip kararı kendiniz verebilirsiniz. Kırmızı noktalar mavi çizginin altına indiği zaman orası stoploss noktamız olacaktır.
Destek veren bütün dostlara teşekkür ederim.
Hayrını görün.

SOT INDICATOR for VSARussian language
SOT бар для VSA (Volume spread analysis)
Индикатор обозначает бары указывающие на остановку цены и возможный разворот.
Индикатор в первую очередь написан для таймфреймов от одного часа. На таймфреймах менее 1 часа сигнал будет приводить к неверным результатам, поскольку вечерние объемы существенно ниже дневных.
условие 1: закрытие текущего бара близко к закрытию предыдущего (достигается путём сравнения среднего диапазона последних 5 баров)
sma(high-close,5) - это средний диапазон за 5 баров
итого получается разница между закрытиями меньше 1/2 среднего диапазона за последние 5 баров.
Условие 2: должен быть хвост продаж или покупок (критерий - составляет не менее 2/3 от всего диапазона бара)
Условие 3: объемы должны быть увеличивающиеся (я взял, что текущей объем должен быть больше среднего за последние 5 баров)
Индикатор следует использовать совместно с теорией VSA.
English language (Google Translate)
SOT bar for VSA
The indicator indicates bars indicating a stop of the price and a possible reversal.
The indicator is primarily written for time frames from one hour. On time frames of less than 1 hour, the signal will lead to incorrect results, since evening volumes are significantly lower than daily volumes.
Condition 1: closing the current bar is close to closing the previous one (achieved by comparing the average range of the last 5 bars)
sma (high-close, 5) is the average range for 5 bars
total, the difference between closures is less than 1/2 of the average range for the last 5 bars.
Condition 2: there must be a tail of sales or purchases (the criterion is at least 2/3 of the entire range of the bar)
Condition 3: volumes must be increasing (I took that the current volume should be more than the average for the last 5 bars)
The indicator should be used in conjunction with VSA theory.

|AG| Master Detector|AG| Master Detector
This Script search the nearest pivot in the base of the price movement "Close"
Only the nearest Support and Resistance will be plotted.
An informative label is included in the indicator with the option of a turn on/off.
Pivot Level, Time, Pivot Calculation, and Price Is included in the label.
There are 3 Options for the pivot calculation (Detection):
=>Camarilla
Only detect the pivots > than R3 and lower than < S3
Is going to detect even until S6 and R6
=>Traditional
In this case, Detect all pivots levels
And maintain as a constant the Main Pivot without
=>Fibonacci
Same as camarilla
Only detect the pivots > than R3 and lower than < S3
Exception detecting until R5 and S5
////The LockBack Option////
This Script also includes an option to only plot a certain amount of days back.
Mainly for have a more clear chart.
/////Color Options/////
Includes different colors that can be selected changing the pivot levels, labels, and candles.
////Candles Color///// (Optional)
The color change of candles can be activated or deactivated in the base of the trader preferences
Is going to plot color when the price is higher than Main Pivot in "720" Time Frame
The color is linked with the //Color Option// Changing all at the same time to preserve a minimalistic design.
Color Options Examples:
Please PM me on Trading View For Access

D, W, M_CPR + Camarilla + Value Area _ By SoumyaAll in one pivot points of combined D, W, M CPR, Camarilla & Value area. Inspired by Pivotboss book.

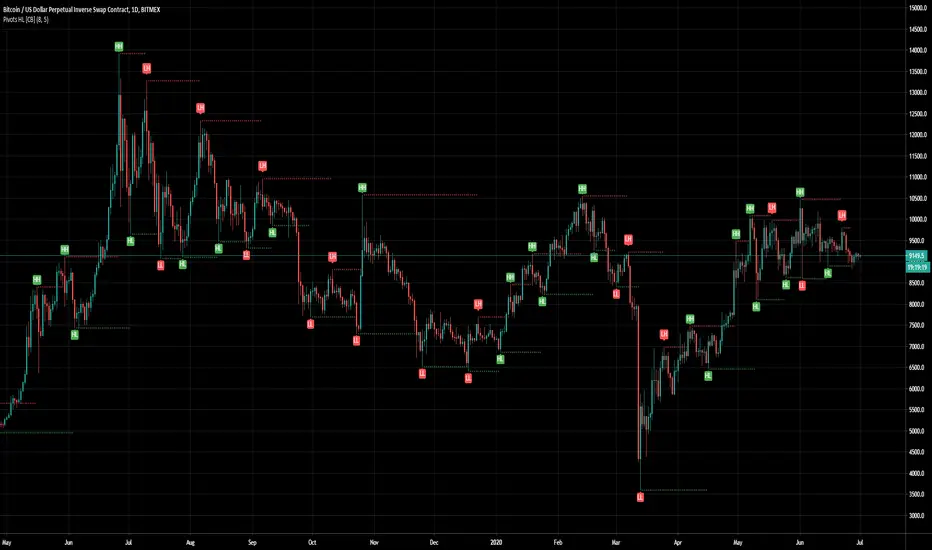
Pivot Points [CB]Automatically label pivots as HH/LH and HL/LL.
The criteria for determining pivot points can be configured.
SW System - EMAs - Pivots v2//=========================================================
// Indicator Name: SW System - Traditional Pivots and MA cross alerts - Plus Psychological Sup/Res
// Type: Main panel
// Version: 2
// Description: MA cross alerts - Plus Psychological Sup/Res
// Traditional Pivots in any time frame
// Author: Sergio Waldoke (Argentina)
// First Release: June 23rd, 2019
// Last Release: June 27 th, 2020
//
// This source code is subject to the terms of the Mozilla Public License 2.0 at mozilla.org
// © galileogalilei1 (Sergio Waldoke)
//==========================================================
Set of tendence and Support/Resistance with Pivots and psychological S/R in main prices. Four moving averages are provide which may be chosen between EMA or simple Moving Average.
Some alerts in crosses are provide.
Enjoy!
