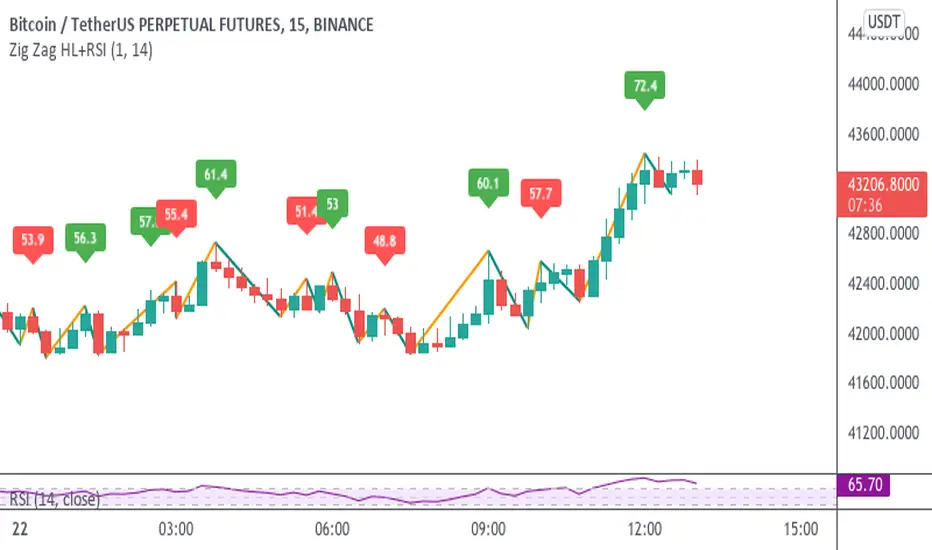
Zig Zag High-Low + RSIThis indicator adds to the functionality of Tr0sT's Zig Zag High Low Indicator by adding the RSI value above the higher-high to eyeball whether the current trend (signified by consecutive higher-highs and higher lows or consecutive lower highs and lower lows) is strengthening or weakening.
THEORY / METHODOLOGY:
If the uptrend is strong, the later pivot high will have a greater RSI number than the previous pivot high indicating an opportunity to go long. In a downtrend the lower high should have a lower RSI than the previous lower high indicating an opportunity to go short. If it does not, it is an indication that the trend is weakening.
ACTION:
If the ZigZag has higher highs and Higher lows and a strengthening RSI, look for Long opportunities on the lower time frame. If the ZigZag has lower highs and lower lows and a weakening RSI, look for Short opportunities on the lower time frame.
USAGE:
This methodology works best and produces the most opportunities when the markets are active, i.e. between 6AM-11AM EST
Thanks to Tr0sT for the original ZigZag High-Low indicator.
Tr0sT: www.tradingview.com
Zig Zag High Low Indicator:
Puntos pivote
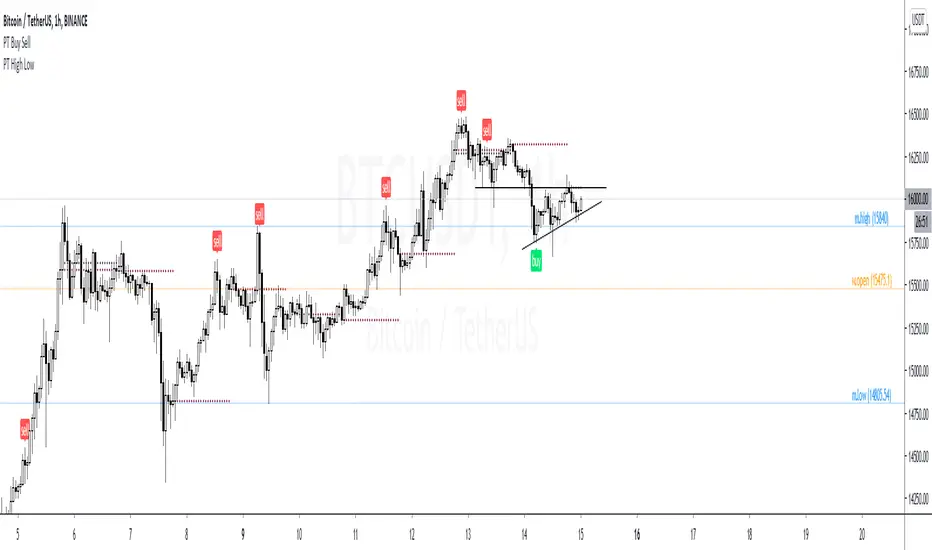
PT High Low Version 1.0 of our PT High Low indicator helps create a visual for the Daily, Weekly, Monthly & Yearly range. These levels will give you an idea of where the price can react if reached. Consider them pivotal areas. We included a toggle that will help you go between the candle's High/Low to the candle's Open/Close. Both features are unique when scalping & swinging. The High/Low will paint a beautiful visual for your day to day trading & the Open/Close will help you determine where price maxed opened & closed for that specified timeframe.
Strategy:
Price tends to gravitate between the Daily level when playing intraday scalps. If playing the weekly, you want to be above the weekly pivot to punt longs & under the weekly level to punt shorts. More likely than not, when the price hits a monthly or yearly level, we get a noticeable reaction off it.
This Oscillator was built around our buy sell indicator & it is used on all time frames for swinging & scalping. It is included as part of the library. Just message us for access!
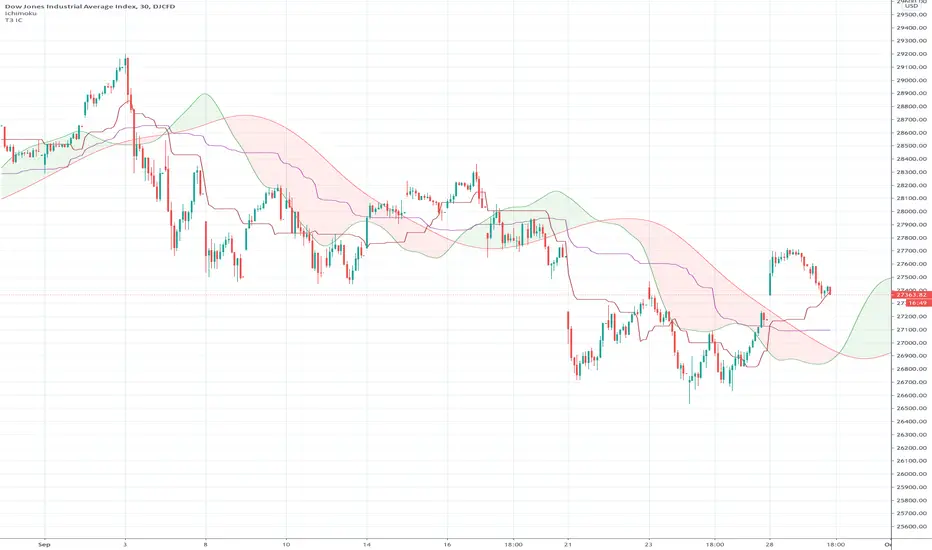
Ichimoku Cloud "Pivot"The purpose of the base and conversion lines is to give an indication of the current trend but the numerous crossings and false signals make it noisy and unreliable. This new indicator dubbed the the Ichimoku Cloud Pivot is based on an average of the IC leading spans without the time offset which are further filtered through a Donchian Channel. The result is the purple line which has fewer crossings and reliably serves as a resistance/support as shown in the diagram. It can be used in instances where the cloud fails to give a clear signal of the current trend. The brown line is the standard conversion line and is shown for reference.
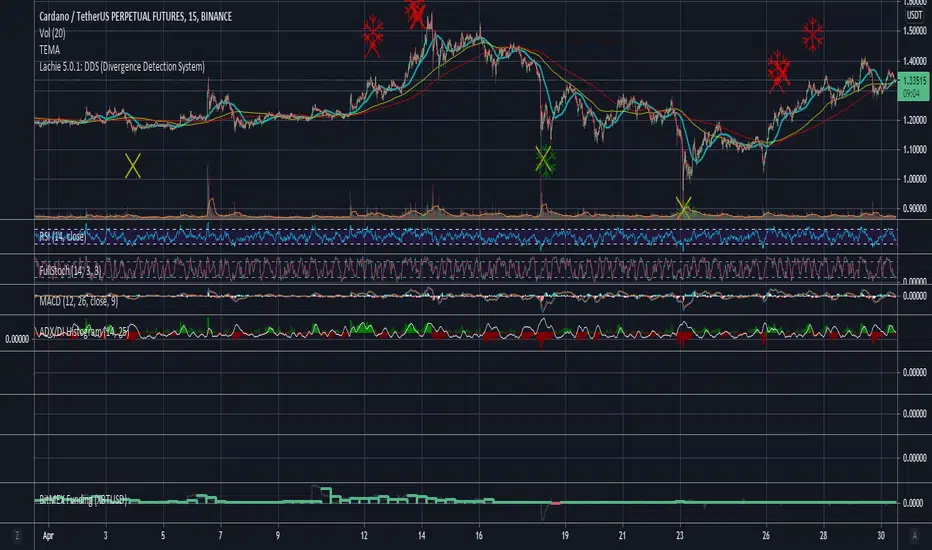
Lachie 5.0.1.2: DDS (Divergence Detection System)Introduction:
The purpose of this indicator is to assist users in detecting bullish and bearish divergence. This is purely for educational purposes and should only be used as an indicator to invest further time in TA.
This indicator is a further release of my previous indicator Lachie 3.0: DDS (Divergence Detection System).
How to interpret:
When a unique event occurs in the market the logic of the code will trigger:
-Bullish Divergence: Yellow X = divergence detected/forming, Orange X = strong confirmation, Green snow flake = targets end of divergence (fails sometimes)
-Bearish Divergence: Red X = Divergence detected/forming, Red snow flake = attempts to hit end of divergence/peaks
The chart may draw several characters in one location usually adding to the strength of the divergence.
What should I do when a character is painted on my chart:
As this is an educational indicator, I can only recommend that once a character(s) is drawn you should pay further attention to the currency/stock (do further Technical Analysis ). Treat this indicator as a hunting dog, looking for areas for you to investigate. You don’t give your dog the gun so please do not link it to automation and get tilted when something doesn’t go quite your way.
What time frames is this indicator best on:
This indicator was designed on a 1 hour chart. However, it does perform quite well on the daily, 4 and 6 hour charts. Its performance is reduced on 15 and 5 min since previous release (Lachie 3.0: DDS (Divergence Detection System)).
FAQ:
Should I Buy/Long when I see a bullish indicators?
I will not recommend any purchases without first proper TA. Majority of the time the indicator will correctly fin the bottom however in extreme down trends the code will display fake characters. Upon proper TA you will see how these are fake, but if you rely on a signal, you may get caught out.
Should I Sell/Short when I see a bearish indicators?
Only on 125x leve..... nope, please use this for educational purposes until full versions is released.
I am getting too many characters on my chart?
Although this was worked on heavily since previous release you may still encounter numerous characters in one place, for now this is quite normal and can happen when:
-High strength divergence.
-In a down trend occasionally the logic cannot correct interpret the weakness in the market.
Is this indicator applicable to any market?
Yes, although the indicator was developed based on Crypto Currency markets, the indicator is usable and in most instances more accurate on traditional markets.
Will there be future updates released?
As the code ages and further development is made, updates including increase accuracy for automation and signals may be released. This is really released for educational support. These updates may be released under a separate indicator listing.
This is an earlier derivative of current indicator with bullish and bearish divergence with higher accuracy (signal) script.
For access (vendor requirement):
Please contact me via private message on Trading View.
Images of Indicator:
Previous versions:
Lachie 3.0: DDS (Divergence Detection System)
Created and owned by Lachlan Schahinger. (2019)
Automatic Risk to Reward PivotsIn a nutshell I was tired of guestimating what my risk was between pivots when getting into trades I went to work on the basic math behind the relationship of the pivots to find their natural risk to reward ratios.
The natural risk to rewards span high and low...for example...you can go from the S3 --> R3 and that R:R is with a stop loss of the S4 is 7.4
But making all of those possibilities in code is excessive and for simplicity sake I price can only be between two pivot areas at any point in time.
So this auto risk to reward is limited to the 2:1 opportunities. If you by chance do the math for all of the possibilities as I have then it would be easy to change the Take Profit levels.
I use the fibonacci pivot points in this indicator but I include the mid levels and further extensions totaling 20 levels, 21 including the pivot.
Here they are...the generic plots are bolded...the additional levels are the other fib levels
R7 - 200%
R6 - 162%
R5 - 141%
R4 - 127%
R3 - 100%
R-C - 76%
R2 - 62%
R-B - 50%
R1 - 38%
R-A - 24%
Pivot
S-A - (24%)
S1 - (38%)
S-B - (50%)
S2 - (62%)
S-C - (76%)
S3 - (100%)
S4 - (127%)
S5 - (141%)
S6 - (162%)
S7 - (200%)
The indicator give you the setups for uptrends and downtrends based on the pivot point moving averages (ex. ema(hlc3, 34)) from a higher timeframe which you will be free to change yourself in the inputs.
For my setup, I trade from the daily pivots using the 10m or 5m chart so my next level up is the weekly pivots which I view using the 1H chart candles.
In the next iterations I will add the ability to change the MA lengths.
Pivot Point Moving average lengths
Weekly lengths - fast 34 : slow 55
Monthly lengths - fast 13 : slow 34
Yearly lengths - fast 13 : slow 34
Rules for Uptrends
Fast MA > Slow MA
Session high < r6
Rules for Downtrends
Fast MA < Slow MA
Session high > s6
Timeframes applicable are only those who have a higher pivot set above it
Monthly_SR = 240m, 300m, D
Weekly_SR = 26m, 30m, 60m
Daily_SR = 1m, 3m, 5m, 10m, 15m
Your take profit line will always populate where your risk will be 2:1
Your stop loss will always be one pivot level underneath or above your entry
Feel free to ask any questions. Trade well my friends!

TradeChartist Fib Master™TradeChartist Fib Master is a versatile Fibonacci Support and Resistance indicator that can be used to plot Automatic Levels and Fibonacci Levels based on a variety of ways from the settings, including Auto Fibs plot by connecting to an external indicator.
===================================================================================================================
What does ™TradeChartist Fib Master do?
Plots Automatic Levels without the need for user input
Plots 3 types of Fibonacci Levels
════ 1. Auto-Fibs (by connecting to an external indicator - Oscillatory or non-Oscillatory)
════ 2. Fibs based on Lookback (Lookback type - Candles or Days)
════ 3. Fibs based on Price Input
===================================================================================================================
Detailed description of ™TradeChartist Fib Master features
╔══ Automatic Levels Generator ══╗
Enabling Plot Automatic Levels plots support and resistance levels automatically without any input from the user other than preferred levels plot from the indicator settings namely,
Plot Local Levels for Lower TF - Plots all important Support/Resistance levels for mostly smaller time frames (can be used for up to 1hr in most cases). Recommended for Scalping/Swing Trading mostly dependent on volatility.
Plot Local Levels for Higher TF - Plots all important Support/Resistance levels inferred from mostly time frames - Short to Mid term outlook.
Plot Extended Levels for Higher TF - Plots all important Support/Resistance levels inferred from very higher time frames - Mid to Long term outlook.
Use Trading View Data Window to make effective use of the levels.
Tip: Add a duplicate Fib Master indicator to chart, use Automatic Levels Generator and increase transparency of Fib colours to 100. This helps view the levels on Data Window while having the Fib plots on chart.
Note: Uncheck Plot Automatic Levels to enable Fibonacci plots from Fibonacci Levels Generator
╔══ Fibonacci Levels Generator ══╗
════ 1. Auto-Fibs ════
Almost any indicator plot or Signal (Oscillatory or non-Oscillatory) can be connected to Fib Master to generate automatic fib levels. This is done by automatically detecting the price trend based on the connected indicator, its corresponding highest high and lowest low prices of each trend.
Also, Fib Master plots Bull (default - green) and Bear (default - red) Zones background including the signal candle (default - orange), where the trend changes based on the connected indicator Signal. This helps detect the effectiveness of the connected indicator Signal too, as too many unproductive signals from the connected indicator will create numerous Bull and Bear Zones (which also will render the Auto-Fibs ineffective).
To connect an external indicator Signal, just choose the corresponding Signal plot from the Plug Indicator Here dropdown from settings and choose whether the connected signal is Oscillatory (for Oscillators like RSI, CCI, MACD, Trend Identifier signals from more complex indicators like ™TradeChartist Bollinger Bands and Donchian Channels Pro etc.) or non-Oscillatory (for plots like Moving Averages, Super Trend, Ichimoku plots like Kijun Sen etc.)
If the connected Signal is Oscillatory, enter the filter levels. Default is 0 for both fields as most Oscillators have 0 as their mean reversal zone. For Oscillators like RSI, 60/40, 50/50, 55/45 etc. can be used.
Note: Please test the performance and effectiveness of Auto-Fibs of connected Signal first before using it for trades.
════ 2. Fibs based on Lookback ════
Lookback type - Candles
Determines the High and Low price of the user input number of Candles back (100 default) and plots Fibonacci Levels based on the calculated High and Low for the number of candles in the past from the current candle. The levels stay intact on any time frame as long as no new Highs or Lows are formed.
Lookback type - Days
Determines the High and Low price of the user input number of Days back (100 default) and plots Fibonacci Levels based on the calculated High and Low for the number of days in the past from the day of the current bar. The levels stay intact on any time frame as long as no new Highs or Lows are formed.
════ 3. Fibs based on Price Input ════
Plots Fibonacci Levels based on the user specified High and Low Price in the settings input fields. The levels stay intact on any time frame irrespective of new Highs or Lows being formed. Manual Price Input will enable the trader to keep the Levels intact and visually see the higher Fibonacci Retracement levels, when the price crosses beyond 100% retracement. On the other two lookback types, the Fibonacci levels are displayed only upto 100% retracement.
===================================================================================================================
Note: Show Auto-Fibs from current High/Low
When this option is chosen from indicator settings, the Auto-fib levels are drawn from the highest high of the trending price direction to lowest low of last trend for uptrend or vice-versa for downtrend.
===================================================================================================================
Extra Features
The Fibonacci levels can also be reversed by enabling Reverse Fibonacci Levels option from the settings.
0.886 and 1.113 Fib levels can be plotted on chart by enabling Show 0.886 and 1.113 Fibs from settings, as these are important levels for harmonic pattern traders.
Fib Line and Label Style including Color, transparency, size etc. can be changed from settings based on user preference.
===================================================================================================================
Example Charts
XAU-USD Gold Daily chart using Automatic Levels Generator with Zones identified when connected to external indicator
BTC-USDT Daily chart using Automatic Levels Generator
SPX 1hr chart using Automatic Levels Generator
ETH-USDT 1hr chart using AutoFibs generated by connecting Fib Master to RSI with 60/40 Filter levels
XAG-USD (Silver) 1hr chart using Fibonacci Levels based on lookback
===================================================================================================================
Best Practice: Test with different settings first using Paper Trades before trading with real money
===================================================================================================================
This is not a free to use indicator. Get in touch with me (PM me directly if you would like trial access to test the indicator)
Premium Scripts - Trial access and Information
Trial access offered on all Premium scripts.
PM me directly to request trial access to the scripts or for more information.
===================================================================================================================

Camarilla Scanner v1The script is based on Camarilla pivots for trend analysis of stock in intraday.
It will scan the selected stocks chosen in input settings displays the current status of where they are with respect to Camarilla pivots.
The day's history will show only those closed above R4/below S4.

Support and Resistance Levels with Breaks [LuxAlgo]This script provides basic pivot point Support and Resistance Levels to the user whilst displaying Break signal tags. It also has the ability to let the user display more significant breaks by filtering using the Volume Oscillator.
Only more significant breaks of these basic levels are displayed to the user when optimized which avoids noise and messy signals.
It will also display breaks with candles it deems to be bullish (e.g. having a longer upper or lower wick).
Notation
The notation of "B" denotes a break of either a Support or Resistance level with a volume greater than the threshold.
The notation of "Bull or Bear Wick" denotes a bullish or bearish candle on the break.
Settings:
Left Bars - the number of bars left hand side of the pivot.
Right Bars - the number of bars right hand side of the pivot.
Volume Threshold - the threshold value (%) for the Volume Oscillator.
Usage & Details:
Knowing when a pivot S/R level is broken with significance can be of great help to a trader. Many times significant levels may not be broken with significant force and the move is therefore weaker and possibly not worth trading.

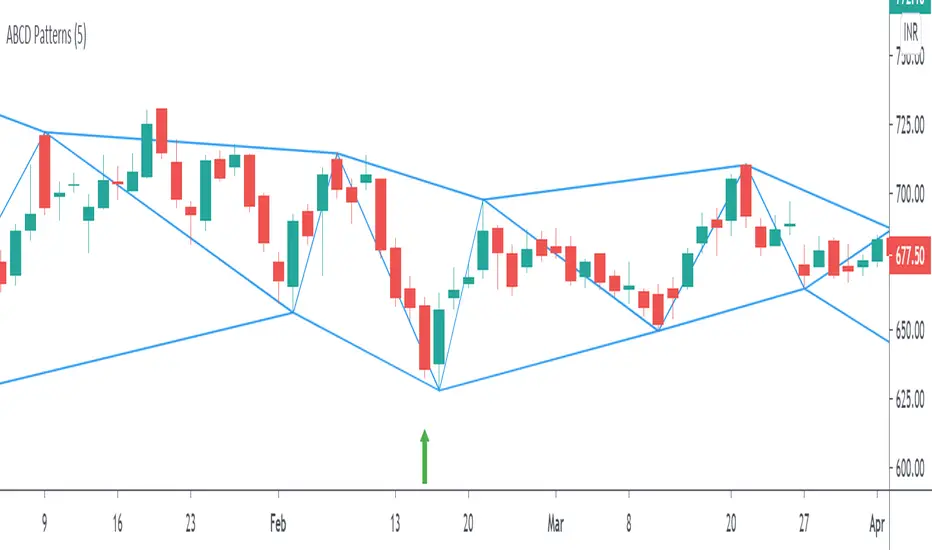
ABCD Harmonic PatternsShows Bullish and Bearish AB=CD Harmonic Patterns with Pivot High, Pivot Low and Pivot Line
CC - PVT CloudsReleasing this test script for PVT ratios using sub-interval harmonics at a 1D, 4H, 1H, 45M, 15M and 5M level.
It basically takes the PVT values for a rolling periodic interval and gets the (avg - min)/max for that interval (the ratio).
Then it colors it based on the subinterval next to it. Just think of it as rolling Ichimoku clouds, but in real-time using PVT.
I'm not saying much more than that, as this is an experimental indicator. Feel free to use it and give me feedback.
Drop a like if this helps you trade, but please do not use these indicators as a DIVINING ROD for your trades.
However, I will possibly release a paid version with TEXTUAL take profit/stoploss indicators.
*DISCLAIMER*
No amount of technical indicators will safe you from a lapse in Due Diligence or Market/Industry Judgement.
I am not responsible for lost equity due to trades caused my relying on this indicator.


Pivot Support & Resistance multi timeframe [LM]Hello guys,
I would like to introduce you pivot support and resistance horizontals. It draws line horizontals on high and low high pivot candles . You can select lines on this timeframe and/or another one.
The colors are dynamic depending whether price is below or above the line:
for the current timeframe green is used for support and blue for resistance
for the other timeframe by default 4h orange is used for support and violet for resistance
There are various sections in setting:
current timeframe pivot setting
show and hide section of the current timeframe
other timeframe pivot setting
show and hide other timeframe horizontals
I'm mainly looking smaller timeframe and trading higher timeframe from level to level
Any suggestions are welcome

Gann-Fun-price-SquaresThis needs no explanation, this is the secrete system that has made many millionaires - By selling courses and indicators of course -I jest
This was just a fun project, that doesn't mean it was not geared towards tradable S/R generation. People who use Gann and Murrey methods will find this useful, others can marvel at it or lol at it, it's all good.
The author takes no responsibility for your profit or loss, this was fun and educational purpose project only.
Have fun :3

Cumulative Delta VolumeHello Traders,
This is Cumulative Delta Volume script. Delta refers to the difference between buying and selling volume at each price level. Cumulative Delta builds upon this concept by recording a cumulative tally of these differences in buying vs selling volume. The Cumulative Delta indicator plots as candlesticks or line. One of the main uses of Cumulative Delta is to confirm or deny market trends. you may need to search it for yourself ;)
You have option to see it as Candles or a Line. also there are options to show 2 SMAs and 2 EMAs with different Lengths, you can set the lengths as you wish.
By default it shows CDV as Heikin Ashi Candles, it can also show it as normal candles:
It can show CDV as a line:
Also you may need to check divergence:
Enjoy!

PT LiquidityVersion 1.0 of our Liquidity indicator helps determine areas where price might gravitate to fill liquidations. We have six levels of interest, broken down into three levels for shorts (highlighted in red) & three levels for longs (highlighted in green). Each level is labeled 25x, 50x, 100x. We added a cloud for a visual to assist in short/long liquidation zones. You want to be taking short setups at the top of the cloud when shorts get squeezed & taking long setups at the bottom of the cloud when longs get squeezed. The indicator has a proprietary formula that allows the levels to change based on volume and time frames. The levels are generated in real-time with a rolling VWMA.
Strategy:
If you are scalping, price tends to ping pong between the 50x & 100x longs (green) to 50x & 100x shorts (red). If we shift outside that zone, consider the trend to have changed. Look at a higher time frame (12h+) for trend direction. Price usually reverses when the daily takes all three liquidation levels. You want to see a strong reaction (wick) once we tap that last liquidation level.
This Oscillator was built around our buy sell indicator & it is used on all time frames for swinging & scalping. It is included as part of the library. Just message us for access!

Hancock - POC VAThis indicator shows POC (Point of Control) and VA (Value Area) High and Low as well as the developing ranges. This indicator makes use of the new arrays which means the resolution for calculating POC and VA is up to 100k bins at, in most cases, tick resolution and allows for custom time-frames.
Not much else needs to be said about this indicator.
Happy Trading
Hancock

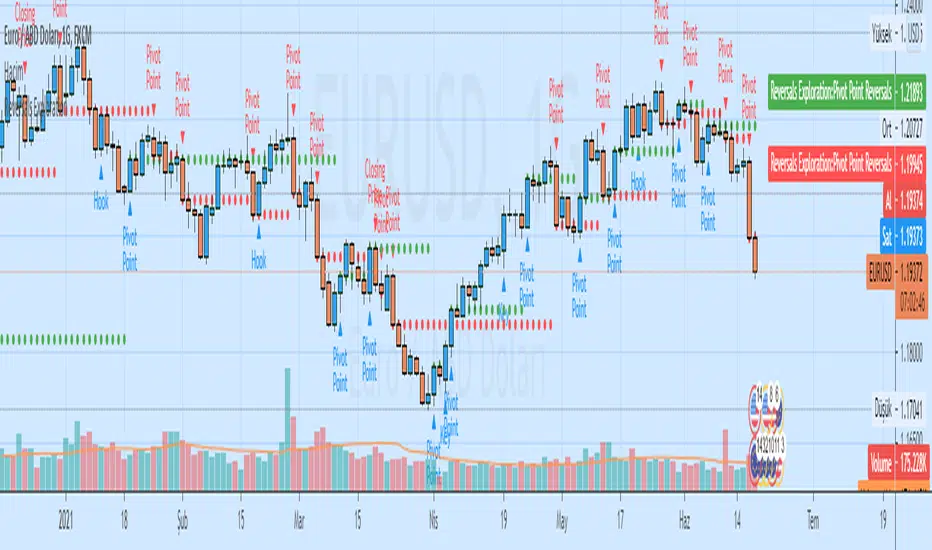
Auto Analysis Short-term Reversals ExplorationAuto Analysis Short-term Reversals Exploration
Based on a study by Larry Lovrencic
Closing Price Reversals Automatic Analysis
Hook Reversals Automatic Analysis
Island Reversals Automatic Analysis
Key Reversals Automatic Analysis
Open/Close Reversals Automatic Analysis
Pivot Point Reversals Automatic Analysis
Hancock - Pivot RangeShows central pivot point and developing central pivot point and colors both pivot ranges based on pivot criteria without using security function calls.
Green - Indicates up trend
Red - Indicates down trend
Orange - Indicates pivot point territory
Happy trading
Hancock

Combo Strategy 123 Reversal & Floor Pivot Points This is combo strategies for get a cumulative signal.
First strategy
This System was created from the Book "How I Tripled My Money In The
Futures Market" by Ulf Jensen, Page 183. This is reverse type of strategies.
The strategy buys at market, if close price is higher than the previous close
during 2 days and the meaning of 9-days Stochastic Slow Oscillator is lower than 50.
The strategy sells at market, if close price is lower than the previous close price
during 2 days and the meaning of 9-days Stochastic Fast Oscillator is higher than 50.
Second strategy
The name ‘Floor-Trader Pivot,’ came from the fact that Pivot points can
be calculated quickly, on the fly using price data from the previous day
as an input. Although time-frames of less than a day can be used, Pivots are
commonly plotted on the Daily Chart; using price data from the previous day’s
trading activity.
WARNING:
- For purpose educate only
- This script to change bars colors.

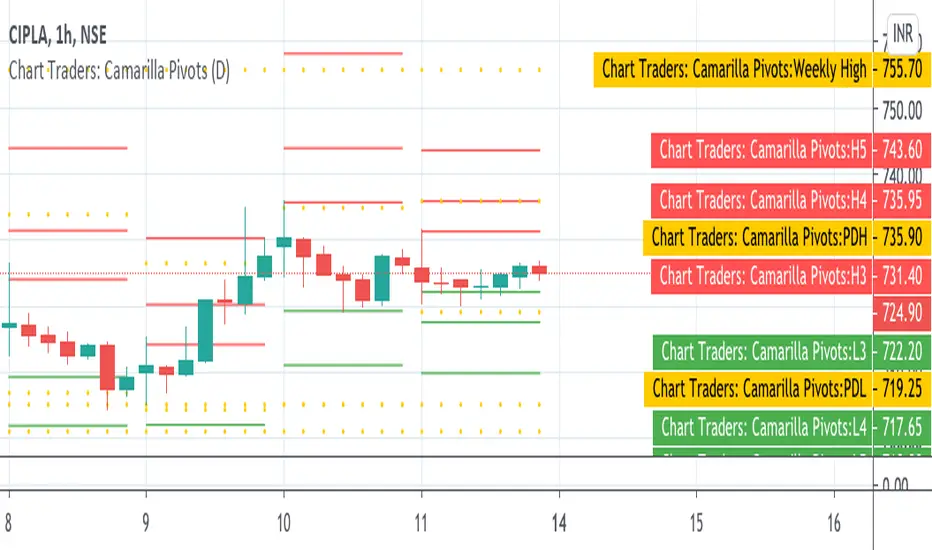
Chart Traders: Camarilla PivotsChart Traders: Camarilla Pivot point indicator gives you support and resistance level.
This indicator give (h1 to H5) five resistance level and (L1 to L5) support level. You can buy at any support level with reversal sign and sell at resistance with reversal sign.
In this indicator you can also see the next day Camarilla pivot points.
Support Resistance - Dynamic v2Hello Traders!
After the addition of "Arrays" to the Pine, I developed new and improved version of Support Resistance - Dynamic script as version 2. In this script Arrays were used. This can be used as Support Resistance tool, also it will be an example for the people who want to learn Array usage in Pine. Many thanks to Pine Team for adding Arrays!
The script finds the Pivot Points and check them in channels if there can be S/R or not, and draws mid line of the channel as S/R line. you can set number of PPs and channel width in the options. Each channel width is optimized dynamically according to Pivot Points. Also you can choose " High/Low " or " Close/Open " as source for Pivot Points.
There is an option for maximum number of S/R levels. S/R levels are found and sorted dynamically and number of S/R lines with enough strength changes dynamically.
Some other options for coloring and line width. (Solid, Dashed or Dotted)
S/R levels are shown in the Labels and Label colors are changed automatically, if S/R line is below the closing price then it's color is Green (as Support), otherwise its color is Red (as Resistance).
Examples:
Enjoy!

Fibonacci-Trading-Indicator_2 (Code-Änderung)Tägliche Gewinne mit dem Fibonacci-Trading Indikator
Die Notierungen bewegen sich in liquiden Märkten in Fibonacci-Verhältnissen. Mit diesem Indikator erhalten Sie für Tagesgeschäfte und für Positionstrades auf Basis einer Woche oder eines Monats Informationen, wo Sie in den Markt einsteigen sollten und was das mindeste erreichbare Kursziel ist. Dieses Kursziel liegt bei 61,8% der gestrigen Handelspanne, der Handelspanne der Vorwoche oder der Handelspanne des Vormonats. Dort realisieren Sie Ihre Gewinne.
Erforderliche Eingaben im Eigenschaftenfenster des Indikators:
• Vorwahl Aufwärtstrend/ Abwärtstrend.
• Zeitrahmen des Kursbalkens für das zu ermittelnde mögliche Hoch/ Tief.
• Handelspanne der vorherigen Periode.
• Aktuell tiefstes Tief des vorgewählten Zeitrahmens, wenn die Notierungen steigen.
• Aktuell höchstes Hoch des vorgewählten Zeitrahmens, wenn die Notierungen fallen.
Für die Erkennung der Bewegungsrichtung kann der Camelback-Indikator eine gute Hilfe sein.
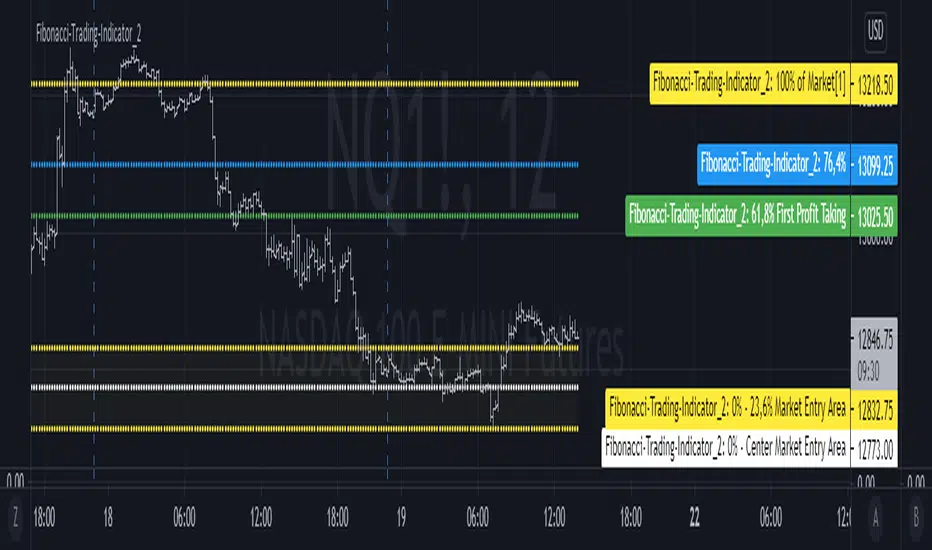
Ausgaben im Chart sind die möglichen Kurslevels, für das mögliche Hoch oder Tief des Kursbalkens im eingestellten Zeitrahmen des Trading-Indikators.
Wichtige Bereiche für das Trading sind folgende Kurslevels:
• Einstiegsbereich 0% - 14,6% oder 0% - 23,6%
• Kursziellevel 61,8%
Kaufen/ verkaufen Sie innerhalb des Einstiegsbereichs zwischen 0% und 23,6%, während der Markt die Bewegungsrichtung vorgibt und sich in Richtung des long-/ oder short-Einstiegspunktes bewegt. Das sind jeweils die Kurslevels bei 14,6% oder 23,6%. Der 61,8%-Kurslevel ist das mindeste erwartbare Kursziel. Wir gehen davon aus, dass der aktuelle Kursbalken mindestens 61,8% der Handelsspanne, der vorherigen Periode erreichen wird. Realisieren Sie deshalb die angelaufenen Gewinne mit 50% der Position, wenn die Notierungen den 61,8% - Level erreicht haben. Mit einem geeigneten Trailing-Stopp lassen Sie sich mit der restlichen Position ausstoppen, riskieren Sie dafür aber nicht mehr als 50 % der angelaufenen Gewinne.
Wählen Sie einen kleinen Zeitrahmen, wenn sich die Notierungen noch im Einstiegsbereich bewegen, um die Richtung des Kursbalkens zu erkennen. Für Positionstrades auf Wochen- oder Monatssicht wird für den Einstieg der Einstiegsbereich 0% - bis 14,6% gewählt. Für Tagesgeschäfte (Zeitrahmen Tag vorgewählt) wird wegen der geringeren Tageshandelspanne der Einstiegsbereich 0% - 23,6% empfohlen.
Mit der Vorwahl Jahr und den entsprechenden Eingaben kann auch das mindeste erwartbare Jahreshoch/ Jahrestief ermittelt werden.
Die Fibonacci-Kurslevels lassen sich ein- und ausblenden. Klicken Sie im Chart auf das Zahnrad für „Chart Einstellungen“. Im Menü „Skalierungen“ kann mit der Vorwahl „Label für Indikatornahmen“ und „Label für letzten Indikatorwert“ die Kurslevels angezeigt werden. Schieben Sie den Chart nach rechts um Unterstützungen und Widerstände an den Kurslevels zu finden.
Bei Eingabefehlern oder fehlenden Eingaben zu einem Zeitrahmen wird der Indikator ausgeblendet.
Achten Sie zur Vermeidung von Verlusten auf ihr Handelsmanagement.
Daily profits with the Fibonacci trading indicator
The quotes move in Fibonacci ratios in liquid markets. With this indicator you receive information for daily trades and position trades based on a week or a month, where you should enter the market and what is the minimum price target that you can achieve. This price target is 61.8% of yesterday's trading range, the trading range of the previous week or the trading range of the previous month.
There you realize your profits.Required entries in the properties window of the indicator:
• Preselection uptrend / downtrend.
• Time frame of the price bar for the possible high / low to be determined.
• previous period trading range.
• Current lowest low of the selected time frame when prices rise.
• Current highest high in the selected time frame when prices fall.
The camelback indicator can be of great help in recognizing the direction of movement.
Outputs in the chart are the possible price levels for the possible high or low of the price bar in the set time frame of the trading indicator.
The following price levels are important areas for trading:
• Entry range 0% - 14.6% or 0% - 23.6%
• Target price level 61.8%
Buy / sell within the entry range between 0% and 23.6% as the market sets the direction of movement and moves towards the long / or short entry point. These are the price levels at 14.6% or 23.6%. The 61.8% price level is the minimum expected price target. We assume that the current bar will reach at least 61.8% of the trading range of the previous period. You should therefore realize the profits you have made with 50% of the position when the prices have reached the 61.8% level. With a suitable trailing stop you can be stopped with the rest of the position, but do not risk more than 50% of the profits.
Choose a small time frame when the quotes are still moving in the entry area to see the direction of the price bar. For position trades on a weekly or monthly perspective, the entry range 0% - to 14.6% is chosen. For day-to-day trades (pre-selected time frame), the entry range 0% - 23.6% is recommended due to the lower daily trading range.With the preselection year and the corresponding entries, the minimum expected annual high / annual low can also be determined.
The Fibonacci price levels can be shown and hidden. In the chart click on the gear wheel for “Chart Settings”. In the “Scaling” menu, the price levels can be displayed with the preselection “Label for indicator names” and “Label for last indicator value”. Slide the chart to the right to find support and resistance at the price levels.
In the event of input errors or missing entries for a time frame, the indicator is hidden.
Pay attention to your trade management to avoid losses.
Derivative Pivot HL Points Hello.
This script aims to take into account mutable variable Pivot Points' periods.
While doing this, it takes the period between 2 signals that I use in the script:
And these periods in my Pivot HL function integrated into len length (Mutable variables) :
The cornerstone of the script is these facts.
Pivot can be optimized by playing with reversal periods.
These pre-formed levels can be used as Supply and Demand levels.
Regards.
