88-Key Piano Range - Musical Price Levels88-Key Piano Range - Musical Price Levels
Description:
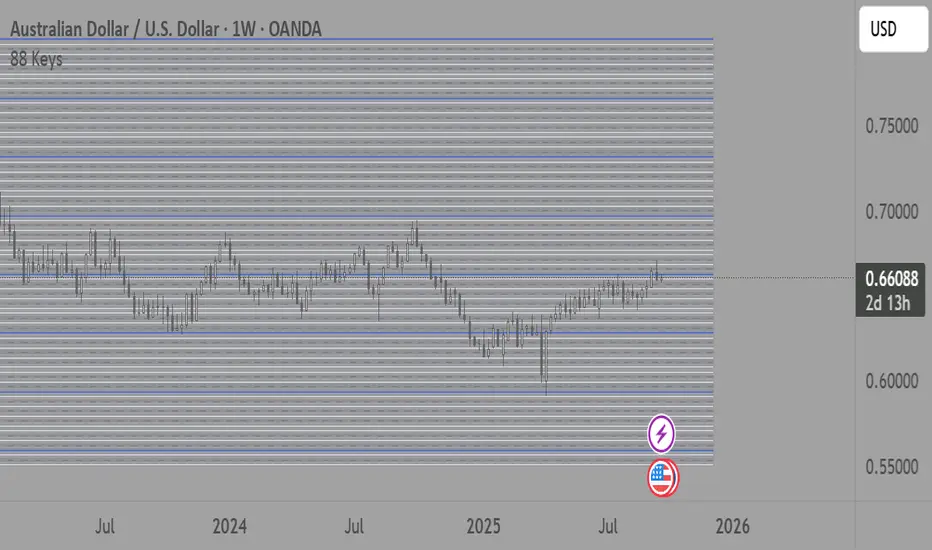
Explore price analysis through musical harmony! This educational indicator maps price movements to the standard 88-key piano keyboard (A0 to C8), offering a creative way to visualize market ranges and explore harmonic price relationships with authentic keyboard-style background fills.
🎹 KEY FEATURES:
• Complete 88-Key Mapping - Full piano range from A0 to C8 mapped to your price range
• Piano-Style Visual Design - Clean background fills distinguishing white keys, black keys, and octaves
• Dual Anchor System - Set two time/price points to define your analytical range
• Flexible Display Options - Show all 88 keys, octaves only (C notes), or custom selections
• Harmonic Exploration - Explore consonant/dissonant key relationships based on music theory
• Real-time Price Note - See what musical note your current price represents
• Customizable Interface - Adjust colors, line widths, fills, and visual elements
🎵 EDUCATIONAL CONCEPTS:
• Octave Levels - C notes as harmonic reference points (similar to round numbers)
• Key Classifications - Natural notes (white keys) vs chromatic notes (black keys)
• Harmonic Intervals - Musical relationships applied to price analysis
• Creative Visualization - Alternative way to view price ranges and movements
⚙️ HOW TO USE:
1. Select Your Price Leg - Choose an upleg, downleg, or significant price movement to explore
2. Set Anchor A - Place at the start of your selected leg (swing low for upleg, swing high for downleg)
3. Set Anchor B - Place at the end of your selected leg (swing high for upleg, swing low for downleg)
4. Configure Display - Select all keys, octaves only, or enable background fills
5. Explore Harmonics - Enable harmony coloring to see musical relationships
6. Study Patterns - Observe how price movements align with musical intervals
🎼 CREATIVE APPLICATIONS:
• Experimental Analysis - Try a musical approach to leg analysis
• Educational Tool - Learn about mathematical relationships in both music and markets
• Alternative Perspective - View support/resistance through a musical lens
• Pattern Recognition - Explore if harmonic levels show interesting price behavior
• Fun Learning - Combine musical knowledge with trading concepts
📊 EXPERIMENTAL USE:
• Creative alternative to traditional Fibonacci levels
• Educational exploration of mathematical harmony in markets
• Interesting way to visualize price ranges and retracements
• Novel approach for musicians interested in trading concepts
Important Note: This is an educational and experimental tool that applies musical theory concepts to price analysis. It should be used for learning and exploration purposes alongside proven technical analysis methods. The musical relationships are mathematically based but not validated as reliable trading signals.
Piano
Piano Frequency LevelsPiano Frequency Levels
This indicator applies the mathematical principles of musical harmony to market analysis, creating support and resistance levels based on authentic piano frequency ratios. Drawing from centuries-old musical theory, it maps the precise mathematical relationships between piano keys to price levels.
How It Works: The indicator uses the exact frequency ratios from equal temperament tuning - the same mathematical system that makes pianos sound harmonious. Each level represents an actual piano key frequency, scaled proportionally to your chosen anchor price.
Key Features:
• Piano-Based Ratios: Uses authentic 12-tone equal temperament frequency relationships (1.05946 ratio between semitones)
• Directional Intelligence: Automatically creates ascending levels from lows (resistance) or descending levels from highs (support)
• Musical Note Labels: Optional display of actual piano key names (C4, D#5, F6, etc.) alongside price levels
• Black Key Subdivisions: Toggle authentic sharp/flat keys between natural notes for additional precision
• Octave Color Coding: Each musical octave displays in a different color for easy visual identification
• Anchor Reference: Bright green line clearly marks your C-note reference point
Musical Foundation: Every level corresponds to an actual piano key. The anchor point represents "C" (the musical root), with levels progressing through the natural musical sequence: C, D, E, F, G, A, B, then repeating in higher octaves. This creates proportional spacing that mirrors the harmonic relationships musicians have used for centuries.
Usage:
1. Set your anchor to a significant market high or low
2. Choose your desired number of levels (typically 12-24 for 1-2 octaves)
3. Enable "Add Black Keys" for additional intermediate levels
4. Enable "Show Note Names" to see which piano key each level represents
The Theory: Musical harmony is based on precise mathematical ratios that create pleasing relationships between frequencies. These same mathematical principles may manifest in market movements, as price action often exhibits proportional relationships similar to musical intervals.
Unique Advantages:
• Based on established mathematical principles rather than arbitrary ratios
• Provides both major levels (white keys) and intermediate levels (black keys)
• Automatically adapts direction based on anchor type (high vs low)
• Maintains authentic musical relationships across all timeframes and price ranges
Important Note: This indicator presents a theoretical framework for market analysis. Like all technical analysis tools, it should be used in conjunction with other forms of analysis and proper risk management. The musical ratios provide a unique perspective on potential support and resistance levels, but past performance does not guarantee future results.
Transform your charts into a musical instrument and discover the hidden harmonies in market movements.
