Relative Strength vs S&P 500 (SPX/ES) Relative Strength vs S&P 500
This indicator measures the relative performance of an asset compared to the S&P 500, helping traders and investors identify whether an asset is outperforming or underperforming the broader market.
The calculation is based on a price ratio between the selected asset and the S&P 500, optionally normalized to a base value (100) for easier interpretation.
How to read it:
Above the baseline (100) → the asset is outperforming the S&P 500
Below the baseline (100) → the asset is underperforming the S&P 500
Rising line → strengthening relative performance
Falling line → weakening relative performance
Why it’s useful:
Helps focus on market leaders, not just assets that “look cheap”
Filters trades and investments in the direction of relative strength
Useful for swing trading, long-term investing, and portfolio allocation
Widely used in institutional and professional asset management
This indicator is best used as a trend and selection filter, in combination with technical setups (support/resistance, VWAP, structure).
Indicadores y estrategias


Strategy-Based Breakout Backtest by AlturoiThis educational strategy is designed to help active traders learn how to turn trading ideas into data-driven decisions by testing strategies against historical price action before risking real capital.
The script walks through the step-by-step backtesting workflow on TradingView, showing how strategy logic, entries, exits, and risk rules translate into measurable performance metrics such as win rate, drawdown, and expectancy.
What this script helps you learn:
How to backtest on TradingView using Pine Script strategies
How the Strategy Tester calculates performance results
How to interpret win rate, drawdowns, and consistency
How to validate breakout and support/resistance concepts
How to identify structural edge — or flaws — before going live
This is not a signal service or financial advice. It is an educational framework meant to help traders understand proper backtesting techniques and avoid common mistakes when evaluating trading strategies.
Use this script as a learning template to experiment, modify logic, and improve your understanding of how professional backtesting on TradingView works.

SETUP XANDAO ETFEste setap é usado para operar nos futuros, usamos essas métricas para poder achar entradas


Hurst-Optimized Adaptive Channel [Kodexius]Hurst-Optimized Adaptive Channel (HOAC) is a regime-aware channel indicator that continuously adapts its centerline and volatility bands based on the market’s current behavior. Instead of using a single fixed channel model, HOAC evaluates whether price action is behaving more like a trend-following environment or a mean-reverting environment, then automatically selects the most suitable channel structure.
At the core of the engine is a robust Hurst Exponent estimation using R/S (Rescaled Range) analysis. The Hurst value is smoothed and compared against user-defined thresholds to classify the market regime. In trending regimes, the script emphasizes stability by favoring a slower, smoother channel when it proves more accurate over time. In mean-reversion regimes, it deliberately prioritizes a faster model to react sooner to reversion opportunities, similar in spirit to how traders use Bollinger-style behavior.
The result is a clean, professional adaptive channel with inner and outer bands, dynamic gradient fills, and an optional mean-reversion signal layer. A minimalist dashboard summarizes the detected regime, the current Hurst reading, and which internal model is currently preferred.
🔹 Features
🔸 Robust Regime Detection via Hurst Exponent (R/S Analysis)
HOAC uses a robust Hurst Exponent estimate derived from log returns and Rescaled Range analysis. The Hurst value acts as a behavioral filter:
- H > Trend Start threshold suggests trend persistence and directional continuation.
- H < Mean Reversion threshold suggests anti-persistence and a higher likelihood of reverting toward a central value.
Values between thresholds are treated as Neutral, allowing the channel to remain adaptive without forcing a hard bias.
This regime framework is designed to make the channel selection context-aware rather than purely reactive to recent volatility.
🔸 Dual Channel Engine (Fast vs Slow Models)
Instead of relying on one fixed channel, HOAC computes two independent channel candidates:
Fast model: shorter WMA basis and standard deviation window, intended to respond quickly and fit more reactive environments.
Slow model: longer WMA basis and standard deviation window, intended to reduce noise and better represent sustained directional flow.
Each model produces:
- A midline (basis)
- Outer bands (wider deviation)
- Inner bands (tighter deviation)
This structure gives you a clear core zone and an outer envelope that better represents volatility expansion.
🔸 Rolling Optimization Memory (Model Selection by Error)
HOAC includes an internal optimization layer that continuously measures how well each model fits current price action. On every bar, each model’s absolute deviation from the basis is recorded into a rolling memory window. The script then compares total accumulated error between fast and slow models and prefers the one with lower recent error.
This approach does not attempt curve fitting on multiple parameters. It focuses on a simple, interpretable metric: “Which model has tracked price more accurately over the last X bars?”
Additionally:
If the regime is Mean Reversion, the script explicitly prioritizes the fast model, ensuring responsiveness when reversals matter most.
🔸 Optional Output Smoothing (User-Selectable)
The final selected channel can be smoothed using your choice of:
- SMA
- EMA
- HMA
- RMA
This affects the plotted midline and all band outputs, allowing you to tune visual stability and responsiveness without changing the underlying decision engine.
🔸 Premium Visualization Layer (Inner Core + Outer Fade)
HOAC uses a layered band design:
- Inner bands define the core equilibrium zone around the midline.
- Outer bands define an extended volatility envelope for extremes.
Gradient fills and line styling help separate the core from the extremes while staying visually clean. The midline includes a subtle glow effect for clarity.
🔸 Adaptive Bar Tinting Strength (Regime Intensity)
Bar coloring dynamically adjusts transparency based on how far the Hurst value is from 0.5. When market behavior is more decisively trending or mean-reverting, the tint becomes more pronounced. When behavior is closer to random, the tint becomes more subtle.
🔸 Mean-Reversion Signal Layer
Mean-reversion signals are enabled when the environment is not classified as Trending:
- Buy when price crosses back above the lower outer band
- Sell when price crosses back below the upper outer band
This is intentionally a “return to channel” logic rather than a breakout logic, aligning signals with mean-reversion behavior and avoiding signals in strongly trending regimes by default.
🔸 Minimalist Dashboard (HUD)
A compact table displays:
- Current regime classification
- Smoothed Hurst value
- Which model is currently preferred (Fast or Slow)
- Trend flow direction (based on midline slope)
🔹 Calculations
1) Robust Hurst Exponent (R/S Analysis)
The script estimates Hurst using a Rescaled Range approach on log returns. It builds a returns array, computes mean, cumulative deviation range (R), standard deviation (S), then converts RS into a Hurst exponent.
calc_robust_hurst(int length) =>
float r = math.log(close / close )
float returns = array.new_float(length)
for i = 0 to length - 1
array.set(returns, i, r )
float mean = array.avg(returns)
float cumDev = 0.0
float maxCD = -1.0e10
float minCD = 1.0e10
float sumSqDiff = 0.0
for i = 0 to length - 1
float val = array.get(returns, i)
sumSqDiff += math.pow(val - mean, 2)
cumDev += (val - mean)
if cumDev > maxCD
maxCD := cumDev
if cumDev < minCD
minCD := cumDev
float R = maxCD - minCD
float S = math.sqrt(sumSqDiff / length)
float RS = (S == 0) ? 0.0 : (R / S)
float hurst = (RS > 0) ? (math.log10(RS) / math.log10(length)) : 0.5
hurst
This design avoids simplistic proxies and attempts to reflect persistence (trend tendency) vs anti-persistence (mean reversion tendency) from the underlying return structure.
2) Hurst Smoothing
Raw Hurst values can be noisy, so the script applies EMA smoothing before regime decisions.
float rawHurst = calc_robust_hurst(i_hurstLen)
float hVal = ta.ema(rawHurst, i_smoothHurst)
This stabilized hVal is the value used across regime classification, dynamic visuals, and the HUD display.
3) Regime Classification
The smoothed Hurst reading is compared to user thresholds to label the environment.
string regime = "NEUTRAL"
if hVal > i_trendZone
regime := "TRENDING"
else if hVal < i_chopZone
regime := "MEAN REV"
Higher Hurst implies more persistence, so the indicator treats it as a trend environment.
Lower Hurst implies more mean-reverting behavior, so the indicator enables MR logic and emphasizes faster adaptation.
4) Dual Channel Models (Fast and Slow)
HOAC computes two candidate channel structures in parallel. Each model is a WMA basis with volatility envelopes derived from standard deviation. Inner and outer bands are created using different multipliers.
Fast model (more reactive):
float fastBasis = ta.wma(close, 20)
float fastDev = ta.stdev(close, 20)
ChannelObj fastM = ChannelObj.new(fastBasis, fastBasis + fastDev * 2.0, fastBasis - fastDev * 2.0, fastBasis + fastDev * 1.0, fastBasis - fastDev * 1.0, math.abs(close - fastBasis))
Slow model (more stable):
float slowBasis = ta.wma(close, 50)
float slowDev = ta.stdev(close, 50)
ChannelObj slowM = ChannelObj.new(slowBasis, slowBasis + slowDev * 2.5, slowBasis - slowDev * 2.5, slowBasis + slowDev * 1.25, slowBasis - slowDev * 1.25, math.abs(close - slowBasis))
Both models store their structure in a ChannelObj type, including the instantaneous tracking error (abs(close - basis)).
5) Rolling Error Memory and Model Preference
To decide which model fits current conditions better, the script stores recent errors into rolling arrays and compares cumulative error totals.
var float errFast = array.new_float()
var float errSlow = array.new_float()
update_error(float errArr, float error, int maxLen) =>
errArr.unshift(error)
if errArr.size() > maxLen
errArr.pop()
Each bar updates both error histories and computes which model has lower recent accumulated error.
update_error(errFast, fastM.error, i_optLookback)
update_error(errSlow, slowM.error, i_optLookback)
bool preferFast = errFast.sum() < errSlow.sum()
This is an interpretable optimization approach: it does not attempt to brute-force parameters, it simply prefers the model that has tracked price more closely over the last i_optLookback bars.
6) Winner Selection Logic (Regime-Aware Hybrid)
The final model selection uses both regime and rolling error performance.
ChannelObj winner = regime == "MEAN REV" ? fastM : (preferFast ? fastM : slowM)
rawMid := winner.mid
rawUp := winner.upper
rawDn := winner.lower
rawUpInner := winner.upper_inner
rawDnInner := winner.lower_inner
In Mean Reversion, the script forces the fast model to ensure responsiveness.
Otherwise, it selects the lowest-error model between fast and slow.
7) Optional Output Smoothing
After the winner is selected, the script optionally smooths the final channel outputs using the chosen moving average type.
smooth(float src, string type, int len) =>
switch type
"SMA" => ta.sma(src, len)
"EMA" => ta.ema(src, len)
"HMA" => ta.hma(src, len)
"RMA" => ta.rma(src, len)
=> src
float finalMid = i_enableSmooth ? smooth(rawMid, i_smoothType, i_smoothLen) : rawMid
float finalUp = i_enableSmooth ? smooth(rawUp, i_smoothType, i_smoothLen) : rawUp
float finalDn = i_enableSmooth ? smooth(rawDn, i_smoothType, i_smoothLen) : rawDn
float finalUpInner = i_enableSmooth ? smooth(rawUpInner, i_smoothType, i_smoothLen) : rawUpInner
float finalDnInner = i_enableSmooth ? smooth(rawDnInner, i_smoothType, i_smoothLen) : rawDnInner
This preserves decision integrity since smoothing happens after model selection, not before.
8) Dynamic Visual Intensity From Hurst
Transparency is derived from the distance of hVal to 0.5, so stronger behavioral regimes appear with clearer tints.
int dynTrans = int(math.max(20, math.min(80, 100 - (math.abs(hVal - 0.5) * 200))))

The Strat: 3-2D Setup Label + Entry, Target & AlertsThis is an indicator that identifies the 3-2D setup based on TheStrat & will alert you if you have this on the chart. Once the 3-2D setup happens this will give you the entry, target and price labels. You can change the font size, label colors and add optional alerts.

3 EMA IndicatorThis indicator is a combination og three EMA's
This indicator is a combination og three EMA's
This indicator is a combination og three EMA's
This indicator is a combination og three EMA's
This indicator is a combination og three EMA's

The Strat Candle Types (1 / 2U / 2D / 3)This script uses TheStrat candle numbers 1, 2D, 2U, 3 and places the text below or above. You can also change the text size. This also allows you to change the colors of the candles with two options for the 1 & 3 so you can color them in the direction they are going. For example a 1 that is green can be green and a 1 that is red can be red.

50SMA bounceScans stocks that closed above Weekly 10SMA and previous week closing below the weekly 10SMA

Multitime ATR with ATR Heat Line# Multi-Timeframe ATR Supertrend with ATH Finder
## Overview
This advanced Pine Script indicator combines multi-timeframe ATR-based Supertrend analysis with an All-Time High (ATH) tracking system. Designed for swing traders who need comprehensive trend analysis across multiple timeframes while monitoring key price levels.
## Key Features
### 1. Multi-Timeframe ATR Supertrend (1H, 4H, 1D)
- **1 Hour Supertrend** (Blue): Short-term trend identification
- **4 Hour Supertrend** (Purple): Medium-term trend confirmation
- **1 Day Supertrend** (Green/Red): Primary trend direction
- Each timeframe displays independent trend lines with customizable colors and visibility
### 2. Dual ATR Data System (1D Only)
- **Previous Day ATR** (lookahead_off): Used for main ATR lines - enables pre-market study and avoids intraday crossover issues
- **Current Day ATR** (lookahead_on): Used for Overheating Line calculation - provides real-time profit-taking signals
### 3. Overheating Line
- Dynamically calculated as: `1D ATR + (ATR Width × 1.3)`
- Orange line indicating potential overextension zones
- Uses current day real-time ATR for intraday decision-making
- Only displays during uptrends
- Customizable multiplier (default: 1.3)
### 4. ATH (All-Time High) Finder
- Automatically tracks and displays the all-time high with a horizontal line
- **Line Color**: Lime green (customizable)
- **Label System**:
- Green label when price is at ATH
- Red label when ATH is historical
- Toggle label visibility independently
- **Bug Fix**: Prevents vertical line display when ATH occurs on current bar
- Line extends to the right for easy visualization
### 5. Warning & Break Signals
Each timeframe provides two types of alerts:
- **Warning Signal** (⚠️): Price closes below uptrend line (potential reversal warning)
- **Break Signal** (⚡): Price closes above downtrend line (potential breakout)
- Smart timing intervals prevent signal spam:
- 1H: Checks every 4 hours (warning) / 1 hour (break)
- 4H/1D: Max 2 signals per day
### 6. Trend Change Indicators
- Small circles mark the exact bar where trend changes occur
- Color-coded for each timeframe
- Helps identify reversal points and trend strength
### 7. Master Control Switches
Efficiently manage all visual elements:
- **Master Highlighter**: Toggle all background fills on/off
- **Master Signals**: Toggle all warning/break signals
- **Master Up Trend**: Toggle all uptrend lines and circles
- **Master Down Trend**: Toggle all downtrend lines and circles
### 8. Fast Cut Lines (Optional)
- Additional support/resistance lines offset by a percentage from main ATR lines
- Useful for tighter stop-loss management
- Separate controls for up and down trends
- Default: OFF (customizable offset percentage)
### 9. Timeframe Visibility Control
- **Hide on Daily+**: Automatically hides indicators (except 1D ATR) on daily timeframes and above
- Reduces chart clutter on higher timeframes
- 1D ATR always visible regardless of chart timeframe
### 10. EMA Integration (Optional)
- Display 20/50/200 EMAs for confluence with ATR trends
- Toggle on/off independently
## Use Cases
### For Swing Traders
1. **Entry Timing**: Wait for multiple timeframe alignment (1H, 4H, 1D all in uptrend)
2. **Trend Confirmation**: Use trend change circles to identify momentum shifts
3. **Profit Taking**: Monitor Overheating Line for potential exit zones
### For Position Management
1. **Stop Loss Placement**: Use 1D ATR line or Fast Cut lines as dynamic stop levels
2. **Risk Assessment**: Distance between timeframe ATR lines indicates volatility
3. **Breakout Trading**: Break signals (⚡) identify potential breakout opportunities
### For Pre-Market Analysis
- 1D ATR uses previous day data, allowing traders to:
- Study support/resistance levels before market open
- Plan entry/exit strategies based on confirmed data
- Avoid false signals from incomplete daily candles
## Settings Guide
### ATH Finder Settings
- **Show ATH Line**: Toggle ATH line visibility
- **Show ATH Label**: Toggle ATH label display (can hide label while keeping line)
- **ATH Line Color**: Customize line color (default: lime)
- **ATH Line Width**: Adjust line thickness (1-5)
### Timeframe Settings (Each timeframe has independent controls)
- **ATR Period**: Lookback period for ATR calculation (default: 10)
- **ATR Multiplier**: Distance multiplier from price (default: 1.0)
- **Show Label**: Display " " / " " / " " text labels
- **Show Warning/Break Signals**: Toggle alert symbols
- **Highlighter**: Toggle background fill between price and ATR line
### Overheating Line Settings
- **Show Overheating Line**: Toggle visibility
- **Overheating Multiplier**: Adjust distance above 1D ATR (default: 1.3)
### Cut Lines Settings
- **Show Fast Cut Line (Up/Down)**: Toggle visibility
- **Fast Cut Offset %**: Percentage distance from ATR lines (default: 1.0%)
## Color Scheme
- **Current TF**: Green (up) / Red (down)
- **1H ATR**: Blue (#1848cc) / Dark Blue (#210ba2)
- **4H ATR**: Purple (#7b1fa2) / Dark Purple (#4e0f60)
- **1D ATR**: Green (#4caf50) / Dark Red (#8c101a)
- **Overheating Line**: Orange (#ff9800)
- **ATH Line**: Lime (customizable)
## Technical Notes
### ATR Calculation
- Uses True Range for volatility measurement
- Option to switch between SMA and EMA calculation methods
- Adapts to both volatile and stable market conditions
### Performance Optimization
- Maximum 500 lines and 500 labels to prevent memory issues
- Bar index limitations prevent historical data errors
- Efficient repainting prevention for 1D timeframe
### Alert System
Built-in alert conditions for:
- Buy/Sell signals (Current TF)
- Warning signals (all timeframes)
- Break signals (all timeframes)
## Best Practices
1. **Multiple Timeframe Confirmation**: Don't trade against higher timeframe trends
2. **Overheating Awareness**: Consider profit-taking when price reaches orange line
3. **ATH Monitoring**: Exercise caution near all-time highs (increased volatility risk)
4. **Signal Filtering**: Use warning signals as alerts, not immediate action triggers
5. **Stop Loss Management**: Place stops below the most relevant ATR line for your timeframe
## Version Information
- Pine Script Version: 5
- Indicator Type: Overlay
- Max Lines: 500
- Max Labels: 500
## Credits
Created by @yohei ogura with <3
Modified for Multi-Timeframe functionality with ATH tracking

Global Sessions Pro NY/London/Tokyo - O/C/H/LGLOBAL SESSIONS PRO — NY / LONDON / TOKYO
Session Opens, Highs, Lows, Midpoints, Closes, Ranges & Killzones
OVERVIEW
Global Sessions Pro is a comprehensive session-mapping indicator designed for traders who rely on market structure, session context, and time-based behavior.
The indicator automatically plots New York, London, and Tokyo sessions, including:
• Session Open, High, Low, Midpoint, and Close
• Prior session levels projected forward
• Session range boxes
• Right-side labeled price levels (clearly identified)
• Stacked session summary labels (no overlap)
• Optional killzones and overlap windows
• Breakout alerts (prior or current session levels)
The script is fully timezone-aware, DST-safe, and works on any chart timeframe.
KEY FEATURES
SESSION MAPPING
For each session (NY / London / Tokyo), the indicator can display:
• Open
• High
• Low
• Midpoint (High + Low) / 2
• Close
Each level is drawn with its own horizontal line and optional right-side label, so there is never confusion about which line represents which level.
SESSION RANGE BOXES
Optional shaded boxes highlight the true session range as it develops in real time.
These are useful for visualizing:
• Compression vs expansion
• Relative session volatility
• Strength or weakness between sessions
Opacity and visibility are fully configurable.
RIGHT-SIDE LEVEL LABELS
Each session level can be labeled on the right edge of the chart, showing:
• Session name (NY / Lon / Tok)
• Level type (O / H / L / M / C)
• Optional price value
Examples:
NY H: 18234.25
Lon L: 18098.50
Tok M: 18142.75
This eliminates ambiguity when multiple session levels overlap or share similar colors.
SESSION SUMMARY LABELS (AUTO-STACKED)
At the top of each session range, an optional summary label displays:
• Session name
• Open / High / Low / Close
• Total range (points)
• Range in ticks
• ATR multiple
Summary labels are automatically stacked vertically using ATR-based or tick-based spacing, preventing overlap even when multiple sessions occur close together.
PRIOR SESSION LEVELS
The indicator can project prior session levels into the next session, including:
• Prior High and Low
• Optional prior Open, Close, and Midpoint
These levels are commonly used for:
• Support and resistance
• Liquidity sweeps
• Mean reversion
• Failed breakouts
Projection length is configurable and safely capped to comply with TradingView drawing limits.
KILLZONES AND SESSION OVERLAPS
Optional background shading highlights key institutional windows:
• London Open
• New York Open
• London / New York overlap
These zones help identify high-probability volatility windows and time-based trade filters.
All killzones respect the selected session timezone basis.
ALERTS
Built-in alerts are available for:
• Break of prior session high
• Break of prior session low
• Break of current session high
• Break of current session low
Alerts can be configured to trigger on wick or close.
Alert logic is written using precomputed crossover detection to ensure historical consistency and avoid missed or false alerts.
TIMEZONE AND SESSION HANDLING (IMPORTANT)
SESSION TIME BASIS OPTIONS
The indicator supports three session-time modes:
Market Local (DST-aware) – Recommended
• New York uses America/New_York
• London uses Europe/London
• Tokyo uses Asia/Tokyo
• Automatically adjusts for daylight saving time
UTC (Fixed)
• Sessions are interpreted strictly in UTC
• Best for crypto or non-DST workflows
• Requires manual adjustment during DST changes
Custom Timezone
• Define a single custom timezone for all sessions
This ensures sessions display correctly regardless of the chart’s timezone.
DEFAULT SESSION TIMES
(Default values assume Market Local (DST-aware) mode)
Tokyo: 09:00 – 15:00
London: 08:00 – 16:30
New York: 09:30 – 16:00
These defaults are optimized for cash and index trading.
FX traders may adjust session windows as needed.
BEST USE CASES
This indicator is particularly effective for:
• Index futures (ES, NQ, RTY, DAX, FTSE)
• Forex session-based strategies
• Time-based breakout systems
• Liquidity sweep and mean-reversion models
• London Open and New York Open trading
• Multi-session market context analysis
PERFORMANCE AND SAFETY NOTES
• All future-drawn objects are capped to comply with TradingView limits
• Crossover logic is evaluated every bar to prevent calculation drift
• Old session drawings are automatically culled to reduce chart clutter
• Works on all intraday and higher timeframes
RECOMMENDED SETTINGS
For most traders:
• Session Time Basis: Market Local (DST-aware)
• Show Open / High / Low / Midpoint: ON
• Prior Session Levels: ON
• Summary Labels: ON
• Killzones: ON
• Alerts: ON (Close-based)
FINAL NOTES
This indicator is designed to provide objective session structure without opinionated trade signals. It works best as a context layer combined with your own execution rules, confirmations, and risk management.
If you trade time, structure, and liquidity, this script provides the framework.

Gemini Smart SMA Pro + Wyckoff V2 (Enhanced Cloud)The Smart SMA Pro + Wyckoff V2 is an advanced trend-following and market-cycle indicator built for traders who utilize Wyckoff Theory and Volume Spread Analysis (VSA). It is specifically designed to identify the transition from "Cause" (Squeeze/Accumulation) to "Effect" (Expansion/Markup).
By analyzing the volatility spread between two customizable Moving Averages and validating movements with relative volume, this tool helps traders stay out of sideways markets and enter only when high-conviction momentum is present.
Key Features
Wyckoff Phase Detection: Automatically detects Squeeze (Accumulation/Distribution) and Expansion (Markup/Markdown) phases.
Intelligent Dynamic Cloud: The cloud between the MAs changes its transparency dynamically based on the Volume Ratio and trend slope. Darker colors indicate high-volume trend confirmation.
Dual-Layered SOS/SOW Signals: * SOS (Sign of Strength): A Yellow Dot appears on a bullish squeeze breakout. A Yellow Arrow is added only if the move is validated by High Relative Volume.
SOW (Sign of Weakness): An Orange Dot appears on a bearish breakout, with an Orange Arrow appearing only if supported by high volume.
Live Multi-Data Dashboard: A real-time table displaying the status of Fast/Slow MAs, the current market cycle stage, and the Volume Ratio.
Professional Alerts: Built-in alerts for Sign of Strength (SOS) and Sign of Weakness (SOW) breakouts.
How to Trade with it
Grey Cloud (Squeeze): Market is building a "Cause." Avoid trading and prepare for a breakout.
Yellow Dot + Arrow: This is a Confirmed SOS. It indicates institutional participation and a high probability of a new Markup phase.
Buy/Sell Labels: Standard trend entries based on price crossing the Signal Line (Fast MA). Use these to join an already established trend.
Dashboard Monitoring: Check the "Vol. Ratio" to see if the current move has enough strength to sustain the expansion.
How this Indicator was Created
This project is the result of a cutting-edge collaborative development process between a human trader and Gemini (Google’s AI).
Logic Synthesis: We combined traditional technical analysis with AI-optimized algorithms to calculate the Volatility Ratio, ensuring the "Squeeze" detection is more accurate than standard Bollinger-based tools.
Conditional Visuals: The logic was refined through multiple iterations to create a "Smart Visual" system. For instance, the Volume-Validated Arrow was an architectural decision to separate minor breakouts from high-conviction institutional moves.
Code Optimization: The entire script was written in Pine Script® V6, ensuring maximum performance, low latency on charts, and a clean, responsive Dashboard interface using advanced table objects.
----------------------------------------------------------------------------------------------------------------------------------------------------
The Partnership: This indicator represents the perfect synergy between human market intuition and AI’s computational precision, resulting in a tool that is both mathematically sound and visually intuitive for professional use.

Info Box with VPINfo box with turnover
it has all the % of SL
it also has VOlume and turnover with it
It is lighter version of prov

Squeeze Momentum + MACD Balancedcombines Squeeze Momentum and MACD, scaling the MACD to visually match the Squeeze Momentum histogram. I went through your code and it looks mostly correct, but I can give you a few notes and potential improvements to make it cleaner and more robust:

RSI Swing + VWAP + EMA + Camarilla + PDH/PDL+CPRThis script provide the follwing -
1. Daily CPR level
2. Camarilla S3/R3
3. Previous Day High/Low (PDH/PDL)
4. Dynamic VWAP
5. Dynamic EMA 20/200
6. Dynamic RSi Swing
Dec 10
Release Notes
This script provide the follwing -
1. Daily CPR level
2. Camarilla S3/R3
3. Previous Day High/Low (PDH/PDL)
4. Dynamic VWAP
5. Dynamic EMA 20/200/36
6. Dynamic RSi Swing
Which is better: 36 EMA or 36 SMA for Support/Resistance?
✔ 36 EMA (Exponential Moving Average)
Better for intraday, short-term trading, scalping, and momentum trading.
Why?
Reacts faster to price.
Captures trend shifts early.
Works great when market is trending or volatile.
Most traders use EMA for dynamic support/resistance → works better because of crowd behavior.
Ideal for:
NIFTY, BANKNIFTY, FINNIFTY intraday | Options entries | Trend continuation trades.
Why 20 EMA is Important
The 20 EMA is one of the most widely used moving averages for intraday, swing, and positional trading because it captures short-term trend strength and momentum.
📌 20 EMA Works Best For
✔ Intraday trend identification
✔ Momentum continuation entries
✔ Dynamic support/resistance
✔ Quick reversal detection
✔ Options trading (NIFTY/BNF)
✔ Breakout & pullback trades
EMA 200 – Why It’s Extremely Important
The 200 EMA represents the long-term trend and is respected by:
Institutions
Algo systems
Big traders
Swing traders
Index traders
It acts like a major wall of support or resistance.
💡 What EMA 200 Tells You
✔ Long-term trend direction
Price above 200 EMA → Long-term uptrend
Price below 200 EMA → Long-term downtrend
✔ Strong trend reversal signals
When price crosses the 200 EMA on 15m/1h/1D charts → a deeper trend change is possible.
✔ Institutional support/resistance
Very powerful bounce/rejection zones
Many markets reverse exactly at 200 EMA
What is Previous Day High (PDH)?
The highest price the market reached in the previous trading session.
Why PDH is Important?
Acts as strong resistance
Breakout level for uptrend
Sellers often defend this zone
If broken with volume → strong bullish momentum
🔴 What is Previous Day Low (PDL)?
The lowest price the market reached in the previous trading session.
Why PDL is Important?
Acts as strong support
Breakdown level for downtrend
Buyers defend this level
If broken with volume → strong bearish trend
📌 How PDH/PDL Help in Intraday Trading
1️⃣ Range Breakout Trades
If price breaks PDH → bullish breakout (Buy CE)
If price breaks PDL → bearish breakdown (Buy PE)
What is Camarilla R3?
R3 = Resistance Level 3 in the Camarilla Pivot system.
Why R3 is important?
Acts as a major intraday resistance
Price often reverses from R3
If broken with force → strong uptrend starts
Many traders use R3 as a decision zone
Typical Market Behavior at R3
Rejection from R3 → Sell/PE opportunity
Break + Retest above R3 → CE opportunity
🔴 What is Camarilla S3?
S3 = Support Level 3 in the Camarilla Pivot system.
Why S3 is important?
Acts as a major intraday support
Buyers defend this zone
Breakdown of S3 → strong fall
S3 is often a bounce zone in the morning
Typical Market Behavior at S3
Bounce from S3 → Buy/CE opportunity
Break + Retest below S3 → PE opportunity
📌 Trader Logic: R3 & S3 Zones
⭐ 1. Range Reversal Strategy (Most Popular)
At R3 → Sell/PE
At S3 → Buy/CE
What is VWAP?
VWAP = Volume Weighted Average Price
It shows the average price at which most trading has happened during the day, based on both price and volume.
It resets every day at market open.
🔥 Why VWAP Is So Powerful?
VWAP is used by:
Institutions
Algo traders
Scalpers
Intraday traders
Dec 10
Release Notes
This script provide the follwing -
1. Daily CPR level
2. Camarilla S3/R3
3. Previous Day High/Low (PDH/PDL)
4. Dynamic VWAP
5. Dynamic EMA 20/200
6. Dynamic RSi Swing
3 hours ago
Release Notes
This script provide the follwing -
1. Daily CPR level
2. Camarilla S3/R3
3. Previous Day High/Low (PDH/PDL)
4. Dynamic VWAP
5. Dynamic EMA 20/200/36
6. Dynamic RSi Swing
Which is better: 36 EMA or 36 SMA for Support/Resistance?
✔ 36 EMA (Exponential Moving Average)
Better for intraday, short-term trading, scalping, and momentum trading.
Why?
Reacts faster to price.
Captures trend shifts early.
Works great when market is trending or volatile.
Most traders use EMA for dynamic support/resistance → works better because of crowd behavior.
Ideal for:
NIFTY, BANKNIFTY, FINNIFTY intraday | Options entries | Trend continuation trades.
Why 20 EMA is Important
The 20 EMA is one of the most widely used moving averages for intraday, swing, and positional trading because it captures short-term trend strength and momentum.
📌 20 EMA Works Best For
✔ Intraday trend identification
✔ Momentum continuation entries
✔ Dynamic support/resistance
✔ Quick reversal detection
✔ Options trading (NIFTY/BNF)
✔ Breakout & pullback trades
EMA 200 – Why It’s Extremely Important
The 200 EMA represents the long-term trend and is respected by:
Institutions
Algo systems
Big traders
Swing traders
Index traders
It acts like a major wall of support or resistance.
💡 What EMA 200 Tells You
✔ Long-term trend direction
Price above 200 EMA → Long-term uptrend
Price below 200 EMA → Long-term downtrend
✔ Strong trend reversal signals
When price crosses the 200 EMA on 15m/1h/1D charts → a deeper trend change is possible.
✔ Institutional support/resistance
Very powerful bounce/rejection zones
Many markets reverse exactly at 200 EMA
What is Previous Day High (PDH)?
The highest price the market reached in the previous trading session.
Why PDH is Important?
Acts as strong resistance
Breakout level for uptrend
Sellers often defend this zone
If broken with volume → strong bullish momentum
🔴 What is Previous Day Low (PDL)?
The lowest price the market reached in the previous trading session.
Why PDL is Important?
Acts as strong support
Breakdown level for downtrend
Buyers defend this level
If broken with volume → strong bearish trend
📌 How PDH/PDL Help in Intraday Trading
1️⃣ Range Breakout Trades
If price breaks PDH → bullish breakout (Buy CE)
If price breaks PDL → bearish breakdown (Buy PE)
What is Camarilla R3?
R3 = Resistance Level 3 in the Camarilla Pivot system.
Why R3 is important?
Acts as a major intraday resistance
Price often reverses from R3
If broken with force → strong uptrend starts
Many traders use R3 as a decision zone
Typical Market Behavior at R3
Rejection from R3 → Sell/PE opportunity
Break + Retest above R3 → CE opportunity
🔴 What is Camarilla S3?
S3 = Support Level 3 in the Camarilla Pivot system.
Why S3 is important?
Acts as a major intraday support
Buyers defend this zone
Breakdown of S3 → strong fall
S3 is often a bounce zone in the morning
Typical Market Behavior at S3
Bounce from S3 → Buy/CE opportunity
Break + Retest below S3 → PE opportunity
📌 Trader Logic: R3 & S3 Zones
⭐ 1. Range Reversal Strategy (Most Popular)
At R3 → Sell/PE
At S3 → Buy/CE
What is VWAP?
VWAP = Volume Weighted Average Price
It shows the average price at which most trading has happened during the day, based on both price and volume.
It resets every day at market open.
🔥 Why VWAP Is So Powerful?
VWAP is used by:
Institutions
Algo traders
Scalpers
Intraday traders

PyraTime FVG [Pro] | Smart Anchored Price ActionPyraTime FVG is a professional-grade institutional trading suite designed to declutter price action analysis. Unlike standard indicators that flood the chart with infinite zones, this tool uses a proprietary "Velcro" Anchoring Engine that physically snaps Fair Value Gaps (FVGs) and Order Blocks to the exact candle geometry.
This tool replaces 4 separate indicators (FVG, Market Structure, Order Blocks, and Trend Dashboard) with a single, performance-optimized Pine Script v6 script.
🎯 Key Features
1. The "Velcro" FVG Engine Most FVG indicators draw boxes that extend infinitely, making charts messy.
Smart Extension: Zones extend to the right but automatically "snap" and cut off the moment price mitigates (fills) them.
Precision Anchoring: Boxes are drawn from the exact wick/body limits of the originating candles—no floating pixels.
Mitigation Tracking: Mitigated zones are instantly dimmed and archived, keeping your chart clean for current price action.
2. Intelligent Structure Mapping (BOS & CHoCH) The script distinguishes between trend continuation and trend reversals:
BOS (Break of Structure): Marked with Dotted Lines. Signals that the current trend is healthy and continuing.
CHoCH (Change of Character): Marked with Solid Lines. Signals a potential major trend reversal (e.g., the first Lower Low after an uptrend).
3. Multi-Timeframe (MTF) Scanner A non-intrusive dashboard in the bottom-right corner scans the 1H, 4H, and Daily timeframes in real-time.
IN BULL GAP: Price is currently inside a Higher Timeframe Buying Zone.
IN BEAR GAP: Price is currently inside a Higher Timeframe Selling Zone.
CLEAR: No major HTF obstacles nearby.
📚 How to Trade With This Tool (Tutorial)
Step 1: Check the "Big Picture" Look at the MTF Scanner (Bottom Right).
If the 1H and 4H say "IN BEAR GAP" (Gold), you know the higher timeframe bias is Down. You should prioritize selling opportunities.
Step 2: Wait for Price to Visit a Zone On your current chart (e.g., 5m or 15m), wait for price to enter a Gold FVG (Resistance).
Note: The box will be bright gold. Once price touches it, the script will snap the box to that candle, confirming the test.
Step 3: Confirm with Structure Don't sell blindly. Wait for a CHoCH Label (Change of Character) to appear. This confirms that the short-term uptrend has broken and sellers are stepping in.
Step 4: Target the Opposing Zone Aim for the next unmitigated Teal FVG (Bullish Support) or Order Block below.
⚙️ Settings & Customization
Filter Small Gaps: Uses an ATR filter (default 0.5) to ignore insignificant noise. Increase to 1.0 for a cleaner "Swings Only" view.
Show Midpoint: Toggles a dotted 50% equilibrium line inside every active gap.
Visual Style: Fully customizable colors. Default scheme is PyraTime Desert Gold & Oasis Teal.

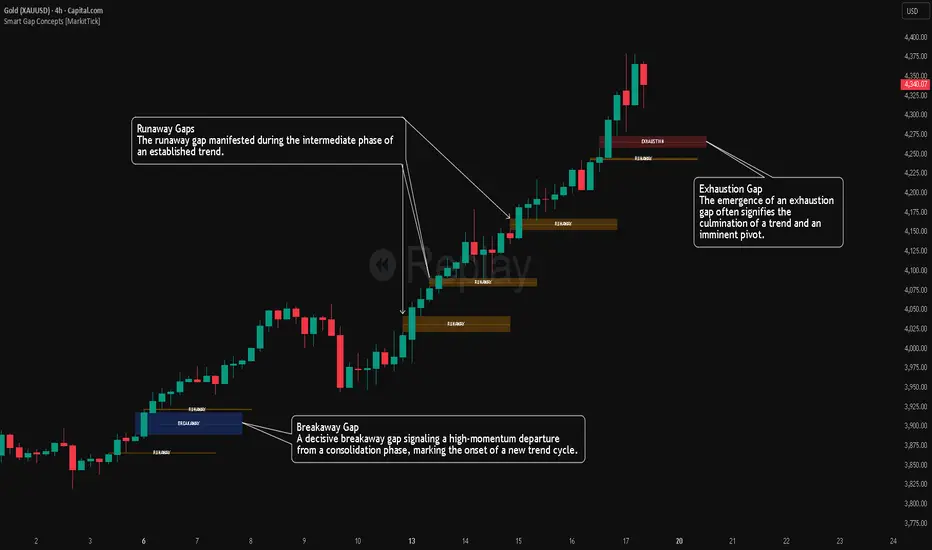
Smart Gap Concepts [MarkitTick]💡 This indicator automates the identification and classification of price gaps, commonly known as Fair Value Gaps (FVG) or Imbalances, by integrating market structure and volume analysis. Unlike standard gap detectors that simply highlight empty space on a chart, this script applies algorithmic filters to categorize gaps into three distinct phases of market movement: Breakaway, Runaway, and Exhaustion. This helps traders understand the potential context of a move rather than just seeing a support or resistance zone.
● Originality and Utility
The primary innovation of this tool is its dynamic classification system. It moves beyond visual detection by checking the "why" behind the gap. By referencing Swing Highs and Swing Lows (Market Structure) alongside Volume efficiency, it determines if a gap represents a breakout, a trend continuation, or a climatic end to a move. Additionally, the script features an automated mitigation tracking system that removes gaps from the chart once price has re-tested the midpoint, ensuring the visual workspace remains clean and relevant to current price action.
● Methodology
The script operates on a multi-stage logic engine:
• Gap Detection
It first identifies the core imbalance where the Low of the current bar does not overlap with the High of the bar two periods prior (for bullish gaps), ensuring the intervening candle represents a strong displacement.
• Structural Analysis (Breakaway Gaps)
The script monitors Pivot Highs and Lows. If a gap occurs simultaneously with a close beyond a key structural Pivot, it is classified as a "Breakaway Gap." This signals the potential start of a new trend.
• Volume and Time Analysis (Exhaustion Gaps)
To identify potential reversals, the script looks for "Trend Maturity." If a gap forms after a long duration since the last pivot and is accompanied by a volume spike (defined by the Volume Spike Multiplier), it is labeled as an "Exhaustion Gap."
• Continuation (Runaway Gaps)
If a gap is valid but meets neither the Breakaway nor Exhaustion criteria, it is considered a "Runaway Gap," typically found in the middle of an established trend.
• Dynamic Cleanup
The script tracks the midpoint of every active gap. If price creates a lower low (for bullish gaps) or higher high (for bearish gaps) beyond this midpoint, the gap is considered mitigated and is removed from the screen.
📖 How to Use
Traders can utilize the color-coded classifications to gauge market intent:
Breakaway (Default Blue): Watch these zones for potential trend initiations. These are often high-probability areas for a retest entry after a structure break.
Runaway (Default Orange): These indicate strong momentum. They can be used to trail stop-losses or add to winning positions, as price should ideally not close below these gaps in a healthy trend.
Exhaustion (Default Red): Be cautious when these appear. They suggest the current move is overextended and a reversal or complex pullback may be imminent.
• Exhaustion Gap : A Practical Case Study
• Breakaway Gap: A Practical Case Study
• Runaway Gap : A Practical Case Study
⚙️ Inputs and Settings
Min Gap Size (Points): Filters out insignificant gaps smaller than this threshold.
Structure Lookback: Defines the sensitivity of the Pivot detection (Swing High/Low).
Volume Avg Length & Multiplier: Determines what qualifies as a "Volume Spike" for exhaustion logic.
Trend Maturity: The minimum number of bars required to consider a trend "old" enough for an exhaustion signal.
Visual Settings: Custom colors for each gap type and box extension length.
● Disclaimer
All provided scripts and indicators are strictly for educational exploration and must not be interpreted as financial advice or a recommendation to execute trades. I expressly disclaim all liability for any financial losses or damages that may result, directly or indirectly, from the reliance on or application of these tools. Market participation carries inherent risk where past performance never guarantees future returns, leaving all investment decisions and due diligence solely at your own discretion.
Market Participation Gradient [Interakktive]Market Participation Gradient (MPG) is a diagnostic oscillator that measures the quality and intensity of market participation by combining price efficiency with activity (volume or a FX-safe proxy) into a single 0–100 score.
Most tools tell you "how much activity exists." MPG focuses on "how effective that activity is," helping you differentiate clean directional participation from absorbed / inefficient participation where effort produces limited directional progress.
█ WHAT IT DOES
- Produces a 0–100 participation score (higher = stronger participation environment)
- Uses color as state context (not buy/sell)
- Classifies participation into four tiers for quick readability
- Includes an optional status-line HUD for at-a-glance context without chart clutter
█ WHAT IT DOES NOT DO
- NO buy/sell signals
- NO entries/exits
- NO alerts by default
- NO repainting / no lookahead (diagnostic context only)
█ HOW TO READ MPG
Level (0–100)
- Higher values = stronger participation environment
- Lower values = thin, drifting participation environment
Color (state language, not direction)
- Teal = Clean participation (efficient movement)
- Magenta = Absorbed participation (high activity, low efficiency)
- Amber = Building / transition state
- Grey = Thin / neutral state
█ TIER SYSTEM
MPG uses four tiers:
- THIN (0–20): low participation environment
- BUILDING (20–40): participation emerging / transitional
- STRONG (40–65): solid participation environment (quality becomes more meaningful)
- EXTREME (65+): very high participation environment (contextually important during events or late-cycle pushes)
█ QUALITY ASSESSMENT (STRONG / EXTREME)
Within STRONG and EXTREME tiers, MPG evaluates participation quality:
- Clean (Teal): Efficiency > 55%
- Absorbed (Magenta): Efficiency < 30% AND Activity > 1.5×
- Neutral (Grey): otherwise (mixed quality)
█ STATUS LINE HUD
MPG can display key values in TradingView's status line:
- Minimal: MPG (0–100) + Tier (0–3)
- Full: adds Direction (-1/0/1) and Quality (-1/0/1)
This provides quick context without tables or on-chart panels.
█ HOW IT WORKS (METHODOLOGY)
MPG combines two independent measurements:
1. Efficiency (0–1)
Efficiency = |Net Displacement| / Total Path Length
- High efficiency = price moved more directly
- Low efficiency = price moved less directly (more back-and-forth)
2. Activity (centered at 1.0)
Activity = Current Volume / Average Volume
- Activity > 1 = above-average activity
- Activity < 1 = below-average activity
FX / indices fallback: If volume is unreliable/unavailable, MPG uses a range-based proxy: (High–Low) / ATR (capped) to prevent distortion.
3. Participation Score (0–100)
Participation = Efficiency × √Activity × 100
The square root applies diminishing returns so activity alone cannot dominate without efficiency support.
█ SETTINGS
Core
- ATR Length — normalization baseline
- Efficiency Lookback — bars used for efficiency
- Volume Average Length — baseline for activity
- Smoothing Length — EMA smoothing (1 = minimal smoothing)
Visuals
- Histogram / Line / Tier Bands toggles
- Optional pane background tint (default OFF)
- Theme: Cinematic (subtle) or Vivid (brighter)
HUD
- Status Line HUD toggle
- HUD Detail: Minimal or Full
█ SUITABLE MARKETS
Works on any market with price data. For symbols with unreliable volume (common in FX), MPG automatically uses the range/ATR activity proxy.
█ RELATED (INTERAKKTIVE)
- MER — Market Efficiency Ratio (pure efficiency)
- ERD — Effort–Result Divergence (effort vs outcome)
- VSI — Volatility State Index (expansion/contraction context)
█ DISCLAIMER
This indicator is for educational and informational purposes only and does not constitute financial advice. Always do your own research and use appropriate risk management.

GEMINI Advanced SMA with Trend & AlertsDescription:
This indicator is a professional Trend & Signal analysis tool designed to help traders identify market direction, entries, and momentum strength at a glance. It combines a customizable dual Moving Average system with an advanced real-time Information Dashboard.
The script is built to keep charts clean while providing maximum data through the on-screen panel.
📈 Key Features
1. Dual Moving Average System
Fast MA (Signal Line): Acts as the primary trigger for entries.
Slow MA (Trend Baseline): Filters the overall market direction.
Visual Cloud: The area between the two MAs is filled with color (Green/Red) to visualize the trend strength and potential support/resistance zones.
Flexibility: You can choose between SMA, EMA, HMA, WMA, or RMA for both lines independently.
2. Professional Data Dashboard A customizable table positioned on your chart provides real-time analytics:
Price Action: Immediate Bullish/Bearish status.
MA Status: Shows if the Fast and Slow MAs are currently Rising or Falling.
Exact Levels: Displays the precise price values of the MAs.
Spread Analysis: Monitors the gap between the Fast and Slow MA ("Expanding" vs "Squeezing") to help identify momentum acceleration or exhaustion.
3. Signals & Alerts
BUY Signal: Generated when the Price crosses OVER the Fast MA.
SELL Signal: Generated when the Price crosses UNDER the Fast MA.
Alerts: Fully compatible with TradingView alerts for automation.
4. Multi-Timeframe (MTF) Support You can calculate the Moving Averages based on a higher timeframe (e.g., viewing 4-hour MAs while trading on a 15-minute chart) to stay aligned with the macro trend.
🛠 How to Use
Trend Identification: Look at the "Cloud" color. Green indicates an uptrend context; Red indicates a downtrend context.
Entry Points: Use the "BUY" and "SELL" labels.
Pro Tip: Take BUY signals only when the Cloud is Green (trading with the trend).
Pro Tip: Take SELL signals only when the Cloud is Red.
Momentum Check: Use the Dashboard to see if the Spread is "EXPANDING" (strong momentum) or "SQUEEZING" (potential consolidation or reversal).
⚙️ Settings
Fast/Slow Length & Type: Fully customizable periods and MA types.
MTF: Enable/Disable higher timeframe calculations.
Dashboard: You can toggle the table visibility, change its size (Tiny, Small, Normal, Large), and move it to any corner of the screen.
Disclaimer: This tool is for informational purposes only and does not constitute financial advice.

VSA Persistent Zones with Arrows Purpose
This indicator is designed to analyze trading volume relative to price movement using the VSA (Volume Spread Analysis) methodology. It aims to:
Identify key price zones where there is strong price movement with high trading volume.
Plot arrows on high-volume candles for quick visual identification.
Keep these zones persistent until broken by price, helping traders make decisions based on real support and resistance levels.


Portfolio P&L Table 10 SlotsOverview
This indicator displays a compact, Excel-style position P&L table directly on your TradingView chart. It is designed to help traders track unrealized profit/loss for a manually-entered position and ensure the calculations only apply to the symbols you actually trade, preventing confusion when switching between tickers.
The script is symbol-aware: it checks the current chart symbol against up to 10 user-defined position slots and shows P&L only when a match is found.
Core Concept
Most P&L scripts on TradingView rely on a single set of inputs (average price, quantity), which remains active even when the user changes chart symbols. That can lead to incorrect P&L displays on instruments where no position exists.
This indicator solves that by combining:
Symbol matching logic (ticker / exchange:ticker / base ticker normalization)
Slot-based position storage (up to 10 positions)
Dynamic real-time P&L calculations driven by the chart’s live price
As a result, the table behaves like a “position panel” that follows the chart, while respecting your actual holdings list.
Matching & Display Logic
Symbol Detection
The indicator compares the current chart symbol to each slot’s symbol using multiple matching methods to reduce false mismatches:
Full symbol (EXCHANGE:TICKER)
Ticker only (TICKER)
Normalized “base ticker” extraction (useful when your chart format differs from inputs)
Position Selection
The first matching slot is selected and displayed.
If no slot matches, the table shows “No position for this symbol” and does not output P&L values.
P&L Calculation Logic
When a valid slot is matched and its values are valid:
Unrealized Gross P&L
Long: (Last Price − Avg Price) × Quantity
Short: (Avg Price − Last Price) × Quantity (handled via direction multiplier)
Unrealized Net P&L (optional)
If fees are enabled, the script subtracts the slot’s total fees from gross P&L.
P&L %
Calculated relative to average price, direction-adjusted for long/short positions.
Breakeven Price
Without fees: breakeven = average price
With fees: breakeven is adjusted using fees / quantity and direction.
The table updates automatically with market movement because all values are recalculated from the chart’s current price.
Inputs and Defaults
General
Include Fees? (default: Off)
Text Size
Table Position (Top/Bottom, Left/Right)
Slots (1 → 10)
Each slot contains:
Symbol (example formats: NVTS, NASDAQ:NVTS, NYSE:PATH)
Side (Long / Short)
Average Price
Quantity
Total Fees (optional; applied only when “Include Fees” is enabled)
Colors (Fully Customizable)
The table supports user-defined colors for:
Header text/background
Body text/background
Positive P&L color
Negative P&L color
Neutral/no-position color
This allows you to match the table visually to any chart theme.
The indicator is intended for :
Quick P&L visibility while charting
Avoiding accidental P&L “carry over” when switching symbols
Tracking a shortlist of positions without external spreadsheets
If you trade more than 10 tickers regularly, the script can be extended further using the same slot architecture.
Limitations
Values are unrealized and based on the chart’s price (close/last available feed).
The script does not track multiple lots per symbol automatically; each slot represents a single consolidated position (avg + total qty).
Disclaimer
This script is provided for educational and analytical purposes only. It does not constitute financial advice, investment recommendations, or an invitation to trade. Trading involves risk, and past performance does not guarantee future results. Always verify your position data and calculations independently before making trading decisions.
