ChoCh Pattern with Trading Levels + Candlestick PatternsBuilt for smart money traders and market structure enthusiasts, the ChoCh Pattern indicator identifies powerful Change of Character reversals with precision. Features intelligent swing point detection, automated risk-reward level plotting, and comprehensive performance tracking to optimize your trading edge in any market condition.
Smart Money Structure Detection - Identifies bullish and bearish Change of Character patterns based market structure analysis and Candlestick patterns Detection,Eliot Waves with T levels
Automated Entry & Exit Levels - Generates entry points with 4 customizable take-profit targets (TP1-TP4) and stop-loss placement based
Real-Time Performance Dashboard - Tracks hit rates for all TP levels, stop-loss statistics, and cumulative P&L across all signals
Visual Trade Management - Clear buy/sell arrows, color-coded level lines, and dynamic price labels for effortless trade execution
Traders seeking systematic risk management with multiple profit targets
Indicadores y estrategias

Price By Time - Momentum Flow : Pretty Edition - Aurora BorealisThe Price By Time: Momentum Flow indicator provides a visual representation of market momentum using a colored glow around the price line.
Teal-Green indicates upward (bullish) momentum,
Violet indicates downward (bearish) momentum,
and Pale Blue represents neutral or weak momentum.
The brightness of the glow reflects trend strength, with brighter glows indicating stronger momentum and a likely trend continuation, while fading glows suggest weakening momentum or a potential reversal. Changes in color serve as visual cues for possible trend shifts.
Traders can use this indicator to confirm trend direction, identify optimal entry and exit points, and anticipate changes in momentum, ideally in combination with other technical tools such as support/resistance levels, RSI, or MACD for more robust analysis.

Dragon Flow Arrows (LITE)🚀 DRAGON FLOW ARROWS | Smart Trend Engine + Clean Reversal Arrows
A lightweight but highly-optimized trend system designed for clean charts, powerful visual signals, and no-noise directional flow. Built for traders who want simplicity, clarity, and professional-level momentum-filtered signals without over-complication.
🔥 Dragon Channel (Clean 3-Line Ribbon)
A smooth adaptive channel formed from ATR + EMA, giving you structural trend zones without clutter.
✅ Dragon Flow Gradient
A horizontal, color-shifted flow:
🟢 Bull flow → green glow
🔴 Bear flow → red glow
Automatic blend based on trend direction
Smooth visual transitions (no vertical stripes)
✅ Momentum-Filtered Arrows
BUY/SELL arrows only print when:
Price breaks outside the Dragon Channel
Momentum confirms (RSI + MACD filters)
Trend flips → one clean arrow per direction
✅ Smart Header Panel
At the top of your chart:
📌 Trend: Uptrend / Downtrend / Neutral
⚡ Impulse Strength: Weak / Normal / Strong
📊 How to Use
Entry:
- BUY Setup
Price moving above baseline
Dragon Flow turns bullish (cyan side)
Arrow appears below channel
- SELL Setup
Price breaks below baseline
Dragon Flow turns bearish (magenta side)
Arrow pops above channel
Exit / Filter:
Opposite arrow
Flow color shift
Trend panel flips
Works on Forex, Crypto, Stocks, Indices — all timeframes (just adjust the channel length).
Happy trading!

Trade Secrets by Pratik - Dual Intraday StrategyThe "Trade Secrets by Pratik" strategy is a high-momentum, dual-direction trading system designed to capture explosive moves after brief market pullbacks. It relies on a rigorous combination of trend-following moving averages and a strength filter.
1. Core Concept
The strategy identifies "Clean Pullbacks"—brief pauses in a strong trend where the price stays strictly away from the short-term average (10 EMA). This indicates extreme momentum, as buyers (in an uptrend) or sellers (in a downtrend) are too aggressive to allow a deeper correction.
2. Technical Filters
Trend Direction: Price must be above both 10 and 35 EMAs for Buys, and below both for Sells.
Strength Filter (RSI): Requires an RSI > 60 for Longs (to ensure high demand) and RSI < 40 for Shorts (to ensure heavy selling pressure).
3. Trade Execution
The Setup: Look for a "Floating Candle"—a Red candle for Buys or a Green candle for Sells that does not touch the 10 EMA.
The Trigger: A trade is entered only if the very next candle breaks the "Setup Candle's" high (Buy) or low (Sell).
Risk-Reward: Aim for a fixed 1:3 Ratio, ensuring that one winner covers three losing trades.
4. Safety Logic
The system includes a "No-Same-Candle-Exit" rule, preventing the script from triggering a Stop Loss on the same bar as the Entry. This filters out immediate price "whipsaws" and ensures the trade has room to develop.

DDDDD : EMA Pack (Matched Colors + MTF)📌 DDDDD : EMA Pack (Matched Colors + MTF)
🔹 Concept
DDDDD : EMA Pack is a clean and minimal Exponential Moving Average (EMA) overlay designed for trend structure analysis and multi-timeframe context.
This indicator focuses on visual clarity, consistent color mapping, and optional MTF EMA projection, allowing traders to read market structure without clutter or signal noise.
It is not an entry or signal generator, but a trend and regime visualization tool.
🔹 Logic
The script plots a fixed set of EMAs commonly used to define short-term momentum, intermediate trend, and long-term bias:
EMA 5
EMA 10
EMA 25
EMA 50
EMA 75
EMA 200
Each EMA is calculated using the standard exponential moving average formula.
If a higher timeframe is selected, the EMA is calculated on that timeframe and projected onto the current chart using request.security().
🔹 Methodology
Users may select:
Source price (default: close)
EMA timeframe
Empty = current chart timeframe
Any higher timeframe = true MTF EMA projection
All EMA colors are manually matched and fixed to maintain visual consistency across markets and timeframes.
Line thickness is kept uniform to avoid visual hierarchy bias.
This design ensures the indicator remains purely structural, without repainting logic, smoothing tricks, or adaptive parameters.
🔹 How to Use
Use EMA alignment and spacing to assess:
Trend direction
Trend strength
Compression vs expansion
Higher-timeframe EMA projection can be used as:
Dynamic support/resistance
Trend filter
Regime context for lower-timeframe execution
This indicator works best when combined with:
Price action
Market structure
Separate entry/exit logic of your own system
⚠️ This indicator does not provide buy/sell signals and should not be used alone for trade execution.
🔹 Notes
No repainting beyond standard MTF behavior
No performance or profitability claims
Designed for discretionary and systematic traders
Suitable for stocks, crypto, forex, and indices

ATR 0.5x & 1x Distance (Horizontal)What this version does (no ambiguity)
Plots true horizontal dashed lines
One at ±0.5 × ATR
One at ±1.0 × ATR
Lines extend to the right (proper levels, not floating spaghetti)
ATR is calculated from the active chart timeframe
30m chart → 30m ATR
1H chart → 1H ATR
Clean, stable, no repainting tricks
Important detail (this matters for your strategy)
The lines are anchored to a reference price, which is currently configurable:
Default: close
You can change it to:
VAH
VAL
POC
Any plotted level
This is exactly what you want for:
“How far beyond value has price gone in ATR terms?”
How you’ll likely use this in practice
For your mean-reversion framework:
Anchor Reference Price = VAH or VAL
Treat:
0.5× ATR → probabilistic rejection zone
1.0× ATR → acceptance / thesis failure
No more eyeballing. No more dragging stops because “the candle looked angry.”

RBR / DBR / RBD / DBD Pattern IdentifierThis strategy identifies price-action based continuation and reversal structures using the Rally–Base–Rally (RBR), Drop–Base–Rally (DBR), Rally–Base–Drop (RBD), and Drop–Base–Drop (DBD) patterns.
The logic is based on institutional price behavior, where strong impulsive moves are followed by a low-volatility base (consolidation) and then a confirmation move in the direction of continuation or reversal.
Strong candles represent aggressive participation (demand or supply).
Base candles represent absorption, order balancing, and accumulation/distribution.
Breakout candle confirms intent and directional bias.
Pattern Interpretation
RBR: Bullish continuation after consolidation
DBR: Bullish reversal after selling pressure
RBD: Bearish reversal after buying pressure
DBD: Bearish continuation after consolidation
Usage Guidelines
Best used in alignment with higher-timeframe trend and key supply/demand zones.
Suitable for intraday, swing, and positional trading, with timeframe-specific tuning.
Intended as a structure identification tool, not a standalone trading system.
Risk management, trend context, and confluence with other tools are essential before taking trades.

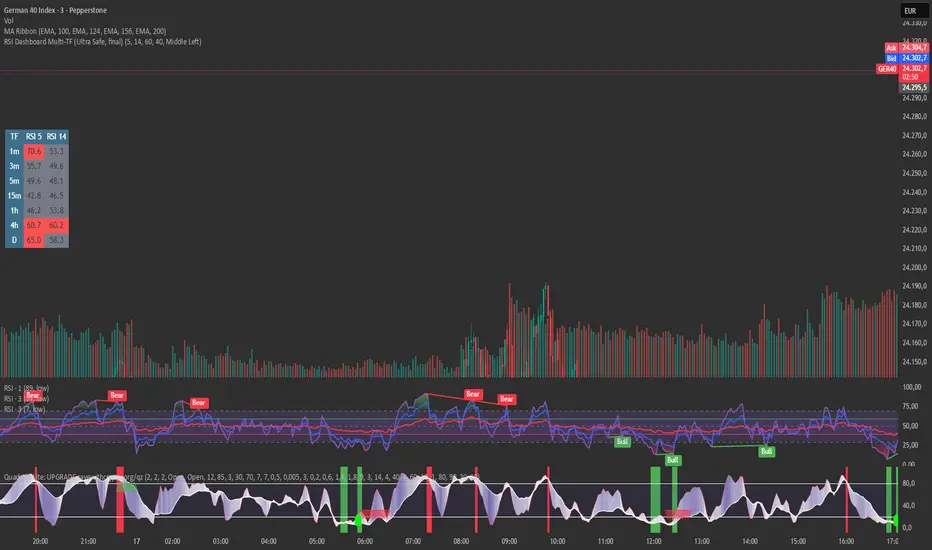
RSI Dashboard Multi-TF This script displays RSI values from multiple timeframes in a compact dashboard directly on the chart.
It is designed for traders who want to quickly identify whether the market is overbought, oversold, or neutral across different timeframes, without constantly switching chart intervals.
The dashboard shows the RSI simultaneously for the following timeframes:
- 1 minute
- 3 minutes
- 5 minutes
- 15 minutes
- 1 hour
- 4 hours
- Daily
Typical use cases:
- Scalping & intraday trading
- Multi-timeframe analysis at a glance
- Entry confirmation (e.g. pullbacks, breakouts)
- Avoiding trades against overbought or oversold market conditions
- Complementing EMA, VWAP, or price action strategies
⚙️ Notes
This dashboard is an analysis tool, not an automated trading system.
No repainting (uses request.security).
Suitable for indices, forex, crypto, and commodities.
This RSI dashboard provides a fast, clear, and visually clean market overview across multiple timeframes, making it an ideal tool for active traders who want to make efficient and well-structured trading decisions.
Delta Volume Bubble [Quant Z-Score] by tncylyvDelta/Volume Bubble by tncylyv
This indicator is a quantitative order flow tool designed to visualize statistically significant volume and delta anomalies directly on the price chart. By moving away from raw, noisy volume numbers and utilizing Z-Score (Standard Score) statistics, this tool adapts to changing market volatility to highlight areas of heavy institutional interest or exhaustion.
It combines statistical analysis with Price Action concepts (Effort vs. Result) to detect "Absorption"—market conditions where high volume occurs with very little price movement.
1. Core Concepts & Methodology
A. Adaptive Z-Score (The "Quant" Logic)
Raw volume data is often difficult to interpret because volume fluctuates wildly between sessions (e.g., the Asian session typically has lower volume than the New York Open).
Instead of using a fixed volume threshold (e.g., "Alert me if volume > 1000"), this script calculates the Z-Score.
It measures how many Standard Deviations (
σ
) the current volume is from the historical average.
Significance: A Z-Score of +2.0 or higher puts the current candle in the top 5% of statistical occurrences, filtering out noise and highlighting true anomalies.
B. Absorption Detection (Effort vs. Result)
This feature identifies "Trapped Traders."
The Logic: If the Z-Score indicates extremely high volume (High Effort), but the price candle has a very small body (Low Result), it implies that aggressive market orders are being absorbed by passive limit orders.
Visual: These specific anomalies can be highlighted with a unique halo effect, signaling a potential reversal or stop-hunt area.
C. Intra-Bar True VWAP (Smart Placement)
Standard indicators usually plot symbols at the High, Low, or Close of a candle.
This script utilizes request.security_lower_tf to analyze the Lower Timeframe (LTF) structure of the specific bar.
It calculates the exact Volume Weighted Average Price (VWAP) of that single candle.
Benefit: The bubble is drawn exactly where the heaviest volume occurred inside the candle, providing a more accurate level for future Support/Resistance tests.
2. Key Features
Dual Data Modes: Switch seamlessly between Volume Delta (Buying vs. Selling pressure) or standard Total Volume.
Dynamic Sizing: Bubble sizes (Small, Medium, Large) scale automatically based on the intensity of the Z-Score.
Absorption Logic: Automatically flags candles where volume is high but price progression is stalled.
Adaptive Visuals: Colors and opacity can fade dynamically based on the strength of the signal, or remain solid based on user preference.
Alert System: Fully configurable alerts for Z-Score breakouts and Absorption detection.
3. How to Use
This tool is best used to identify Reversals and Breakout Validation.
Trend Exhaustion (Climax):
If price is trending up and a large "Bullish" bubble appears at the highs with a long upper wick or small body (Absorption), it may indicate buying exhaustion and passive selling.
Breakout Confirmation:
If price breaks a key support/resistance level accompanied by a Large Bubble (High Z-Score), it confirms institutional backing for the move.
Support/Resistance Defense:
The "True VWAP" location of the bubble often acts as a re-test level. If price retraces to the center of a previous large bubble, observe for a reaction.
4. Settings Guide
Data Settings
Calculation Source: Choose between Volume Delta (Up/Down tick analysis) or Regular Volume.
Lower TF Granularity: The timeframe used to calculate the specific "True VWAP" location inside the bar (e.g., 1S or 1M).
Statistical Lookback: The number of bars used to calculate the baseline Average and Standard Deviation (Default: 60).
Quant Logic
Calculation Mode:
Adaptive (Z-Score): Triggers based on relative statistical anomalies (Recommended).
Fixed: Triggers based on raw volume numbers.
Z-Score Threshold: The sensitivity level. 2.0 is standard; higher values (e.g., 3.0) will show fewer, more extreme signals.
Absorption Logic
Detect Absorption: Enables the calculation for small-bodied high-volume candles.
Absorption Ratio: Defines how "small" the body must be relative to the average to qualify as absorption (0.1 to 1.0).
Visuals
Theme: Switch between Dark (Mint/Coral) and Light (Royal/Sunset) themes.
Scale Size: If enabled, bubbles grow larger as the Z-Score increases.
Glow Effect: Adds a neon glow for better visibility on dark backgrounds.
________________________________________
Risk Disclaimer:
This indicator is for informational and educational purposes only. Volume and Delta analysis are subjective interpretation methods. Past performance, or statistical anomalies shown by this script, do not guarantee future results. Always manage your risk appropriately.

MATRIX AI Trading SystemMATRIX AI Trading System - Complete Trading Guidelines
Core Trading Strategy
Primary Entry Signals (Must Have)
BUY/SELL Arrow Signals - Your main entry trigger
Wait for the green "BUY" arrow (upward triangle) below the candle
Wait for the red "SELL" arrow (downward triangle) above the candle
These are generated by the MATRIX indicator when momentum shifts
AI Score Confirmation
Check the dashboard on the right side
LONG SCORE should be 55+ (preferably 70+) for buy entries
SHORT SCORE should be 55+ (preferably 70+) for sell entries
Green = Strong signal, Yellow/Orange = Moderate, Red = Weak
3-4 Key Confirmations (Use At Least 3)
Confirmation 1: Bollinger Bands (BB) Smooth Area
Best Entry Zones:
For BUY: Price touches or bounces from the lower BB band (blue line at bottom)
For SELL: Price touches or bounces from the upper BB band (blue line at top)
BB Status on Dashboard: Look for "Squeeze" followed by "Expansion" - this indicates volatility breakout
Avoid trading when: Price is in the middle of BB bands with "Normal" status
What to Look For:
Price rejection wicks at BB bands
Candle closes back inside the bands after touching outer band
BB width increasing (expansion phase)
Confirmation 2: RSI Divergence
Check Dashboard Row 9 (RSI):
Bullish Divergence: Look for "Bull Div" label on chart (green label near lows)
Price makes lower low, but RSI makes higher low
Strong reversal signal for BUY trades
Bearish Divergence: Look for "Bear Div" label on chart (red label near highs)
Price makes higher high, but RSI makes lower high
Strong reversal signal for SELL trades
Dashboard Signals:
RSI value shows in green when bullish (<30 zone)
RSI value shows in red when bearish (>70 zone)
"Bull Div" or "Bear Div" text appears in rightmost column
Confirmation 3: Fibonacci Golden Pocket
The Sweet Spot (0.618 - 0.786 retracement):
Yellow shaded zone between two orange lines
Dashboard Row 15 shows: "Inside" or "Outside"
Trading Rules:
BUY Setup: Price pulls back INTO golden pocket, then BUY arrow appears
SELL Setup: Price rallies INTO golden pocket from below, then SELL arrow appears
Best Entries: When price is "Inside" golden pocket + BUY/SELL arrow appears
Trend Continuation: Golden pocket acts as support in uptrends, resistance in downtrends
Confirmation 4: Support & Resistance
Check Dashboard Rows 16-17:
Support Level: Green horizontal line below price
Resistance Level: Red horizontal line above price
Dashboard shows "Near" or "Away"
Trading Rules:
BUY Priority: When dashboard shows "Near" support + BUY arrow
SELL Priority: When dashboard shows "Near" resistance + SELL arrow
Strongest Signals: Multiple touches of S/R level + rejection candles
Wait for confirmation: Don't trade until price clearly respects the level
Additional Power Confirmations
Confirmation 5: Fair Value Gap (FVG)
Visual Identification:
Green semi-transparent boxes = Bullish FVG (price gap up)
Red semi-transparent boxes = Bearish FVG (price gap down)
Small dotted line in the middle of each FVG zone
"FVG" label marks each gap
Trading Strategy:
BUY Setup: Price returns to fill bullish FVG (green box) + BUY arrow
SELL Setup: Price returns to fill bearish FVG (red box) + SELL arrow
Dashboard Row 14: Shows "FVG Up" or "FVG Dn"
FVG zones act as magnets - price often returns to fill them
Confirmation 6: CHoCH (Change of Character)
Structure Break Signals:
Green "CHoCH" label below candle = Bullish structure change
Red "CHoCH" label above candle = Bearish structure change
What It Means:
Market structure has shifted direction
Previous trend is weakening
Potential reversal or new trend beginning
Trading Application:
CHoCH + BUY arrow = Strong bullish reversal setup
CHoCH + SELL arrow = Strong bearish reversal setup
Look for CHoCH near support/resistance for highest probability
Complete Trade Setup Examples
PERFECT BUY SETUP (Use 3-4 Confirmations)
✅ BUY Arrow appears below candle (primary signal)
✅ LONG SCORE 70+ on dashboard (AI confirmation)
✅ Price at lower BB band or bouncing from it (BB confirmation)
✅ "Bull Div" label appears or RSI bullish (divergence confirmation)
✅ "Inside" golden pocket or near 0.618 Fib (Fibonacci confirmation)
✅ "Near" support on dashboard (S/R confirmation)
✅ Bullish FVG zone below or CHoCH green label (SMC confirmation)
Minimum Required: BUY Arrow + 3 of the above confirmations
PERFECT SELL SETUP (Use 3-4 Confirmations)
✅ SELL Arrow appears above candle (primary signal)
✅ SHORT SCORE 70+ on dashboard (AI confirmation)
✅ Price at upper BB band or rejecting from it (BB confirmation)
✅ "Bear Div" label appears or RSI bearish (divergence confirmation)
✅ "Inside" golden pocket or near 0.786 Fib (Fibonacci confirmation)
✅ "Near" resistance on dashboard (S/R confirmation)
✅ Bearish FVG zone above or CHoCH red label (SMC confirmation)
Minimum Required: SELL Arrow + 3 of the above confirmations
Trade Management
Entry Rules:
Wait for confirmation: Arrow + AI Score + minimum 3 confirmations
Best entries: 4+ confirmations aligned = highest probability
Avoid: Trading with only 1-2 confirmations (low probability)
Stop Loss (Automatic on Chart):
Red horizontal line shows your SL level
Based on recent swing high/low (20 periods)
Dashboard shows risk in pips
Take Profit Levels (Automatic on Chart):
TP1 (1:1 R:R): Green dashed line - First profit target
TP2 (2:1 R:R): Green dashed line - Second profit target
TP3 (4:1 R:R): Green solid line - Final profit target
Labels show exact prices, pips, and percentage gains
Position Sizing Strategy:
Close 50% at TP1 (secure profits)
Close 30% at TP2 (let winners run)
Close 20% at TP3 or trail stop (maximum gains)
Dashboard Quick Reference
Top Priority Rows to Check:
Row 1: LONG SCORE (need 55+, prefer 70+)
Row 2: SHORT SCORE (need 55+, prefer 70+)
Row 3-6: TP Hit Rate statistics
Row 8: Trend direction
Row 9: RSI + Divergence status
Row 12: BB status (Squeeze/Expansion/Normal)
Row 14: SMC status (OB/FVG indicators)
Row 15: Fib golden pocket (Inside/Outside)
Row 16-17: S/R proximity (Near/Away)
Row 20: Active trade status
Trading Psychology & Rules
High Probability Setups (Take These):
BUY/SELL arrow + AI Score 70+ + 4 confirmations = STRONG ENTRY
Multiple confluences at same price level = HIGH PROBABILITY
Trend direction + all indicators aligned = BEST TRADES
Low Probability Setups (Skip These):
Arrow appears but AI Score below 45 = WEAK SIGNAL
Only 1-2 confirmations = LOW PROBABILITY
Conflicting signals (bullish and bearish indicators mixed) = STAY OUT
"Sideways" trend + mixed signals = NO TRADE
Golden Rules:
Never trade without the BUY/SELL arrow
Always check AI Score first (must be 55+)
Wait for minimum 3 confirmations
Respect the automatic TP/SL levels
Check TP Hit Rate on dashboard (Row 3-6)
Trade with the trend (Row 8 on dashboard)
Quick Decision Flowchart
STEP 1: Did BUY/SELL arrow appear? → NO = Don't trade / YES = Continue
STEP 2: Is AI Score 55+? → NO = Skip trade / YES = Continue
STEP 3: Count your confirmations:
BB position (at bands?)
RSI Divergence (Bull/Bear Div label?)
Golden Pocket (Inside/Outside?)
S/R Proximity (Near support/resistance?)
FVG zone (price near gap?)
CHoCH label (structure break?)
STEP 4: Do you have 3+ confirmations? → NO = Wait / YES = ENTER TRADE
STEP 5: Set position size and follow automatic TP/SL levels
Success Tips
✅ Patience is key - Wait for all confirmations to align
✅ Quality over quantity - 2-3 high-probability trades better than 10 weak ones
✅ Trust the system - The AI calculates 11 different indicators
✅ Follow TP/SL strictly - They're calculated for optimal risk:reward
✅ Review dashboard - Check TP Hit Rate to see system performance
✅ Trade sessions - Best results during high volume trading hours
✅ Avoid news events - Major economic releases create unpredictable volatility

StratyPro Signal + ExitStratyPro Signal + Exit — Description
StratyPro is an intraday market-flow framework built around liquidity behavior, session timing and structural shifts. Instead of combining public indicators, StratyPro uses its own unified engine that monitors:
• Accumulation ranges formed during the early session
• Liquidity events when price reaches key levels and rejects
• Structural shifts based on pivot swings
• Momentum confirmation after structural breaks
• Higher-timeframe inefficiency zones (price speed / imbalance areas)
• Session-specific conditions for Core Session and Expansion Session
The objective is to provide a logical roadmap of how price transitions from accumulation → manipulation → expansion during the trading day.
--------------------------------------------------------------------
1. Session Framework
StratyPro operates using three phases:
1. Asia Accumulation Phase
- Builds the core accumulation range
- Builds an extended reference range used later by the Expansion Session
2. Pre-Core Phase
- Tracks a local intraday range before the main session
- Detects liquidity taps or sweeps of this range
3. Core Session (London)
- Primary signal window where the engine evaluates directional intent
4. Expansion Session (New York)
- Secondary session logic for continuation or reversal during the afternoon
--------------------------------------------------------------------
2. Liquidity Events and Key Levels
StartyPro identifies multiple types of liquidity behavior:
• Sweeps of the Asia accumulation range
• Sweeps of the extended reference range
• Sweeps of the pre-session intraday range
• Equal-high and equal-low clusters that attract price and later reject
A liquidity event is confirmed when price trades beyond a key level and then returns back into the range.
Users can decide whether:
• Liquidity events are required for signals
• Only the side where liquidity was taken should be traded
• Both sides can be considered
--------------------------------------------------------------------
3. Structural Shifts and Momentum Confirmation
The engine monitors local structure using pivot-based swing points. A directional shift occurs when price closes beyond a previous swing level.
This shift is validated only if accompanied by a momentum candle (a body significantly larger than recent average).
The user can select aggressive, standard, or defensive confirmation modes.
These momentum-based signals are independent from zone-based signals.
--------------------------------------------------------------------
4. Inefficiency / Imbalance Zones (Higher Timeframe Mapping)
StratyPro maps areas where price moved too quickly (inefficiency zones) on a higher timeframe.
These zones:
• Are detected using multiple gap-based models
• Have a maximum lifetime
• Are invalidated if price fully trades through
• Are visualized with dynamic boxes extended forward
Optional signal conditions allow:
• Tap + rejection within an active zone
• Session window confirmation
• Liquidity-based directional filters
--------------------------------------------------------------------
5. Equilibrium
StratyPro calculates an equilibrium level for each session based on the midpoint of either:
• The Asia accumulation range, or
• The most recent structural swing range
Users can restrict signals so that:
• Shorts only trigger above equilibrium
• Longs only trigger below equilibrium
This helps avoid entries in the inefficient half of the range.
--------------------------------------------------------------------
6. Signal Types
There are two main signal types inside each session:
1. Zone-Based Signals
- Price interacts with an active inefficiency zone
- Liquidity event is confirmed
- Price rejects the zone
- Session window is active
2. Momentum-Based Signals
- A structural shift is confirmed
- A momentum candle supports the move
- Liquidity/equilibrium conditions are met
- Session window is active
Long and short signals are plotted clearly on the chart with directional labels.
--------------------------------------------------------------------
7. Alerts
SP includes alerts for:
• Zone-based long/short signals
• Momentum-based long/short signals
• Core Session events
• Expansion Session events
Each alert matches the exact visual signal on chart.
--------------------------------------------------------------------
Recommended workflow:
1. Observe how the Asia range forms initial liquidity.
2. Watch for liquidity grabs before the main session.
3. Use inefficiency zones as primary interest areas.
4. Use session timing as the main filter.
5. Apply your own risk management alongside the signals.
Stratypro is a structural mapping tool intended for experienced traders. It does not constitute financial advice.

[EWT] HTF Candle Panel: Advanced Multi-Timeframe ProjectionOverview
The HTF Candle Panel is a high-performance utility designed for serious technical analysts who require real-time higher timeframe (HTF) context without the need to constantly switch tabs. This indicator renders a customizable panel of HTF candlesticks directly in the right margin of your current chart, allowing you to monitor the developing price action of a Daily, Weekly, or Hourly candle while navigating the lower timeframe (LTF) noise.
Key Features
Real-Time HTF Projection: Unlike standard static overlays, this script uses request.security with lookahead logic to ensure the most recent HTF candle updates tick-by-tick in sync with the live market.
Fully Customizable Interface:
Adjustable Timeframes: Switch between any interval (e.g., watching 1D candles on a 5m chart).
Dynamic Positioning: Use the Extra Right Margin Offset and Spacing inputs to perfectly position the panel in your chart's empty space.
Two Visual Styles: Choose between Standard (Wicks + Bodies) for a classic look or Box style for a cleaner, modern interface.
Smart Background Panel: An optional shaded "container" automatically scales to the High/Low of the projected period, providing a clear visual boundary for your HTF analysis.
Price Action Labels: Toggleable labels for the most recent HTF close prices with configurable positioning and colors.
Strategic Use Cases
1. ICT & CRT Trading (The "Internal vs. External" Perspective)
For traders following Inner Circle Trader (ICT) concepts or Core Range Theory (CRT), understanding where the "HTF Objective" lies is critical.
Identify HTF PD Arrays: Easily visualize HTF Order Blocks or Fair Value Gaps (FVGs) as they form on the Daily or 4H level while you look for entries on the 1m or 5m.
Bias Confirmation: Keep the Daily candle bias in your peripheral vision to ensure your LTF trend alignments are high-probability.
2. Multi-Timeframe (MTF) Analysis
MTF analysis is the backbone of professional trading. This indicator solves the "tunnel vision" problem by providing:
The "Micro-to-Macro" Bridge: See if a 15m bullish breakout is actually just a wick-rejection on a 4H candle.
Candle Close Anticipation: Monitor the "Fullness" of an HTF candle to predict potential reversals or continuations before they happen on the lower timeframe.
How to Set Up
Right Margin: For the best experience, go to your Chart Settings > Canvas > Margin > Right and set it to 100 or higher. This provides the "future space" for the panel to reside.
Configuration: Use the Extra Right Margin Offset input to push the candles further right if they overlap with your current price action.
Developer Best Practices
Built on Pine Script v6, this script follows the KISS (Keep It Simple, Stupid) and DRY (Don't Repeat Yourself) principles. It is optimized for performance by executing drawing logic only on the most recent bar (barstate.islast), ensuring your chart remains lag-free even with multiple candles projected.

Easy DashboardREAD DISCLAIMER BELOW BEFORE USE
The ultimate TradingView dashboard for tracking up to 24 tickers in real-time. Stay on top of your P&L, Volatility (ATR), and Earnings countdown without ever leaving your chart.
Total Privacy: No hardcoded data. Input your holdings privately via the settings menu.
Risk Control: Built-in "traffic light" system for ATR % and Volume % to spot volatility and institutional activity.
Earnings Alerts: Automated countdowns that turn red when an Earnings Report is less than 7 days away.
Complete Wealth View: Live tracking of Daily P&L, Cash, and Total Net Worth.
Clean UI: Fully customizable positions, text sizes, and a "Minimal Mode" for a distraction-free workspace.
DISCLAIMER
IMPORTANT: READ BEFORE USE
This indicator is provided for educational and informational purposes only.
Not Financial Advice: The information, metrics, and calculations displayed by this script do not constitute financial, investment, or trading advice.
Not an Inducement: Nothing within this script should be construed as a recommendation or an inducement to buy, sell, or hold any financial instrument.
Accuracy & Risks: While every effort is made to ensure technical accuracy, trading involves significant risk of loss. Past performance is not indicative of future results.
User Responsibility: All data entered (Tickers, Quantities, Cash) is processed locally. The user is solely responsible for verifying the accuracy of the data and for any financial decisions made based on the output of this script.
Fictitious Data: All pre-entered values in this demo version are fictitious and intended for demonstration purposes only.

RSI Divergence By HaykTrading (Chart + RSI)RSI Divergence Detector with Extreme Zone Filter & Dual-Pane Lines
This indicator detects classic and hidden RSI divergences while applying a strict filter: divergences are only shown when the starting (older) pivot on the RSI is in an extreme zone — below the lower limit (default 30, oversold) for bullish divergences, or above the upper limit (default 70, overbought) for bearish ones.
This filtering focuses on higher-probability setups that originate from truly overbought/oversold conditions, reducing noise from mid-range divergences.
Key Features:
• Regular and hidden bullish/bearish divergences
• Customizable RSI length, source, and moving average overlay
• Adjustable extreme zone limits (default 30/70)
• Colored circle markers on RSI pivot points
• Divergence lines drawn simultaneously:
- On the RSI pane (solid for regular, dashed for hidden)
- On the main price chart (overlaid using force_overlay=true) connecting the price pivots
• Gradient fills for overbought/oversold zones
• Built-in alert conditions for all four divergence types
How It Works:
The script identifies pivot highs/lows on the RSI, checks for price vs. oscillator disagreement within a recent range (5-60 bars), and only validates the divergence if the previous RSI pivot was in the user-defined extreme zone.
Usage Tips:
• Enable/disable regular and hidden divergences via inputs
• Adjust the Bull Start Limit (<) and Bear Start Limit (>) to suit different assets or timeframes (e.g., 20/80 for more extreme filtering)
• Lines on the price chart make it easy to see the exact price pivots without switching panes
• Best used on higher timeframes for cleaner signals
No repainting | Works on all markets and timeframes
Enjoy responsible trading — this is a tool for analysis, not financial advice.

RSI Divergence + MTF Table FinalThis is a professional, high-impact English description for your RSI Divergence + MTF Table Final script, designed to attract users on TradingView by highlighting its institutional-grade features.
Institutional RSI Divergence & MTF Confluence Heatmap
Overview
The Institutional RSI Divergence & MTF Confluence Heatmap is a professional-grade analytical tool designed for high-precision traders. It combines Automated RSI Divergence Detection with a Multi-Timeframe (MTF) Heatmap Table, allowing you to monitor market momentum across 8 different timeframes (from 1-minute to 1-day) without ever switching charts.
Key Features
🔍 Automated Divergence Detection: Instantly identifies Regular Bullish and Bearish divergences on the RSI oscillator, marking them with clear "Bull" and "Bear" labels.
📊 MTF Heatmap Grid: A real-time monitoring table that tracks RSI values across: 1m, 5m, 15m, 30m, 1h, 4h, 12h, and 1D.
🎨 Dynamic "Institutional" Color Logic: The table uses a sophisticated color-coded system to highlight extreme exhaustion and momentum:
Ultra Overbought (RSI > 90): Bright Red (Extreme Reversal Zone).
Overbought (RSI > 80): Orange (High Momentum/Caution).
Oversold (RSI < 26): Lime Green (Potential Accumulation).
Neutral: Gray (Consolidation).
🛠️ Flexible Layout Engine: Toggle between Vertical or Horizontal layouts to fit your chart workspace perfectly.
🚀 Pine Script v6 Optimized: Built with the latest TradingView engine for ultra-fast performance and minimal lag.
Trading Strategy: The Power of Confluence
Cross-Timeframe Confirmation: The strongest reversals occur when multiple timeframes (e.g., 15m, 1h, and 4h) all turn Orange/Red or Lime simultaneously. This represents a massive momentum exhaustion.
Divergence Validation: Use the table to see if a detected "Bull" divergence on your current timeframe is backed by "Oversold" conditions on higher timeframes.
Institutional Sniping: Combined with Demand/Supply zones, this script helps you "snipe" entries at the exact moment market momentum peaks or bottoms out.
Settings & Customization
Toggle Compact Mode: Display a minimal version of the table for a cleaner interface.
Custom Thresholds: Modify RSI levels to suit your specific trading style (Scalping vs. Swing Trading).
Table Position: Move the heatmap to any corner of your screen (Top Right, Bottom Left, etc.).

Stage Analysis & MinerviniScript with Stage Analysis and Minervini set data set ups
Candle stick colors:
Lime - Green candle with volume > 50day moving avg vol - Bullish
Yellow - Red or green candle with wick with volume > 50day moving avg vol - Bearish
Black - indecisive candle with volume
Table has the moving averages, ATR, ADR, minervini set ups.
Swing highs and swing lows are printed to identify the latest stop loss markers for swing traders who follow Stan Weinstein stage analysis method of stop loss management
Volume labels and markers are present in the candle if applicable.

SMC Market Structure Analysis Indicator v1.0SMC Market Structure Analysis Indicator v1.0
OVERVIEW
A Pine Script v6 indicator implementing Smart Money Concepts (SMC) for automated market structure analysis. Designed to identify institutional trading patterns through systematic detection of structure breaks, inducement sweeps, and price imbalances.
CORE FEATURES
Market Structure Detection
- BOS (Break of Structure): Trend continuation signal triggered when close price breaks confirmed structure points
- CHoCH (Change of Character): Trend reversal signal triggered when close price breaks protection levels
- Swing Point Labels: Automatic labeling of HH, HL, LL, LH
Inducement (IDM)
- Detects liquidity sweeps to confirm valid structure points
SMC Structure Lines
- Connects confirmed swing points to visualize market waves
Fair Value Gap (FVG)
- Detects price imbalances with Inside Bar filtering
- Tracks fill status with automatic extension stop
Potential Levels
- Displays pending BOS/CHoCH trigger levels as dashed lines
TECHNICAL SPECIFICATIONS
Pine Script Version: v6
Confirmation Method: Close-based (No Repainting)
Inside Bar Filtering: Global
ADVANTAGES
- No Repainting: All confirmations based on close prices
- Noise Filtering: Inside Bars globally ignored
- Fully Configurable: Every visual element can be customized

neeson btc bitcoin CSP-Pro+Comprehensive Description: Crypto Sentiment Pro Plus Indicator
Originality & Unique Value Proposition
Crypto Sentiment Pro Plus is an innovative, multi-dimensional sentiment analysis system that stands out from conventional market indicators through several key innovations:
Holistic 10-Factor Sentiment Model: Unlike single-dimensional indicators (RSI, MACD), this system integrates ten distinct market dimensions, providing a comprehensive view of market psychology beyond simple price action.
Advanced Machine Learning Integration: The indicator incorporates simulated neural network processing and Kalman filtering to dynamically adjust sentiment weighting, creating an adaptive model that learns from market patterns.
Multi-Market Dimension Analysis: The system uniquely combines traditional technical analysis with simulated market microstructure data (liquidity, market breadth) and social sentiment proxies, offering insights typically requiring multiple specialized indicators.
Sentiment State Machine: Implements a sophisticated state-based approach to market psychology, tracking not just current sentiment but also transition patterns, duration effects, and consistency across timeframes.
What It Does & Implementation Methodology
Primary Function: Generates a Composite Sentiment Index (0-100) representing market psychology across ten analytical dimensions, with advanced signal detection and risk management features.
Implementation Architecture:
10-Module Sentiment Engine:
Momentum Sentiment: Combines RSI, MACD, Stochastic, and Price Acceleration metrics
Volume Sentiment: Analyzes volume profiles, OBV trends, and price-volume divergence
Volatility Sentiment: Assesses ATR, Bollinger Band width, and intraday ranges
Market Structure: Evaluates moving average alignment, trend strength (ADX/DMI), and support/resistance positioning
Cycle Analysis: Incorporates seasonal and intraday temporal patterns
Extreme Detection: Identifies overbought/oversold conditions and volatility extremes
Pattern Recognition: Analyzes candlestick formations and breakout patterns
Market Breadth: Simulates advance/decline and new high/low dynamics
Liquidity Assessment: Models bid-ask spreads and order book depth
Social Sentiment: Proxies social media activity through volume and price change relationships
Advanced Processing Layer:
Neural Network Simulation: Applies weighted optimization across modules (0.12 momentum, 0.11 volume, 0.10 volatility, etc.)
Kalman Filter: Continuously refines sentiment estimation with a 0.7 gain factor
Adaptive Weighting: Dynamically adjusts module influence based on market state (extreme conditions increase weighting by 20%)
Signal Detection System:
Multi-Confirmation Framework: Requires volume, trend, and module consistency confirmation
Divergence Analysis: Detects price-sentiment divergences across multiple timeframes (20/40 periods)
Strength Grading: Classifies signals as Strong (3), Normal (2), or Weak (1) based on confirmation criteria
Core Computational Philosophy
Underlying Principle: Market sentiment is a multi-factorial psychological state that manifests across different market dimensions simultaneously. True sentiment extremes occur when multiple independent factors converge, while conflicting signals indicate market transition phases.
Key Philosophical Tenets:
Dimensional Convergence: Significant market moves require alignment across multiple sentiment dimensions. The system measures this through module consistency scoring (bullish/bearish module counts).
Asymmetric Response: The model applies greater weighting during extreme market states (greed/fear zones), recognizing that psychological factors dominate during market extremes.
Temporal Layering: Different sentiment factors operate on different timeframes—momentum (short-term), structure (medium-term), cycles (long-term). The system synthesizes these into a coherent picture.
Mean Reversion vs. Momentum Balance: The indicator dynamically balances between identifying trend continuation (momentum alignment) and reversal opportunities (extreme readings with divergence).
Practical Application for Traders
Specific Trading Methodologies Supported:
Sentiment-Based Trend Following:
Method: Combines momentum confirmation (RSI>50, MACD positive) with structural alignment (MA ordering)
Entry: When sentiment index crosses above 50 with volume confirmation and >3 bullish modules
Exit: On sentiment divergence or when extreme readings (>85) suggest exhaustion
Mean Reversion Trading:
Method: Focuses on extreme sentiment readings (<15 or >85) with technical divergence
Entry: Extreme sentiment + price-sentiment divergence + volume spike confirmation
Risk Management: Position sizing based on sentiment risk score (higher risk = smaller position)
Breakout Confirmation:
Method: Uses pattern and structure modules to validate breakout authenticity
Application: Breakout signals require >60 sentiment score and volume >120% of average
Filter: Rejects breakouts during low sentiment volatility (<5) suggesting false moves
Multi-Timeframe Sentiment Analysis:
Method: Compares daily vs. weekly sentiment for convergence/divergence
Application: Daily-weekly alignment provides high-probability directional bias
Signal: Only take positions when both timeframes agree (both >50 or both <50)
Specific Signal Types Generated:
Strong Buy/Sell Signals: Require basic signal + volume confirmation + module consistency + trend alignment + momentum confirmation
Divergence Signals: Price makes new high/low but sentiment doesn't confirm
Crossover Signals: Sentiment index crosses key thresholds (20, 30, 50, 70, 80)
Extreme Event Alerts: Sentiment reaches >90 or <10 levels indicating potential capitulation
Risk Management Integration:
Dynamic Position Sizing: Recommends 100% position at <15 sentiment, 0% at >85 sentiment
Comprehensive Risk Score: Combines sentiment risk, confidence score, and sentiment volatility
State Duration Tracking: Measures how long market remains in current sentiment state
Practical Usage Guidelines:
Primary Use: As a confirming indicator alongside price action analysis
Best Timeframes: 1-hour to daily charts for optimal signal-to-noise ratio
Market Conditions: Particularly effective during high-volatility periods and trend transitions
Pairing Suggestions: Combine with volume profile analysis and key support/resistance levels
Avoid: Using as a standalone system; always confirm with price structure and market context
This system provides traders with a nuanced understanding of market psychology across multiple dimensions, offering specific, actionable signals based on convergence/divergence principles rather than single indicator readings.

Rapid Signal GeometryMechanism Explained (Simple & Practical)
1. Fair Value Baseline
A smoothed moving average (RMA) is used to represent price equilibrium. This baseline filters noise and avoids reacting to minor fluctuations.
2. Volatility Envelope
ATR or Standard Deviation (user selectable) defines how far price must move away from equilibrium to be considered meaningful. This adaptive range expands and contracts with market conditions.
3. Regime Shift Detection
A bullish regime is confirmed when price decisively breaks above the upper volatility boundary.
A bearish regime is confirmed when price decisively breaks below the lower volatility boundary.
The logic resets on every candle — there is no trailing or repainting behaviour.
4. Signal Candle Geometry
On the first candle of a new regime, RSG draws two short horizontal guides:
• 50% Body Level
The midpoint of the signal candle’s body, representing balance within the impulse.
• Projected Wick Level
A mirrored wick projection calculated from the candle’s close:
– Bullish signal: upper wick distance projected downward
– Bearish signal: lower wick distance projected upward
These levels provide a geometric framework for execution planning.
Signals & Alerts
• Buy signal prints only on the first confirmed bullish regime
• Sell signal prints only on the first confirmed bearish regime
• No repeated signals during the same trend
Alert options include:
• Buy only
• Sell only
• Combined Buy/Sell
All alerts are bar-close confirmed.
How to Use Rapid Signal Geometry
RSG is best used as an execution aid, not a standalone strategy.
Common use cases:
• Refining entries after a confirmed directional bias
• Identifying pullback or reaction zones on signal candles
• Aligning discretionary entries with volatility-aware structure
• Complementing higher-timeframe analysis or session-based strategies
The geometric levels are reference points — traders should always apply their own risk management.
Recommended Timeframes
RSG performs best on:
• 15-minute
• 1-hour
These timeframes provide a strong balance between signal clarity and noise reduction.
Lower timeframes may produce more frequent regime changes, while higher timeframes offer fewer but broader signals.
Important Notes
• This indicator does not predict future price movement
• Signals are not trade recommendations
• Designed for educational and analytical purposes
• Always combine with your own market context and risk rules
Summary
Rapid Signal Geometry focuses on one thing only:
revealing the internal geometry of decisive market moments .
By combining volatility-aware regime detection with precise candle-level reference marks, RSG offers a clean and disciplined approach to execution-focused chart analysis.

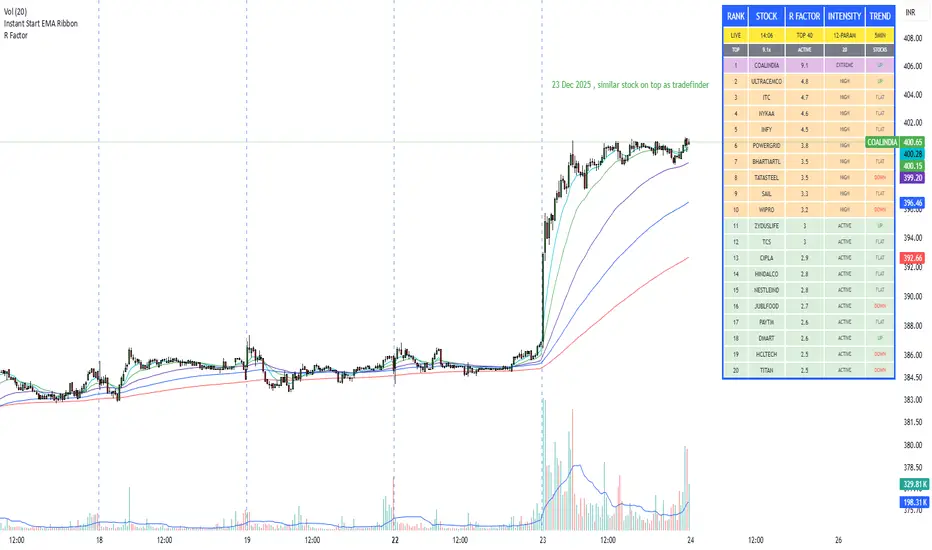
R Factor Advanced Stock Activity Ranking (Experimental) R Factor (relative factor) is a custom logic based 'momentum ranking' parameter, which measures intensity of intraday momentum and volatility. This parameter compared today's activity from last 20 days activity and ranks the stocks according to the intensity of the momentum.
Why momentum ranker?
Because traditional %change sorts intraday stock which show momentum in ascending order of value of % change, for example 3%, 2.5 %, 1% etc. But momentum ranker does not use % change as a sorting parameter for top gainers, or losers. It ranks the stocks, regardless of the direction, according to the intensity it is showing. The value of the momentum ranking has no meaning of itself, just understand that higher the value of momentum ranker, the more intensity the stock is showing.
In this indicator we can only scan 40 F&O stock of Indian Stock Market. This indicator is to be used only on 5 min timeframe.
Tip: Do not change any values in the settings otherwise, the indicator won't work as expected.
Also after applying the indicator, your canvas will shrink, manually fix it by stretching from Y axis, a table will appear showing top 20 stocks. Some times the indicator will glitch & show incorrect names of stocks, refresh the Tradingview website to fix this. Best used on a PC.
Disclaimer/Warning:
This parameter is inspired by TradeFinder and is an attempt to study the momentum of the stocks. This indicator in no way attempts to copy features of the TradeFinder software, this is purely an experimental Indicator, for the people who cannot afford to buy a trading software. This indicator does not provide Buy/Sell signals or nor is an investment advice. This indicator solely for the purpose of study of price and its momentum. Users are responsible for their own actions, profit/loss of the users is not the liability of author.
SMC Post-Analysis Lab [PhenLabs]📊 SMC Post-Analysis Lab
Version: PineScript™ v6
📌 Description
The SMC Post-Analysis Lab is a dedicated hindsight analysis tool built for traders who want to understand what really happened during any historical trading period. Unlike forward-looking indicators, this tool lets you scroll back through time and instantly receive algorithmic classification of market states using Smart Money Concepts methodology.
Whether you’re reviewing a losing trade, studying a successful session, or building your pattern recognition skills, this indicator provides immediate context. The expansion-aware algorithm processes price action within your selected window and outputs clear, actionable classifications ranging from Parabolic Expansion to Consolidation Inducements.
Stop relying on subjective post-trade analysis. Let the algorithm objectively tell you whether institutional players were accumulating, distributing, or running inducements during your trades.
🚀 Points of Innovation
First indicator specifically designed for SMC-based post-trade review rather than live signal generation
Dual-mode analysis system allowing both dynamic scrollback and precise date selection
Expansion-aware classification algorithm that weighs range position against net displacement
Real-time efficiency metrics calculating directional quality of price movement
Integrated visual FVG detection within the analysis window only
Interactive table with clickable date range adjustment via chart interface
🔧 Core Components
Pivot Detection Engine: Uses configurable pivot length to identify significant swing highs and lows for structure break detection
Window Calculator: Determines active analysis zone based on either bar offset or timestamp boundaries
Data Aggregator: Tracks window open, high, low, close and counts bullish/bearish structure break events
State Classification Algorithm: Applies hierarchical logic to determine market state from six possible classifications
Visual Renderer: Draws structure breaks, FVG boxes, and window highlighting within the active zone
🔥 Key Features
Sliding Window Mode: Use the Scroll Back slider to dynamically move your analysis zone backwards through history bar-by-bar
Date Range Mode: Select specific start and end timestamps for precise session or trade review
Six Market State Classifications: Parabolic Expansion (Bull/Bear), Bullish/Bearish Order Flow, Accumulation/Distribution Reversal, and Consolidation/Inducement
Range Position Percentile: See exactly where price closed relative to the window’s high-low range as a percentage
Bull/Bear Event Counter: Quantified count of structure breaks in each direction during the analysis period
Efficiency Calculation: Net move divided by total range reveals trending quality versus chop
🎨 Visualization
Blue Window Highlight: Active analysis zone is clearly marked with blue background shading on the chart
Structure Break Lines: Dashed lines appear at each bullish or bearish structure break within the window
FVG Boxes: Fair Value Gaps automatically render as semi-transparent boxes in bullish or bearish colors
Dashboard Table: Top-right positioned table displays State, Analysis description, and Metrics in real-time
Color-Coded States: Each classification uses distinct coloring for immediate visual recognition
Interactive Tip Row: Optional help text guides users on clicking the table to adjust date range
📖 Usage Guidelines
General Configuration
Analysis Mode: Default is Sliding Window. Choose Date Range for specific timestamp analysis.
Sliding Window Settings
Scroll Back (Bars): Default 0. Increase to move window backwards into history.
Window Width (Bars): Default 100. Range 20-50 for scalping, 100+ for swing analysis.
Date Range Settings
Start Date: Select the beginning timestamp for your analysis period.
End Date: Select the ending timestamp for your analysis period.
Visual Settings
Show Help Tip: Default true. Toggle to hide instructional row in dashboard.
Bullish Color: Default teal. Customize for bullish elements.
Bearish Color: Default red. Customize for bearish elements.
SMC Parameters
Pivot Length: Default 5. Lower values (3-5) catch minor breaks. Higher values (10+) focus on major swings.
✅ Best Use Cases
Post-trade review to understand why entries succeeded or failed
Session analysis to identify institutional activity patterns
Trade journaling with objective algorithmic classifications
Pattern recognition training through historical scrollback
Identifying whether stop hunts were inducements or legitimate breaks
Comparing your real-time read versus what the algorithm detected
⚠️ Limitations
Designed for historical analysis only, not live trade signals
Classification accuracy depends on appropriate pivot length for the timeframe
FVG detection uses simple gap logic without mitigation tracking
State classification is based on window data only, not broader context
Requires manual scrolling or date input to review different periods
💡 What Makes This Unique
Purpose-Built for Review: Unlike most indicators focused on live signals, this is designed specifically for post-trade analysis
Expansion-Aware Logic: Algorithm weighs both position in range AND directional efficiency for accurate state detection
Interactive Date Control: Click the dashboard table to reveal draggable anchors for window adjustment directly on chart
🔬 How It Works
1. Window Definition:
User selects either Sliding Window or Date Range mode
System calculates which bars fall within the active analysis zone
Active zone receives blue background highlighting
2. Data Collection:
Algorithm captures window open, running high, running low, and current close
Structure breaks are detected when price crosses above last pivot high or below last pivot low
Bullish and bearish events are counted separately
3. State Classification:
Range Position calculates where close sits as percentage of high-low range
Efficiency calculates net move divided by total range
Hierarchical logic applies priority rules from Parabolic states down to Consolidation
4. Output Rendering:
Dashboard table updates with State title, Analysis description, and Metrics
Visual elements render within window only to keep chart clean
Colors reflect bullish, bearish, or neutral classification
💡 Note:
This indicator is intended for educational and review purposes. Use it to develop your understanding of Smart Money Concepts by analyzing what institutional order flow looked like during historical periods. Combine insights with your own analysis methodology for best results.

MACD-v Bullish/Bearish DivergenceMACD-v Bullish/Bearish Divergence
Overview This indicator is a specialized divergence detector based on the MACD-v (Volatility Normalized Momentum) concept. Unlike standard MACD which uses absolute price differences, MACD-v normalizes values against volatility (ATR), allowing for fixed, universal Overbought/Oversold thresholds across all assets and timeframes.
Recommendation: This script is highly effective when paired with the original MACD-v by Alex Spiroglou. While this indicator focuses on identifying and visualizing divergence entries, using the original oscillator alongside it provides the best visual context for the overall momentum structure.
How It Works
This tool uses a dual-signal mechanism (Raw Line + Signal Smooth) to identify specific divergence setups:
Setup (Yellow/Blue Dots): Identifies when price momentum has extended significantly into extreme zones (Overbought/Oversold).
Trigger (Red/Green Dots): Fires when price fails to make a new momentum extreme despite price action (classic divergence/failure swing).
Active State (Background Color): Once a trigger fires, the background highlights (Red for Bearish, Green for Bullish) to indicate an active divergence play.
Reset (Exit): The signal state clears when momentum returns to the neutral "safe zone."
Important Note: Momentum Washout
The colored background persists as long as the divergence trade remains valid. Traders should note the concept of "Momentum Washout":
Signal End: The background color turns off when the MACD returns to the neutral range, indicating the primary high-velocity impulse is over.
Performance Continuation: Significant positive or negative price performance can often continue even after the background signal ends. This period allows the remaining momentum to "wash out" or drift before the next major impulse.
Strategy Tip: The indicator is designed to capture the high-volatility portion of the reversal. Do not assume the end of the signal is the absolute top or bottom of the trend; it simply marks the normalization of momentum.
Strategy Recommendation: Multi-Timeframe Analysis
Divergence signals are most powerful when confirmed across timeframes. It is highly recommended to look for alignment before taking a trade:
Trend Confirmation: If you see a signal on a lower timeframe (e.g., 5m or 15m), check a higher timeframe (e.g., 1H or 4H). A bullish divergence on the 5m is significantly more reliable if the 1H momentum is already bullish or oversold.
Signal Stacking: Valid signals often appear sequentially—first on the 1m, then the 5m, and finally the 15m. Waiting for this "cascade" can filter out false reversals.
Visual Guide
🔵 Blue Dot: Bullish Divergence Setup (Watch for entry).
🟢 Green Dot: Bullish Divergence Trigger (Long Entry).
🟡 Yellow Dot: Bearish Divergence Setup (Watch for entry).
🔴 Red Dot: Bearish Divergence Trigger (Short Entry).
Background Color: Indicates an active trade (Red = Bearish / Green = Bullish).
Settings
Auto-Detect: Automatically switches between Scalping settings (tighter thresholds) for low timeframes and Swing settings for high timeframes.
Strict Invalidation: If enabled, cancels a setup if momentum pushes too far in the opposite direction before triggering.
Active Signal Multiplier: Dynamically smooths the signal line only when a trade is active to prevent premature exits during choppy corrections.
Disclaimer: This tool is for educational purposes and trend analysis only. Always manage your risk appropriately.

Advanced Multi-Level S/R ZonesAdvanced Multi-Level S/R Zones: The Comprehensive Guide
1. Introduction: The Evolution of Support & Resistance:
Support and Resistance (S/R) is the backbone of technical analysis. However, traditional methods of drawing these levels are often plagued by subjectivity. Two traders looking at the same chart will often draw two different lines. Furthermore, standard indicators often treat every price point equally, ignoring the critical context of Volume and Time.
The Advanced Multi-Level S/R Zones script represents a paradigm shift. It moves away from subjective line drawing and toward Quantitative Zoning. By utilizing statistical measures of variability (Standard Deviation, MAD, IQR) combined with Volume-Weighting and Time-Decay algorithms, this tool identifies where price is mathematically most likely to react. It treats S/R not as thin lines, but as dynamic zones of probability.
2. Core Logic and Mathematical Foundation:
To understand how to use this tool optimally, one must understand the "engine" under the hood. The script operates on four distinct pillars of logic:
A. Session-Based Data Collection:
The script does not look at every single tick. Instead, it aggregates data into "Sessions" (daily bars by default logic). It extracts the High, Low, and Total Volume for every session within the user-defined lookback period. This filters out intraday noise and focuses on the macro structure of the market.
B. Adaptive Statistical Variability:
Most Bollinger Band-style indicators use Standard Deviation (StdDev) to measure width. However, StdDev is heavily influenced by outliers (extreme wicks). This script offers a sophisticated Adaptive Method-Skewness Detection: The script calculates the skewness of the price distribution. Adaptive Selection: If the data is highly skewed (lots of outliers, typical in Crypto), it switches to MAD (Median Absolute Deviation). MAD is robust and ignores outliers. If the data is moderately skewed, it uses IQR (Interquartile Range). If the data is normal (Gaussian), it uses StdDev.
Benefit: This ensures the zone widths are accurate regardless of whether you are trading a stable Forex pair or a volatile Altcoin.
C. The Weighting Engine (Volume + Time)
Not all price history is equal. This script assigns a "Weight Score" to every session based on two factors:
Volume Weighting: Sessions with massive volume (institutional activity) are given higher importance. A high formed on low volume is less significant than a high formed on peak volume.
Time Decay: Recent price action is more relevant than price action from 50 bars ago. The script applies a decay factor (default 0.85). This means a session from yesterday has 100% impact, while a session from 10 days ago has significantly less influence on the zone calculation.
D. Clustering Algorithm
Once the data is weighted, the script runs a clustering algorithm. It looks for price levels where multiple session Highs (for Resistance) or Lows (for Support) congregate.
It requires a minimum number of points to form a zone (User Input: minPoints).
It merges nearby levels based on the Cluster Separation Factor.
This results in "Primary," "Secondary," and "Tertiary" zones based on the strength and quantity of data points in that cluster.
3. Detailed Features and Inputs Breakdown:
Group 1: Main Settings
Lookback Sessions (Default: 10): Defines how far back the script looks for pivots. A higher number (e.g., 50) creates long-term structural zones. A lower number (e.g., 5) creates short-term scalping zones.
Variability Method (Adaptive): As described above, leave this on "Adaptive" for the best results across different assets.
Zone Width Multiplier (Default: 0.75): Controls the vertical thickness of the zones. Increase this to 1.0 or 1.5 for highly volatile assets to ensure you catch the wicks.
Minimum Points per Zone: The strictness filter. If set to 3, a price level must be hit 3 times within the lookback to generate a zone. Higher numbers = fewer, but stronger zones.
Group 2: Weighting
Volume-Weighted Zones: Crucial for identifying "Smart Money" levels. Keep this TRUE.
Time Decay: Ensures the zones update dynamically. If price moves away from a level for a long time, the zone will fade in significance.
ATR-Normalized Zone Width: This is a dynamic volatility filter. If TRUE, the zone width expands and contracts based on the Average True Range. This is vital for maintaining accuracy during market breakouts or crashes.
Group 3: Zone Strength & Scoring
The script calculates a "Score" (0-100%) for every zone based on:
-Point Count: More hits = higher score.
-Touches: How many times price wicked into the zone recently.
-Intact Status: Has the zone been broken?
-Weight: Volume/Time weight of the constituent points.
-Track Zone Touches: Looks back n bars to see how often price respected this level.
-Touch Threshold: The sensitivity for counting a "touch."
Group 4: Visuals & Display
Extend Bars: How far to the right the boxes are drawn.
Show Labels: Displays the Score, Tier (Primary/Secondary), and Status (Retesting).
Detect Pivot Zones (Overlap): This is a killer feature. It detects where a Support Zone overlaps with a Resistance Zone.
Significance: These are "Flip Zones" (Old Resistance becomes New Support). They are colored differently (Orange by default) and represent high-probability entry areas.
Group 5: Signals & Alerts
Entry Signals: Plots Buy/Sell labels when price rejects a zone.
Detect Break & Retest: specifically looks for the "Break -> Pullback -> Bounce" pattern, labeled as "RETEST BUY/SELL".
Proximity Alert: Triggers when price gets within x% of a zone.
4. Understanding the Visuals (Interpreting the Chart)
When you load the script, you will see several visual elements. Here is how to read them:
The Boxes (Zones)
Red Shades: Resistance Zones.
Dark Red (Solid Border): Primary Resistance. The strongest wall.
Lighter Red (Dashed Border): Secondary/Tertiary. Weaker, but still relevant.
Green Shades: Support Zones.
Dark Green (Solid Border): Primary Support. The strongest floor.
Orange Boxes: Pivot Zones. These are areas where price has historically reacted as both support and resistance. These are the "Line in the Sand" for trend direction.
The Labels & Emojis
The script assigns emojis to zone strength:
🔥 (Fire): Score > 80%. A massive level. Expect a strong reaction.
⭐ (Star): Score > 60%. A solid structural level.
✓ (Check): Score > 40%. A standard level.
"⟳ RETESTING": Appears when a zone was broken, and price is currently pulling back to test it from the other side.
The Dashboard (Top Right)
A statistics table provides a "Head-Up Display" for the asset:
High/Low σ (Sigma): The variability of the highs and lows. If High σ is much larger than Low σ, it implies the tops are erratic (wicks) while bottoms are clean (flat).
Method: Shows which statistical method the Adaptive engine selected (e.g., "MAD (auto)").
ATR: Current volatility value used for normalization.
5. Strategies for Optimum Output
To get the most out of this script, you should not just blindly follow the lines. Use these specific strategies:
Strategy A: The "Zone Fade" (Range Trading)
This works best in sideways markets.
Identify a Primary Support (Green) and Primary Resistance (Red).
Wait for price to enter the zone.
Look for the "SUPPORT BOUNCE" or "RESISTANCE REJECTION" signal label.
Entry: Enter against the zone (Buy at support, Sell at resistance).
Stop Loss: Place just outside the zone width. Because the zones are calculated using volatility stats, a break of the zone usually means the trade is invalid.
Strategy B: The "Pivot Flip" (Trend Following)
This is the highest probability setup in trending markets.
Look for an Orange Pivot Zone.
Wait for price to break through a Resistance Zone cleanly.
Wait for the price to return to that zone (which may now turn Orange or act as Support).
Look for the "RETEST BUY" label.
Logic: Old resistance becoming new support is a classic sign of trend continuation. The script automates the detection of this exact geometric phenomenon.
Strategy C: The Volatility Squeeze
Look at the Dashboard. Compare High σ and Low σ.
If the values are dropping rapidly or becoming very small, the zones will contract (become narrow).
Narrow zones indicate a "Squeeze" or compression in price.
Prepare for a violent breakout. Do not fade (trade against) narrow zones; look to trade the breakout.
6. Optimization & Customization Guide
Different markets require different settings. Here is how to tune the script:
For Crypto & Volatile Stocks (Tesla, Nvidia)
Method: Set to Adaptive (Mandatory, as these assets have "Fat Tails").
Multiplier: Increase to 1.0 - 1.25. Crypto wicks are deep; you need wider zones to avoid getting stopped out prematurely.
Lookback: 20-30 sessions. Crypto has a long memory; short lookbacks generate too much noise.
For Forex (EURUSD, GBPJPY)
Method: You can force StdDev or IQR. Forex is more mean-reverting and Gaussian.
Multiplier: Decrease to 0.5 - 0.75. Forex levels are often very precise to the pip.
Volume Weighting: You may turn this OFF for Forex if your broker's volume data is unreliable (since Forex has no centralized volume), though tick volume often works fine.
For Scalping (1m - 15m Timeframes)
Lookback: Decrease to 5-10. You only care about the immediate session history.
Decay Factor: Decrease to 0.5. You want the script to forget about yesterday's price action very quickly.
Touch Lookback: Decrease to 20 bars.
For Swing Trading (4H - Daily Timeframes)
Lookback: Increase to 50.
Decay Factor: Increase to 0.95. Structural levels from weeks ago are still highly relevant.
Min Points: Increase to 3 or 4. Only show levels that have been tested multiple times.
7. Advantages Over Standard Tools:
Feature Standard S/R Indicator, Advanced Multi-Level S/R Calculation, Uses simple Pivots or Fractals, Uses Statistical Distributions (MAD/IQR). Zone Width Arbitrary or Fixed Adaptive based on Volatility & ATR.
Context Ignores Volume Volume Weighted (Smart Money tracking).
Time Relevance Old levels = New levels Time Decay (Recency bias applied).
Overlaps Usually ignores overlaps Detects Pivot Zones (Res/Sup Flip).
Scoring None 0-100% Strength Score per zone.
8. Conclusion:
The Advanced Multi-Level S/R Zones script is not just a drawing tool; it is a statistical analysis engine. By accounting for the skewness of data, the volume behind the moves, and the decay of time, it provides a strictly objective roadmap of the market structure.
For the optimum output, combine the Pivot Zone identification with the Retest Signals. This aligns you with the underlying flow of order blocks and prevents trading against the statistical probabilities of the market.
