Island Reversal [LuxAlgo]The Island Reversal tool allows traders to identify reversal patterns directly on the chart. These patterns signal a potential change in trend, either from bullish to bearish or vice versa.
The tool enables traders to filter these patterns by trend, volume, and range, making it easy to display pure or less constrained island reversals.
🔶 USAGE
An island reversal pattern may indicate a change in trend. It occurs when prices change direction from an uptrend to a downtrend, or vice versa.
This pattern is a great tool for timing the market. Traders should be aware of when these patterns develop and watch how prices behave after the pattern forms.
Now, let's take a closer look at one of these island reversal patterns to highlight its different components.
The different parts are depicted in the image above.
1. A trend prior to the pattern
2. A gap starts the pattern.
3. A range of prices
4. A final gap, opposite to the first one, closes the pattern.
5. In this case, the pattern leads to a bearish trend, which is opposite to the trend in the first step.
🔹 Trend, Volume and Range Filters
Enabling the trend filter causes the tool to only detect top island reversals during a bullish trend and bottom island reversals during a bearish trend.
Traders can adjust the size of the detected trend in the settings panel. The larger the trend size, the more relevant the reversal patterns can be.
The volume filter only detects reversal patterns if there is more volume within the range of the pattern than in the preceding trend.
The idea is that more people tend to participate at the top and bottom of a trend as it changes direction.
The tool has two range filters that discriminate the range within the island reversal pattern:
Horizontality Filter (R2): Based on the R-squared statistic from linear regression, it detects whether the price is moving sideways within the range.
Volatility Filter: Based on long-term volatility, it detects the size of the range within the pattern.
The smaller the value in the Horizontality Filter, the more horizontal the prices will be within the range. A larger value will detect more reversal patterns.
The larger the value in the Volatility Filter, the larger the ranges will be. A smaller value will detect fewer reversal patterns.
🔶 SETTINGS
🔹 Trend Filter
Trend Filter: Enable or disable the trend filter.
Trend Length: Select the size of the detected trend.
🔹 Volume Filter
Volume Filter: Enable or disable the volume filter.
🔹 Range Filter
Horizontality Filter (R2): Enable or disable the Horizontality filter and select a threshold value.
Volatility Filter: Enable or disable the Volatility filter and select the multiplier value.
🔹 Style
Bullish: Select a color for bullish sessions.
Bearish: Select a color for bearish sessions.
Transparency: Select a transparency level from 100 to 0.
Indicadores y estrategias

Geometric Price-Time Triangle Calculator═══════════════════════════════════════════════════
GEOMETRIC PRICE-TIME TRIANGLE CALCULATOR
═══════════════════════════════════════════════════
Calculates Point C of a geometric triangle using different rotation angles from any selected price swing. Based on Bradley F. Cowan's Price-Time Vector (PTV) methods from "Four-Dimensional Stock Market Structures and Cycles."
📐 WHAT IT DOES
────────────────────────────────────────────────────
Select two points (A and B) on any swing, choose an angle, and the indicator calculates where Point C would be mathematically. It's just vector rotation applied to price charts.
This shows you where Point C lands in both price AND time based on pure geometry - not a prediction, just a calculation.
🎯 FEATURES
────────────────────────────────────────────────────
✓ 10 Different Angles
• Gann ratios: 18.435° (1x3), 26.565° (1x2), 45° (1x1), 63.435° (2x1), 71.565° (3x1)
• Other angles: 30°, 60°, 90°, 120°, 150°
✓ Visual Triangle
• Adjustable colors and opacity for points A, B, C
• Line styles: Solid, Dashed, Dotted
• Extend lines: None, Left, Right, Both
✓ Crosshair at Point C
• Shows where Point C is located
• Vertical line = bar position
• Horizontal line = price level
✓ Data Table
• Shows all calculations
• Price-to-Bar ratio
• Point C location (price and bars from A/B)
• Toggle on/off
🔧 HOW TO USE
────────────────────────────────────────────────────
1. Pick your swing start date (Point A)
2. Pick your swing end date (Point B) - make sure these dates capture the actual high/low of your swing
3. Choose an angle from the dropdown
4. Look at Point C - that's where the geometry puts it
Different angles = different Point C locations. Whether price actually goes there is up to the market.
📊 THE ANGLES
────────────────────────────────────────────────────
- 18.435° (1x3) - Shallow rotation
- 26.565° (1x2) - Moderate rotation
- 45° (1x1) - Gann's balanced ratio
- 60° - Equilateral triangle (default)
- 63.435° (2x1) - Steeper rotation
- 71.565° (3x1) - Very steep rotation
- 90° - Right angle
- 120°-150° - Obtuse angles
💡 PRACTICAL USE
────────────────────────────────────────────────────
→ See where geometric patterns would complete
→ Test if your market respects certain angles
→ Find where multiple angles converge
→ Compare projected Point C to actual price action
→ Use 90° to see symmetrical price/time relationships
→ Backtest historical swings to see what worked
⚙️ HOW IT WORKS
────────────────────────────────────────────────────
1. Takes your AB swing
2. Calculates the BA vector (reverse direction)
3. Normalizes price and time using Price-to-Bar ratio
4. Rotates the vector by your selected angle
5. Converts back to chart coordinates
Basic trigonometry. That's all it is.
📚 BACKGROUND
────────────────────────────────────────────────────
Based on Bradley F. Cowan's Price-Time Vector (PTV) concept from "Four-Dimensional Stock Market Structures and Cycles" and W.D. Gann's geometric angle analysis. Cowan observed that markets sometimes complete geometric patterns. This tool calculates where those patterns would complete mathematically. Whether price actually respects these geometric relationships is something you need to test yourself.
⚠️ IMPORTANT
────────────────────────────────────────────────────
- This is geometric calculation, not prediction
- Point C shows where the math puts it, not where price will go
- Some angles might work for your market, some won't
- Test it yourself on historical data
- Price-to-Bar Ratio stays constant regardless of angle
- Don't trade based on this alone
- Works on all timeframes and assets
🎨 CUSTOMIZATION
────────────────────────────────────────────────────
- Show/hide triangle
- Individual colors for A, B, C points
- Adjust opacity (0-100)
- Line styles for each triangle side
- Extend lines left/right/both/none
- Show/hide data table
- Crosshair color and width
- Customizable table colors
═══════════════════════════════════════════════════

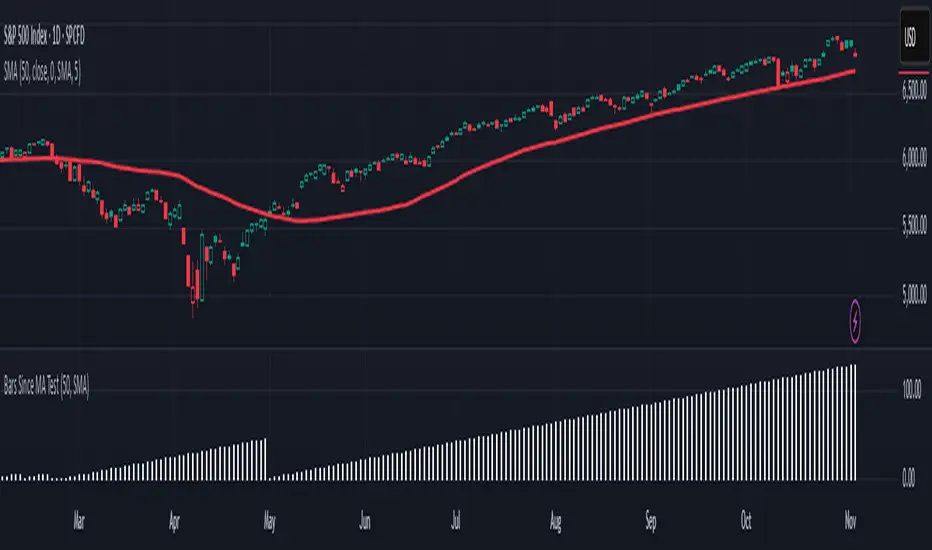
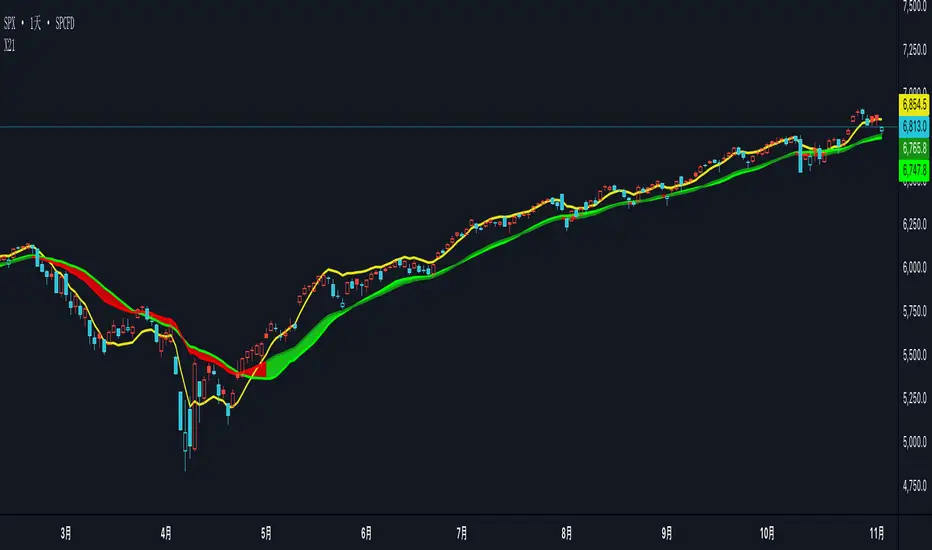
Is it Time for a Pullback? Check Bars Since MA TestAn old market adage declares that “prices never move in a straight line.” Dips occur even in bullish markets. But how can traders know when prices may be due for a pullback?
Today’s script tries to answer that question by asking how many bars have passed since a stock, index or other symbol has tested a given moving average. Long periods of time without touching a line such as the 50-day simple moving average, for example, could prompt traders to be more patient.
Bars Since MA Test counts how many bars have passed since prices touched or crossed the MA in question. The resulting value is plotted in a simple histogram. Users can set the MA length and type. By default, it uses the 50-day simple moving average (SMA).
The chart above applies Bars Since MA Test to the S&P 500. It shows that the index has gone 129 bars without testing its 50-day SMA. That’s the longest since a 146-bar stretch between July 2006 and February 2007.
Other longer runs include January-August 1995 (156 bars), November 1960-June 1961 (144 bars) and April-November 1958 (158 bars).
Given the small number of comparable readings, could traders suspect the current advance is getting long in the tooth?
TradeStation has, for decades, advanced the trading industry, providing access to stocks, options and futures. If you're born to trade, we could be for you. See our Overview for more.
Past performance, whether actual or indicated by historical tests of strategies, is no guarantee of future performance or success. There is a possibility that you may sustain a loss equal to or greater than your entire investment regardless of which asset class you trade (equities, options or futures); therefore, you should not invest or risk money that you cannot afford to lose. Online trading is not suitable for all investors. View the document titled Characteristics and Risks of Standardized Options at www.TradeStation.com . Before trading any asset class, customers must read the relevant risk disclosure statements on www.TradeStation.com . System access and trade placement and execution may be delayed or fail due to market volatility and volume, quote delays, system and software errors, Internet traffic, outages and other factors.
Securities and futures trading is offered to self-directed customers by TradeStation Securities, Inc., a broker-dealer registered with the Securities and Exchange Commission and a futures commission merchant licensed with the Commodity Futures Trading Commission). TradeStation Securities is a member of the Financial Industry Regulatory Authority, the National Futures Association, and a number of exchanges.
TradeStation Securities, Inc. and TradeStation Technologies, Inc. are each wholly owned subsidiaries of TradeStation Group, Inc., both operating, and providing products and services, under the TradeStation brand and trademark. When applying for, or purchasing, accounts, subscriptions, products and services, it is important that you know which company you will be dealing with. Visit www.TradeStation.com for further important information explaining what this means.
Risk & Position DashboardRisk & Position Dashboard
Overview
The Risk & Position Dashboard is a comprehensive trading tool designed to help traders calculate optimal position sizes, manage risk, and visualize potential profit/loss scenarios before entering trades. This indicator provides real-time calculations for position sizing based on account size, risk percentage, and stop-loss levels, while displaying multiple take-profit targets with customizable risk-reward ratios.
Key Features
Position Sizing & Risk Management:
Automatic position size calculation based on account size and risk percentage
Support for leveraged trading with maximum leverage limits
Fractional shares support for brokers that allow partial share trading
Real-time fee calculation including entry, stop-loss, and take-profit fees
Break-even price calculation including trading fees
Multi-Target Profit Management:
Support for up to 3 take-profit levels with individual portion allocations
Customizable risk-reward ratios for each take-profit target
Visual profit/loss zones displayed as colored boxes on the chart
Individual profit calculations for each take-profit level
Visual Dashboard:
Clean, customizable table display showing all key metrics
Configurable label positioning and styling options
Real-time tracking of whether stop-loss or take-profit levels have been reached
Color-coded visual zones for easy identification of risk and reward areas
Advanced Configuration:
Comprehensive input validation and error handling
Support for different chart timeframes and symbols
Customizable colors, fonts, and display options
Hide/show individual data fields for personalized dashboard views
How to Use
Set Account Parameters: Configure your account size, maximum risk percentage per trade, and trading fees in the "Account Settings" section.
Define Trade Setup: Use the "Entry" time picker to select your entry point on the chart, then input your entry price and stop-loss level.
Configure Take Profits: Set your desired risk-reward ratios and portion allocations for each take-profit level. The script supports 1-3 take-profit targets.
Analyze Results: The dashboard will automatically calculate and display position size, number of shares, potential profits/losses, fees, and break-even levels.
Visual Confirmation: Colored boxes on the chart show profit zones (green) and loss zones (red), with lines extending to current price levels.
Reset Entry and SL:
You can easily reset the entry and stop-loss by clicking the "Reset points..." button from the script's "More" menu.
This is useful if you want to quickly clear your current trade setup and start fresh without manually adjusting the points on the chart.
Calculations
The script performs sophisticated calculations including:
Position size based on risk amount and price difference between entry and stop-loss
Leverage requirements and position amount calculations
Fee-adjusted risk-reward ratios for realistic profit expectations
Break-even price including all trading costs
Individual profit calculations for partial position closures
Detailed Take-Profit Calculation Formula:
The take-profit prices are calculated using the following mathematical formula:
// Core variables:
// risk_amount = account_size * (risk_percentage / 100)
// total_risk_per_share = |entry_price - sl_price| + (entry_price * fee%) + (sl_price * fee%)
// shares = risk_amount / total_risk_per_share
// direction_factor = 1 for long positions, -1 for short positions
// Take-profit calculation:
net_win = total_risk_per_share * shares * RR_ratio
tp_price = (net_win + (direction_factor * entry_price * shares) + (entry_price * fee% * shares)) / (direction_factor * shares - fee% * shares)
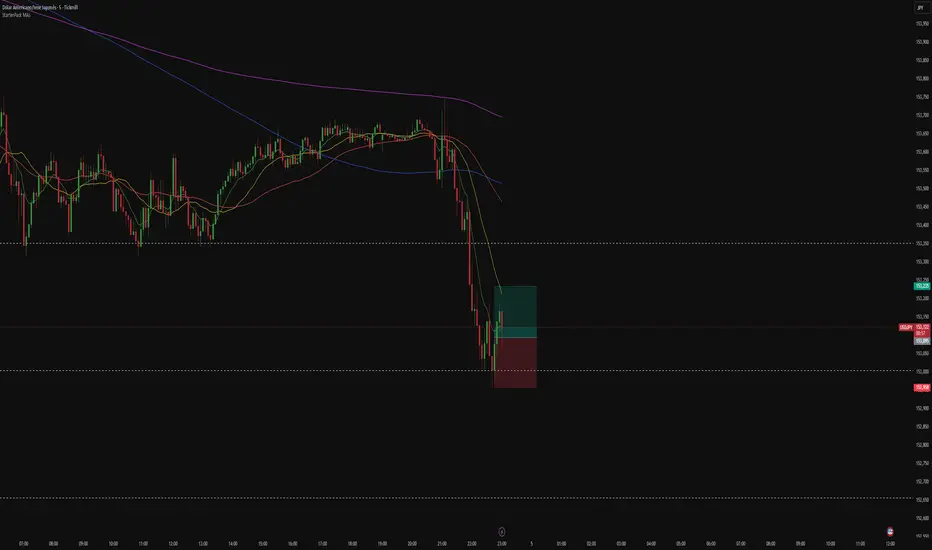
Step-by-step example for a long position (based on screenshot):
Account Size: 2,000 USDT, Risk: 2% = 40 USDT
Entry: 102,062.9 USDT, Stop Loss: 102,178.4 USDT, Fee: 0.06%
Risk per share: |102,062.9 - 102,178.4| + (102,062.9 × 0.0006) + (102,178.4 × 0.0006) = 115.5 + 61.24 + 61.31 = 238.05 USDT
Shares: 40 ÷ 238.05 = 0.168 shares (rounded to 0.17 in display)
Position Size: 0.17 × 102,062.9 = 17,350.69 USDT
Position Amount (with 9x leverage): 17,350.69 ÷ 9 = 1,927.85 USDT
For 2:1 RR: Net win = 238.05 × 0.17 × 2 = 80.94 USDT
TP1 price = (80.94 + (1 × 102,062.9 × 0.17) + (102,062.9 × 0.0006 × 0.17)) ÷ (1 × 0.17 - 0.0006 × 0.17) = 101,464.7 USDT
For 3:1 RR: TP2 price = 101,226.7 USDT (following same formula with RR=3)
This ensures that after accounting for all fees, the actual risk-reward ratio matches the specified target ratio.
Risk Management Features
Maximum Trade Amount: Optional setting to limit position size regardless of account size
Leverage Limits: Built-in maximum leverage protection
Fee Integration: All calculations include realistic trading fees for accurate expectations
Validation: Automatic checking that take-profit portions sum to 100%
Historical Tracking: Visual indication when stop-loss or take-profit levels are reached (within last 5000 bars)
Understanding Max Trade Amount - Multiple Simultaneous Trades:
The "Max Trade Amount" feature is designed for traders who want to open multiple positions simultaneously while maintaining proper risk management. Here's how it works:
Key Concept:
- Risk percentage (2%) always applies to your full Account Size
- Max Trade Amount limits the capital allocated per individual trade
- This allows multiple trades with full risk on each trade
Example from Screenshot:
Account Size: 2,000 USDT
Max Trade Amount: 500 USDT
Risk per Trade: 2% × 2,000 = 40 USDT per trade
Stop Loss Distance: 0.11% from entry
Result: Position Size = 17,350.69 USDT with 35x leverage
Total Risk (including fees): 40.46 USDT
Multiple Trades Strategy:
With this setup, you can open:
Trade 1: 40 USDT risk, 495.73 USDT position amount (35x leverage)
Trade 2: 40 USDT risk, 495.73 USDT position amount (35x leverage)
Trade 3: 40 USDT risk, 495.73 USDT position amount (35x leverage)
Trade 4: 40 USDT risk, 495.73 USDT position amount (35x leverage)
Total Portfolio Exposure:
- 4 simultaneous trades = 4 × 495.73 = 1,982.92 USDT position amount
- Total risk exposure = 4 × 40 = 160 USDT (8% of account)

Ultimate Scalping IndicatorOverview
The Confluence Signal Indicator is a precision-built scalping tool designed to identify high-probability reversal points in the market.
It combines three core technical elements:
Trend
Mean reversion
Momentum
into a single, efficient system.
By filtering out weak RSI signals and focusing only on setups that align with trend direction and recent momentum shifts, this indicator delivers cleaner and more accurate short-term trade signals.
Core Components
200-Period Moving Average (MA200, 5-Minute Timeframe)
The MA200 is always calculated from the 5-minute chart, regardless of your current timeframe. It defines the macro trend direction and ensures that all trades align with the prevailing momentum.
Session VWAP (Volume-Weighted Average Price)
The VWAP tracks the real-time average price weighted by volume for the current trading session. It acts as a dynamic mean-reversion level and helps identify key areas of institutional activity and short-term balance.
RSI (Relative Strength Index)
The indicator uses a standard 14-period RSI to detect overbought and oversold market conditions.
A “recency filter” is added to ensure signals only appear when RSI has recently transitioned from strength to weakness or vice versa, reducing false signals in trending markets.
Signal Logic
Bullish Signal (Green Arrow)
A bullish reversal signal is plotted below a candle when:
Price is above both the 5-minute MA200 and the Session VWAP.
RSI is oversold (below 30).
The last time RSI was above 50 occurred within the last 10 candles before going oversold.
This ensures that the dip is a fresh pullback within an uptrend, not a prolonged oversold condition.
Bearish Signal (Red Arrow)
A bearish reversal signal is plotted above a candle when:
Price is below both the 5-minute MA200 and the Session VWAP.
RSI is overbought (above 70).
The last time RSI was below 50 occurred within the last 10 candles before going overbought.
This ensures that the overbought reading follows a recent move from weakness, identifying potential short entries in a downtrend.
Recommended Usage
This is a scalping-focused indicator, intended for use on timeframes of 5 minutes or lower. Therefore I would highly recommend to use it on Equity futures trading, such as NQ!, ES!, GC! and so on.
It performs best when combined with additional tools such as support and resistance zones, order blocks, or liquidity levels for context.
Avoid counter-trend signals unless confirmed by price structure or volume behavior.

Volume x PriceThis indicator displays the traded volume weighted by the closing price of each candle. It's useful for visualizing the intensity of capital movement in the market, beyond traditional volume.
Calculation: Volume × Closing Price
Display: Column-style histogram
Coloring:
🟩 Green if the session was bullish (close > open)
🟥 Red if the session was bearish (close < open)
Ideal for spotting high-activity zones with directional bias. It complements classic volume analysis and helps identify strong capital inflows or outflows.

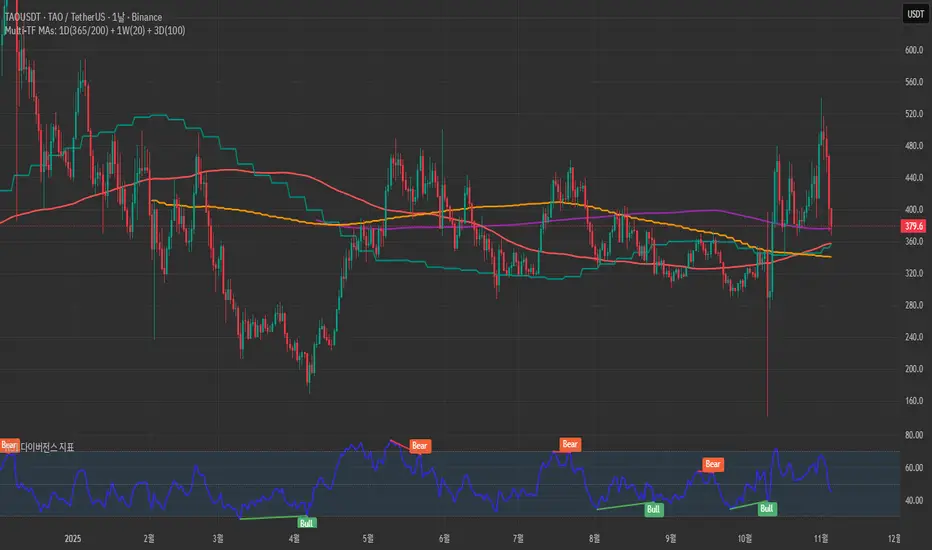
Golden Flow MapGolden Flow Map is a multi–timeframe moving–average system
designed to reveal the underlying direction of long–term market flow,
beyond daily volatility or short–term signals.
This script overlays four major trend lines — each representing a different layer of market rhythm:
Timeframe Length Meaning
🟣 1D – 365 MA Annual average — the true life line of the trend
🔴 1D – 200 MA Institutional benchmark — the long-term threshold
🟢 1W – 20 MA Mid-cycle momentum guide
🟠 3D – 100 MA Wave transition detector — captures trend shifts early
By combining these four perspectives on a single chart,
you can instantly distinguish between a short-term bounce and a major trend reversal.
🧭 How to Use
When all four lines align in one direction → that’s the main current of the market.
If price loses the 200D or 365D, ignore small rebounds — the structure has shifted.
The cross between Weekly 20 and 3D 100 often marks a wave transition.
Focus on alignment order rather than crossovers —
markets ultimately return to the direction of the higher timeframe.
⚙️ Features
SMA / EMA toggle
Individual MA on/off controls
Built-in alerts for 200D and 1W20 cross events
🧠 Concept
“Indicators are not signals — they are maps.”
This tool is not meant to predict, but to reveal the pulse of the market
and guide you through its long-term structure.
✍️ Creator’s Note
Developed from DDU’s personal long-term trend framework,
this indicator serves as a visual compass to expand a trader’s vision
from short-term reactions to macro-level flow.
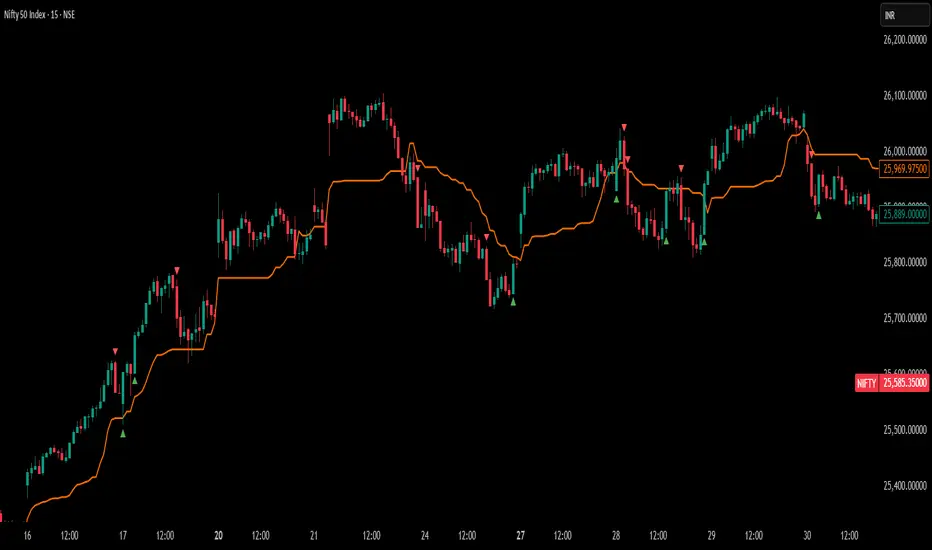
LevelsLevels is a powerful technical analysis tool that automatically identifies and displays key support and resistance levels on the chart. The indicator analyzes historical price data, detecting significant price levels where multiple reversals or price stops have occurred.
How the Indicator Works?
1. Identification of Reversal Points:
- The indicator tracks price extremes using an algorithm to identify local highs and lows
- A reversal point is recorded when:
- Uptrend: price reaches a new low for the last 10 bars
- Downtrend: price reaches a new high for the last 10 bars
2. Level Grouping:
- All found reversal points are analyzed and grouped into key levels
- Levels are combined if they fall within the specified percentage tolerance
3. Filtering Significant Levels:
- Only levels that have been tested the minimum number of times (set in settings) are preserved
- This ensures only statistically significant levels are displayed
How to Use the Indicator?
Trading Scenarios:
1. Bounce from Level:
- When price approaches an identified level, a bounce can be expected
- Opening positions on the bounce with protective stop-loss beyond the level
2. Level Breakout:
- Breaking through a key level may signal trend continuation
- Support level becomes resistance and vice versa
3. Consolidation near Level:
- Prolonged price presence near a level indicates its significance
- Strong movement can be expected after exiting consolidation
Advantages:
- Automatic level identification eliminates subjectivity
- Sensitivity customization for different timeframes and instruments
- Visual simplicity - only significant levels
Indicator Settings
Main Parameters:
- Show Key Levels - enable/disable level display
- Level Tolerance (%) - percentage tolerance for level grouping
- Smaller values: more levels, more precise
- Larger values: fewer levels, more significant
- Minimum Touches - minimum number of touches to form a level
Visual Settings:
- Level Color - level display color
- Level Style - line style (solid, dashed, dotted)
Limitations
- Levels are built only on available historical data
- Does not account for trading volumes
- Parameter adjustment may be required during high volatility periods
The indicator is particularly effective when combined with other analysis tools for signal confirmation.

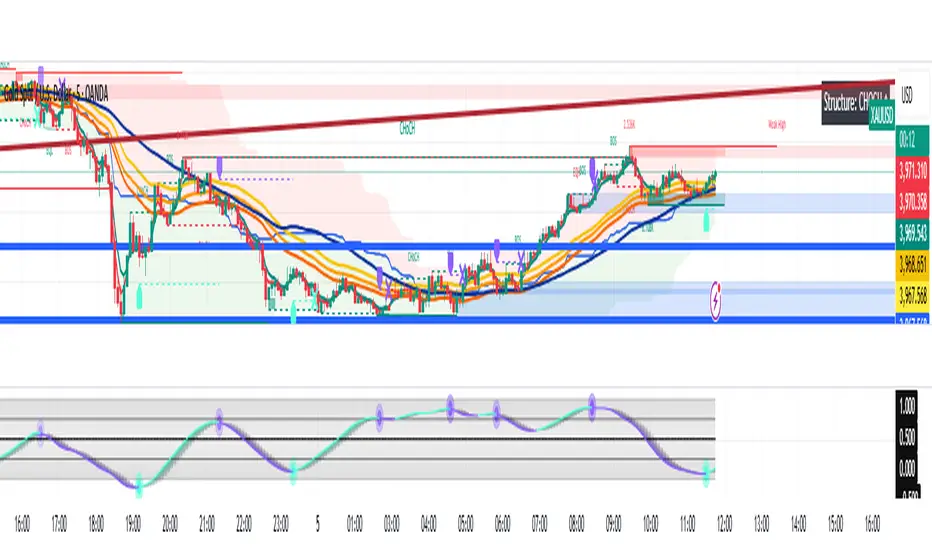
SMC Smart Money Concepts [GPT-5] SRKWhat Smart Money Concepts (SMC) Means
Smart Money Concepts aim to analyze price action and market structure to identify where large players are likely entering or exiting trades.
It’s based on the idea that markets move because of liquidity and institutional order flow, not just technical indicators.
🔹 Core Principles of SMC
Market Structure – Identify trends, highs/lows, and shifts (BOS = Break of Structure, CHoCH = Change of Character).
Liquidity – Understand where stop losses accumulate (above highs or below lows) — these are zones institutions target.
Order Blocks (OBs) – Candles or zones where institutional buying or selling likely originated.
Fair Value Gaps (FVGs) – Imbalances in price where there was no trading activity; price often returns to fill these.
Premium & Discount Zones – Using Fibonacci or structural levels to determine optimal buy (discount) and sell (premium) areas.
Mitigation & Re-entry – Smart money often re-enters positions to “mitigate” previous orders.
🔹 Why Traders Use SMC
To align with institutional order flow instead of retail sentiment.
To improve precision in entries/exits (fewer trades, higher RR).
To understand why price moves, not just how.
🔹 Example
If EUR/USD is trending down, an SMC trader might:
Wait for liquidity sweep above a recent high (where retail traders put stop losses).
Spot a bearish order block.
Enter a sell trade once structure breaks lower (BOS), aiming for liquidity below a recent low.
Overnight Time Box Overnight Time Box (22:59 → 09:59, minutes & TZ)
Automatically draws a time-based box for a customizable window that can cross midnight. Perfect for marking the overnight range up to London open (e.g., 22:59–09:59 in Europe/Bucharest), but works with any minute-level window.
What it does
Builds a daily box covering all price action between two user-defined times (e.g., 22:59 → 09:59).
Tracks session High/Low in real time and can plot extended HL lines for reference.
Keeps historical boxes on the chart for backtesting and review (no flicker, no errors).
How to use
Add the script to an intraday chart.
Configure:
Time zone (default: Europe/Bucharest).
Interval (HHMM-HHMM) — e.g., 2259-0959 (minutes supported).
Optional: High/Low lines, fill color, border color, line width.
Use on intraday timeframes (M1–H4).
Note: On Daily/Weekly/Monthly, a heads-up label reminds you it’s designed for intraday use.
Inputs
Time zone: correct DST handling.
Interval (HHMM-HHMM): supports windows that span midnight.
Draw High/Low lines: extended HL guides for the session.
Colors & widths: full visual customization.
Use cases
Mark the overnight range into London open (10:00 RO).
Delimit Killzones / ICT Silver Bullet windows.
Study range, liquidity raids, FVGs before major sessions.
Tech notes
Built on Pine Script v5 using input.session → stable, DST-safe.
Increased max_boxes_count / max_lines_count to preserve history.
Boxes are “frozen” at session end and remain on chart.
Limitations
Intended for intraday only.
One interval per script instance; attach multiple instances for multiple windows.

GBTimes2Library "GBTimes2"
Library containing all GB (Gartley Butterfly) time values for trading indicators
getTimes()
Returns array of all GB time values in packed format (HHMM)
Returns: Array of integers representing GB times throughout the day

StarterPack MAsThe Starter Moving Averages indicator is a clean and efficient tool designed to help traders identify market direction, momentum, and potential reversal points using dynamic moving averages. Built for clarity and precision, it combines multiple timeframes and visual signals to simplify decision-making without overloading your chart.
You can choose between EMA or SMA and set up to four custom lengths — by default: 9, 21, 50, and 200. These settings cover short-, medium-, and long-term trends, allowing you to analyze price behavior from scalping setups to major market cycles.
The script also includes optional higher-timeframe MAs, so you can align lower-timeframe entries with the overall market bias. For example, a bullish crossover on the 5-minute chart becomes more powerful when the higher timeframe MAs also point upward.
To make it even more intuitive, the indicator offers:
Automatic bar coloring based on MA alignment (green for uptrend, red for downtrend).
Crossover signals (MA1 crossing MA2) plotted directly on the chart, highlighting potential entry or exit zones.
Alert conditions ready to use — so you can be notified instantly when bullish or bearish crosses occur.
This indicator is highly adaptable for different trading styles — whether you’re a scalper, day trader, or swing trader. Its main goal is to help you quickly read the market structure and follow price action with discipline and consistency.
How to use:
Choose your preferred MA type (EMA or SMA).
Adjust the four MA lengths to fit your strategy.
(Optional) Activate the Higher Timeframe MAs for confluence.
Use color changes and cross signals as a visual guide to confirm trend direction or momentum shifts.
Set alerts to stay informed when a new cross occurs.
The Starter MAs indicator was created to bring simplicity, accuracy, and structure to your trading approach — a clean tool that helps you focus on what really matters: reading the market clearly and trading with confidence.
Local Hurst Slope [Dynamic Regime]1. HOW THE INDICATOR WORKS (Math → Market Edge)Step
Math
Market Intuition
1. Log-Returns
r_t = log(P_t / P_{t-1})
Removes scale, makes series stationary
2. R/S per τ
R = max(cum_dev) - min(cum_dev)
S = stdev(segment)
Measures memory strength over window τ
3. H(τ) = log(R/S) / log(τ)
Di Matteo (2007)
H > 0.5 → Trend memory
H < 0.5 → Mean-reversion
4. Slope = dH/d(log τ)
Linear regression of H vs log(τ)
Slope > 0.12 → Trend accelerating
Slope < -0.08 → Reversion emerging
LEADING EDGE: The slope changes 3–20 bars BEFORE price confirms
→ You enter before the crowd, exit before the trap
Slope > +0.12 + Strong Trend = Bullish = Long
Slope +0.05 to +0.12 = Weak Trend = Cautious = Hold/Trail
Slope -0.05 to +0.05 = Random = No Edge
Slope-0.08 to -0.05 = Weak Reversion = Bearish setup = Prepare Short
Slope < -0.08 = Strong Reversion = Bearish= Short
PRO TIPS
Only trade in direction of 200-day SMA
Filters false signals
Avoid trading 3 days before/after earnings
Volatility kills edge
Use on ETFs (SPY, QQQ)
Cleaner than single stocks
Combine with RSI(14)
RSI < 30 + Hurst short = nuclear reversal

Position Size & Drawdown ManagerThis tool is designed to help traders dynamically adjust their position size and drawdown expectations as their trading capital changes over time. It provides a simple and intuitive way to translate backtest results into real-world position sizing decisions.
Purpose and Functionality
The indicator uses your original backtest parameters — including base capital, base drawdown percentage, and base position size — and your current account balance to calculate how your risk profile changes. It presents two main scenarios:
Lock Drawdown %: Keeps your original drawdown percentage fixed and calculates the new position size required.
Lock Position Size: Keeps your position size unchanged and shows how your drawdown percentage will shift.
Why it’s useful
Many traders face the challenge of scaling their strategies as their account grows or shrinks. This tool makes it easy to visualize the relationship between position sizing, capital, and drawdown. It’s particularly valuable for risk management, portfolio rebalancing, and maintaining consistent exposure when transitioning from backtest conditions to live trading.
How it works
The calculations are displayed in a clean, color-coded table that updates dynamically. This allows you to instantly see how capital fluctuations impact your expected drawdown or position size. You can toggle between light and dark themes and highlight important cells for clarity.
Practical use case
Combine this tool with your TradingView strategy results to better interpret your backtests and adjust your real-world trade sizes accordingly. It bridges the gap between simulated performance and actual account management.
Chart example
The chart included focuses only on this indicator, showing the output table and visual layout clearly without additional scripts or overlays.

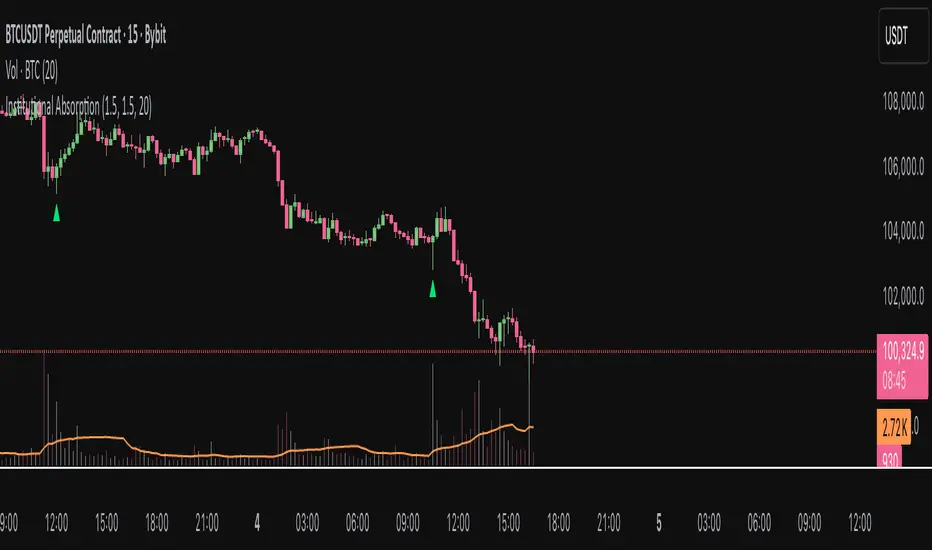
Institutional AbsorptionHighlights potential zones where institutional participants may be absorbing aggressive buying or selling pressure.
It analyzes candle structure and volume to detect possible bullish and bearish absorption events, providing a visual cue for traders studying market imbalance and liquidity dynamics.
The script compares each candle’s wick–body ratio and volume relative to its moving average.
A bullish absorption setup occurs when strong volume appears after a sharp downward move with long lower wicks, while bearish absorption occurs after upward moves with long upper wicks, suggesting the presence of large counter-orders.
+ Features
Detects bullish and bearish absorption candles.
Customizable wick to body ratio and volume multiple thresholds.
Optional filter to require candle color alignment with trend (green/red).
Option to ignore tiny body (doji-like) candles.
+ How to Use
Adjust wick–body ratio, volume multiplier, and lookback length under “Conditions (Absorption)”.
Enable “Require candle color” to strengthen directional context.
Use alerts to receive notifications when new absorption signals appear.
+ Notes
This tool aims to visualize possible absorption behavior, not confirm institutional activity.
Combine it with your broader market structure, volume, or order flow analysis for a more comprehensive analysis.
NSR - Dynamic Linear Regression ChannelOverview
The NSR - Dynamic Linear Regression Channel is a powerful overlay indicator that plots a dynamic regression-based channel around price action. Unlike static channels, this tool continuously recalculates the linear regression trendline from a user-defined starting point and builds upper and lower boundaries using a combination of standard deviation and maximum price deviations (highs/lows).
It visually separates "Premium" (overvalued) and "Discount" (undervalued) zones relative to the regression trend — ideal for mean-reversion, breakout, or trend-following strategies.
Key Features
Dynamic Regression Line Calculates slope, intercept, and average using full lookback from a reset point.
Adaptive Channel Width Combines standard deviation of residuals with max high/low deviations for robust boundaries.
Auto-Reset on Breakout Channel resets when price closes beyond upper/lower band twice in direction of trend .
Visual Zones Blue shaded = Premium (resistance zone)
Red shaded = Discount (support zone)
Real-Time Updates Live channel extends with each bar; historical channels preserved on reset.
How It Works
Regression Calculation
Uses all bars since last reset to compute the best-fit line:
y = intercept + slope × bar_position
Deviation Bands
Statistical : Standard deviation of price from regression line
Structural : Maximum distance from highs to line (upper) and lows to line (lower)
Final band = Regression Line ± (Deviation Input × StdDev)
Channel Reset Logic
Resets when:
Price closes above upper band twice in an uptrend (slope > 0)
OR closes below lower band twice in a downtrend (slope < 0)
Prevents overextension and adapts to new trends.
Visual Output
Active channel updates in real-time
Completed channels saved as historical reference (up to 500 lines/boxes)
Input Parameters
Deviation (2.0) - Multiplier for standard deviation to set channel width
Premium Color - blue color for upper (resistance) zone
Discount Color - red color for lower (support) zone
Best Use Cases
Mean Reversion - Buy near lower band in uptrend, sell near upper band
Breakout Trading - Enter on confirmed close beyond band + volume
Trend Confirmation - Use slope direction + price position in channel
Stop Loss / Take Profit - Place stops beyond opposite band
Pro Tips
Use on higher timeframes (4H, Daily) for cleaner regression fits
Combine with volume or momentum to filter false breakouts
Lower Deviation (e.g., 1.5) for tighter, more responsive channels
Watch channel resets — they often mark significant trend shifts
Why Use DLRC?
"Most channels are static. This one evolves with the market."
The NSR-DLRC gives you a mathematically sound, visually intuitive way to see:
Where price should be (regression)
Where it has been (deviation extremes)
When the trend is breaking structure
Perfect for traders who want regression-based precision without rigid assumptions.
Add to chart → Watch price dance within the evolving trend corridor.

Low and Preceding High (Breakout + Bullis fgv + Extending Fib)🚀 Last Low & Preceding High: Bullish Reversal Strategy
This indicator identifies high-probability long setups by confirming a Bullish Market Structure Shift (BMS) coupled with a strong momentum filter.
🧠 Indicator Logic (How It Works)
The core function of this tool is to automatically locate the key structural points that lead to a bullish bias:
Structure Identification: It first defines a Range between the two most recent Pivot Lows. Within this range, it finds the Preceding High (the highest close before the current low) and the true Low Anchor (the lowest low/tail of the pivot low).
Breakout and Momentum Filter: A valid signal requires two conditions to be met on the current bar:
Bullish Breakout: The price must close above the Preceding High.
Marubozu Confirmation: A strong Bullish Marubozu candle (minimal wicks) must be present in the impulse move from the low, filtering for institutional strength.
Fibonacci Discount Zones: Upon confirmation, the indicator calculates and plots the discount zones (0.50, 0.618, 0.786) using the true extremes (tail-to-tail anchors). These zones start extending from the breakout candle and represent high-value areas for potential entries.
🎯 Entry and Risk Management
The strategy provides clear rules for execution once the logic is confirmed:
Entry Execution:
Wait for Retracement: Enter a Long position when the price retraces back into the colored Discount Zones (0.50 to 0.786).
Risk Control:
🛑 Stop Loss (SL): Placed below the Low Line (the swing low that initiated the move).
✅ Take Profit (TP): Placed above the High Line (the high that was broken).
Final note
"Special thanks to Mr. Mazen (@dr0chart) for developing this strategy."

Session ParmezanForex Session Range Boxes (Asia, Europe, US) — visual intraday session tracker for Forex and metals.
This indicator automatically marks the three major Forex trading sessions — Asian (Tokyo), European (London), and American (New York) — directly on your chart using dynamic colored boxes.
Each box represents the full price range (High–Low) formed during that session, helping traders visualize how volatility and liquidity evolve across the global trading day.
The script is built for intraday traders and session-based strategies, especially those who monitor breakouts from the Asian range or reactions during London–New York overlaps.
⚙️ Features
• Accurate session timing (UTC+3 / Moscow Time) — Asia: 03:00–12:00, Europe: 11:00–20:00, US: 16:00–01:00.
• Dynamic range boxes: each box expands in real time as new highs and lows are set during the session.
• Clear visual separation: each session is shown in its own color (blue for Asia, orange for Europe, green for US).
• Automatic daily reset — new boxes start every new session.
• Intraday focus only — visible up to the 1-hour timeframe (M1–H1) for clarity.
• Transparent design — semi-transparent fills keep candles readable even when sessions overlap.
• Lightweight performance — optimized use of box.new() and var variables avoids lag on lower timeframes.
🧭 Typical Use-Cases
• Identify Asian session ranges and watch for London breakouts or New York reversals.
• Visually align your intraday strategy with session volatility cycles.
• Combine with VWAP, liquidity zones, or market profile indicators for deeper confluence.
• Spot overlapping sessions — often the most active periods of the day.

Smart Money Flow Index (SMFI) - Advanced SMC [PhenLabs]📊Smart Money Flow Index (SMFI)
Version: PineScript™v6
📌Description
The Smart Money Flow Index (SMFI) is an advanced Smart Money Concepts implementation that tracks institutional trading behavior through multi-dimensional analysis. This comprehensive indicator combines volume-validated Order Block detection, Fair Value Gap identification with auto-mitigation tracking, dynamic Liquidity Zone mapping, and Break of Structure/Change of Character detection into a unified system.
Unlike basic SMC indicators, SMFI employs a proprietary scoring algorithm that weighs five critical factors: Order Block strength (validated by volume), Fair Value Gap size and recency, proximity to Liquidity Zones, market structure alignment (BOS/CHoCH), and multi-timeframe confluence. This produces a Smart Money Score (0-100) where readings above 70 represent optimal institutional setup conditions.
🚀Points of Innovation
Volume-Validated Order Block Detection – Only displays Order Blocks when formation candle exceeds customizable volume multiplier (default 1.5x average), filtering weak zones and highlighting true institutional accumulation/distribution
Auto-Mitigation Tracking System – Fair Value Gaps and Order Blocks automatically update status when price mitigates them, with visual distinction between active and filled zones preventing trades on dead levels
Proprietary Smart Money Score Algorithm – Combines weighted factors (OB strength 25%, FVG proximity 20%, Liquidity 20%, Structure 20%, MTF 15%) into single 0-100 confidence rating updating in real-time
ATR-Based Adaptive Calculations – All distance measurements use 14-period Average True Range ensuring consistent function across any instrument, timeframe, or volatility regime without manual recalibration
Dynamic Age Filtering – Automatically removes liquidity levels and FVGs older than configurable thresholds preventing chart clutter while maintaining relevant levels
Multi-Timeframe Confluence Integration – Analyzes higher timeframe bias with customizable multipliers (2-10x) and incorporates HTF trend direction into Smart Money Score for institutional alignment
🔧Core Components
Order Block Engine – Detects institutional supply/demand zones using characteristic patterns (down-move-then-strong-up for bullish, up-move-then-strong-down for bearish) with minimum volume threshold validation, tracks mitigation when price closes through zones
Fair Value Gap Scanner – Identifies price imbalances where current candle's low/high leaves gap with two-candle-prior high/low, filters by minimum size percentage, monitors 50% fill for mitigation status
Liquidity Zone Mapper – Uses pivot high/low detection with configurable lookback to mark swing points where stop losses cluster, extends horizontal lines to visualize sweep targets, manages lifecycle through age-based removal
Market Structure Analyzer – Tracks pivot progression to identify trend through higher-highs/higher-lows (bullish) or lower-highs/lower-lows (bearish), detects Break of Structure and Change of Character for trend/reversal confirmation
Scoring Calculation Engine – Evaluates proximity to nearest Order Blocks using ATR-normalized distance, assesses FVG recency and distance, calculates liquidity proximity with age weighting, combines structure bias and MTF trend into smoothed final score
🔥Key Features
Customizable Display Limits – Control maximum Order Blocks (1-10), Liquidity Zones (1-10), and FVG age (10-200 bars) to maintain clean charts focused on most relevant institutional levels
Gradient Strength Visualization – All zones render with transparency-adjustable coloring where stronger/newer zones appear more solid and weaker/older zones fade progressively providing instant visual hierarchy
Educational Label System – Optional labels identify each zone type (Bullish OB, Bearish OB, Bullish FVG, Bearish FVG, BOS) with color-coded text helping traders learn SMC concepts through practical application
Real-Time Smart Money Score Dashboard – Top-right table displays current score (0-100) with color coding (green >70, yellow 30-70, red <30) plus trend arrow for at-a-glance confidence assessment
Comprehensive Alert Suite – Configurable notifications for Order Block formation, Fair Value Gap detection, Break of Structure events, Change of Character signals, and high Smart Money Score readings (>70)
Buy/Sell Signal Integration – Automatically plots triangle markers when Smart Money Score exceeds 70 with aligned market structure and fresh Order Block detection providing clear entry signals
🎨Visualization
Order Block Boxes – Shaded rectangles extend from formation bar spanning high-to-low of institutional candle, bullish zones in green, bearish in red, with customizable transparency (80-98%)
Fair Value Gap Zones – Rectangular areas marking imbalances, active FVGs display in bright colors with adjustable transparency, mitigated FVGs switch to gray preventing trades on filled zones
Liquidity Level Lines – Dashed horizontal lines extend from pivot creation points, swing highs in bearish color (short targets above), swing lows in bullish color (long targets below), opacity decreases with age
Structure Labels – "BOS" labels appear above/below price when Break of Structure confirmed, colored by direction (green bullish, red bearish), positioned at 1% beyond highs/lows for visibility
Educational Info Panel – Bottom-right table explains key terminology (OB, FVG, BOS, CHoCH) and score interpretation (>70 high probability) with semi-transparent background for readability
📖Usage Guidelines
General Settings
Show Order Blocks – Default: On, toggles visibility of institutional supply/demand zones, disable when focusing solely on FVGs or Liquidity
Show Fair Value Gaps – Default: On, controls FVG zone display including active and mitigated imbalances
Show Liquidity Zones – Default: On, manages liquidity line visibility, disable on lower timeframes to reduce clutter
Show Market Structure – Default: On, toggles BOS/CHoCH label display
Show Smart Money Score – Default: On, controls score dashboard visibility
Order Block Settings
OB Lookback Period – Default: 20, Range: 5-100, controls bars scanned for Order Block patterns, lower values detect recent activity, higher values find older blocks
Min Volume Multiplier – Default: 1.5, Range: 1.0-5.0, sets minimum volume threshold as multiple of 20-period average, higher values (2.0+) filter for strongest institutional candles
Max Order Blocks to Display – Default: 3, Range: 1-10, limits simultaneous Order Blocks shown, lower settings (1-3) maintain focus on most recent zones
Fair Value Gap Settings
Min FVG Size (%) – Default: 0.3, Range: 0.1-2.0, defines minimum gap size as percentage of close price, lower values detect micro-imbalances, higher values focus on significant gaps
Max FVG Age (bars) – Default: 50, Range: 10-200, removes FVGs older than specified bars, lower settings (10-30) for scalping, higher (100-200) for swing trading
Show FVG Mitigation – Default: On, displays filled FVGs in gray providing visual history, disable to show only active untouched imbalances
Liquidity Zone Settings
Liquidity Lookback – Default: 50, Range: 20-200, sets pivot detection period for swing highs/lows, lower values (20-50) mark shorter-term liquidity, higher (100-200) identify major swings
Max Liquidity Age (bars) – Default: 100, Range: 20-500, removes liquidity lines older than specified bars, adjust based on timeframe
Liquidity Sensitivity – Default: 0.5, Range: 0.1-1.0, controls pivot detection sensitivity, lower values mark only major swings, higher values identify minor swings
Max Liquidity Zones to Display – Default: 3, Range: 1-10, limits total liquidity levels shown maintaining chart clarity
Market Structure Settings
Pivot Length – Default: 5, Range: 3-15, defines bars to left/right for pivot validation, lower values (3-5) create sensitive structure breaks, higher (10-15) filter for major shifts
Min Structure Move (%) – Default: 1.0, Range: 0.1-5.0, sets minimum percentage move required between pivots to confirm structure change
Multi-Timeframe Settings
Enable MTF Analysis – Default: On, activates higher timeframe trend analysis incorporation into Smart Money Score
Higher Timeframe Multiplier – Default: 4, Range: 2-10, multiplies current timeframe to determine analysis timeframe (4x on 15min = 1hour)
Visual Settings
Bullish Color – Default: Green (#089981), sets color for bullish Order Blocks, FVGs, and structure elements
Bearish Color – Default: Red (#f23645), defines color for bearish elements
Neutral Color – Default: Gray (#787b86), controls color of mitigated zones and neutral elements
Show Educational Labels – Default: On, displays text labels on zones identifying type (OB, FVG, BOS), disable once familiar with patterns
Order Block Transparency – Default: 92, Range: 80-98, controls Order Block box transparency
FVG Transparency – Default: 92, Range: 80-98, sets Fair Value Gap zone transparency independently from Order Blocks
Alert Settings
Alert on Order Block Formation – Default: On, triggers notification when new volume-validated Order Block detected
Alert on FVG Formation – Default: On, sends alert when Fair Value Gap appears enabling quick response to imbalances
Alert on Break of Structure – Default: On, notifies when BOS or CHoCH confirmed
Alert on High Smart Money Score – Default: On, alerts when Smart Money Score crosses above 70 threshold indicating high-probability setup
✅Best Use Cases
Order Block Retest Entries – After Break of Structure, wait for price retrace into fresh bullish Order Block with Smart Money Score >70, enter long on zone reaction targeting next liquidity level
Fair Value Gap Retracement Trading – When price creates FVG during strong move then retraces, enter as price approaches unfilled gap expecting institutional orders to continue trend
Liquidity Sweep Reversals – Monitor price approaching swing high/low liquidity zones against prevailing Smart Money Score trend, after stop hunt sweep watch for rejection into premium Order Block/FVG
Multi-Timeframe Confluence Setups – Identify alignment when current timeframe Order Block coincides with higher timeframe FVG plus MTF analysis showing matching trend bias
Break of Structure Continuations – After BOS confirms trend direction, trade pullbacks to nearest Order Block or FVG in direction of structure break using Smart Money Score >70 as entry filter
Change of Character Reversal Plays – When CHoCH detected indicating potential reversal, look for Smart Money Score pivot with opposing Order Block formation then enter on structure confirmation
⚠️Limitations
Lagging Pivot Calculations – Pivot-based features (Liquidity Zones, Market Structure) require bars to right of pivot for confirmation, meaning these elements identify levels retrospectively with delay equal to lookback period
Whipsaw in Ranging Markets – During choppy conditions, Order Blocks fail frequently and structure breaks produce false signals as Smart Money Score fluctuates without clear institutional bias, best used in trending markets
Volume Data Dependency – Order Block volume validation requires accurate volume data which may be incomplete on Forex pairs or limited in crypto exchange feeds
Subjectivity in Scoring Weights – Proprietary 25-20-20-20-15 weighting reflects general institutional behavior but may not optimize for specific instruments or market regimes, user cannot adjust factor weights
Visual Complexity on Lower Timeframes – Sub-hour timeframes generate excessive zones creating cluttered charts, requires aggressive display limit reduction and higher minimum thresholds
No Fundamental Integration – Indicator analyzes purely technical price action and volume without incorporating economic events, news catalysts, or fundamental shifts that override technical levels
💡What Makes This Unique
Unified SMC Ecosystem – Unlike indicators displaying Order Blocks OR FVGs OR Liquidity separately, SMFI combines all three institutional concepts plus market structure into single cohesive system
Proprietary Confidence Scoring – Rather than manual setup assessment, automated Smart Money Score quantifies probability by weighting five institutional dimensions into actionable 0-100 rating
Volume-Filtered Quality – Eliminates weak Order Blocks forming without institutional volume confirmation, ensuring displayed zones represent genuine accumulation/distribution
Adaptive Lifecycle Management – Automatically updates mitigation status and removes aged zones preventing trades on dead levels through continuous validity and age monitoring
Educational Integration – Built-in tooltips, labeled zones, and reference panel make indicator functional for both learning Smart Money Concepts and executing strategies
🔬How It Works
Order Block Detection – Scans for patterns where strong directional move follows counter-move creating last down-candle before rally (bullish OB) or last up-candle before sell-off (bearish OB), validates formations only when candle exhibits volume exceeding configurable multiple (default 1.5x) of 20-bar average volume
Fair Value Gap Identification – Compares current candle’s high/low against two-candles-prior low/high to detect price imbalances, calculates gap size as percentage of close and filters micro-gaps below minimum threshold (default 0.3%), monitors whether subsequent price fills 50% triggering mitigation status
Liquidity Zone Mapping – Employs pivot detection using configurable lookback (default 50 bars) to identify swing highs/lows where retail stops cluster, extends horizontal reference lines from pivot creation and applies age-based filtering to remove stale zones
Market Structure Analysis – Tracks pivot progression using structure-specific lookback (default 5 bars) to determine trend, confirms uptrend when new pivot high exceeds previous by minimum move percentage, detects Break of Structure when price breaks recent pivot level, flags Change of Character for potential reversals
Multi-Timeframe Confluence – When enabled, requests security data from higher timeframe (current TF × HTF multiplier, default 4x), compares HTF close against HTF 20-period MA to determine bias, contributes ±50 points to score ensuring alignment with institutional positioning on superior timeframe
Smart Money Score Calculation – Evaluates Order Block component via ATR-normalized distance producing max 100-point contribution weighted at 25%, assesses FVG factor through age penalty and distance at 20% weight, calculates Liquidity proximity at 20%, incorporates structure bias (±50-100 points) at 20%, adds MTF component at 15%, applies 3-period smoothing to reduce volatility
Visual Rendering and Lifecycle – Draws Order Block boxes, Fair Value Gap rectangles with color coding (green/red active, gray mitigated), extends liquidity dashed lines with fade-by-age opacity, plots BOS labels, displays Smart Money Score dashboard, continuously updates checking mitigation conditions and removing elements exceeding age/display limits
💡Note:
The Smart Money Flow Index combines multiple Smart Money Concepts into unified institutional order flow analysis. For optimal results, use the Smart Money Score as confluence filter rather than standalone entry signal – scores above 70 indicate high-probability setups but should be combined with risk management, higher timeframe bias, and market regime understanding.

MIG and MC 发布简介(中文)
MIG and MC 指标帮助日内交易者快速识别微型缺口(Micro Gap)与微型通道(Micro Channel)。脚本支持过滤开盘跳空、合并连续缺口,并自动绘制
FPL(Fair Price Line)延伸线,既可追踪缺口是否被填补,也能直观标注潜在的趋势结构。为了确保跨周期一致性,最新版本对开盘前后和跨日场景做了专门处理
主要特性
- 自动检测并显示看涨/看跌微型缺口,支持按需合并连续缺口。
- 自定义是否忽略开盘缺口、缺口显示范围与 FPL 样式。
- FPL 触及后即停止延伸,辅助研判缺口是否真正回补。
- 内置强收盘与缺口过滤的微型通道识别,可选多种严格程度。
- 适用于 1/5/9 分钟等日内周期,也适用于更长周期。
Recommended English Description
The MIG and MC indicator highlights Micro Gaps and Micro Channels so you can track true intraday imbalances without noise. It merges
consecutive gaps, projects Fair Price Lines (FPL) that stop once touched, and offers a full intraday-ready opening-gap filter so your
early bars stay clean. The latest update refines cross-session handling, giving reliable gap plots on 1-, 5-, and 9-minute charts as well as higher time frames.
Key Features
- Detects bullish and bearish micro gaps with optional gap merging.
- Toggle opening-gap filters and configure look back, visibility, and FPL style.
- FPL lines stop as soon as price revisits the gap, making gap closure obvious.
- Micro Channel mode uses strong-close and gap filters to mark high-quality trend legs.
- Consistent behavior across intraday and higher time frames.

Quantum Leap by GSK-Vizag-AP-IndiaQuantum Leap by GSK-Vizag-AP-India
This indicator detects strong impulse price movements, also known as "quantum leaps," in bullish and bearish directions. Using the Average True Range (ATR) to measure market volatility, it identifies candles with body sizes significantly larger than recent average ranges, suggesting strong momentum surges.
The script groups consecutive impulse candles into blocks, highlighting zones of sustained bullish or bearish strength on the chart. These visual blocks aid traders in quickly spotting powerful price moves that may indicate key market shifts or reversals. Additionally, this tool can be effectively used to identify Fair Value Gaps (FVG) in price action, making FVG detection easier and more intuitive for users.
Inputs allow customization for ATR length, impulse strength threshold, and minimum consecutive candles, enabling adaptation to different markets or timeframes.
Important Disclaimer:
This indicator is for educational and informational purposes only. It is not financial advice and does not guarantee future results. Users should conduct their own research and seek professional guidance before making any trading decisions. Trading involves risk, including the potential loss of capital.
X21The X21 Dynamic Trend Indicator is an adaptive moving average system that combines SMA, EMA, and TEMA to provide real-time trend identification with dynamic color coding. This indicator automatically adjusts its visual presentation based on market conditions, making trend recognition intuitive and immediate.
Key Components
1. TEMA21 (Triple Exponential Moving Average)
Yellow Line - The most responsive trend indicator in the system
Significantly reduces lag compared to traditional moving averages
Formula: TEMA = 3×EMA1 - 3×EMA2 + EMA3
Provides early signals for potential trend changes
Ideal for timing entries and exits with minimal delay
2. SMA21 (Simple Moving Average)
Green Line - Always displayed in green regardless of trend direction
21-period simple moving average of closing prices
Represents the baseline trend reference
Acts as the primary support/resistance level in the system
3. EMA21 (Exponential Moving Average)
Dynamic Color Line - Changes color based on trend strength
Dark Green (#159015): Confirmed uptrend (bullish conditions)
Red (#f50000): Downtrend or weak trend (bearish/neutral conditions)
More responsive than SMA21 due to exponential weighting
Provides faster reaction to recent price movements
4. Dynamic Fill Band (SMA21/EMA21 Envelope)
Color-Coded Zone between SMA21 and EMA21
Light Green (#15e915, 19% transparency): Uptrend zone
Light Red (#f50000, 19% transparency): Downtrend zone
Visualizes the strength and volatility of the current trend
Width of the band indicates trend momentum and volatility
Trend Detection LogicThe indicator uses a dual-confirmation system for trend identification:
Price Position: Close must be above SMA21
Trend Slope: SMA21 must be rising (SMA21 > SMA21 )
Both conditions must be met simultaneously for an uptrend confirmation.This conservative approach reduces false signals and ensures only h
MACD Overlay v1 [JopAlgo]Meet the MACD you can trade directly from the chart.
MACD Overlay v1 doesn’t just plot an oscillator somewhere below—
it puts value, momentum, and participation on your candles, and it refuses to fire inside chop.
When a triangle prints, it’s because energy released (expansion), not because the chart looked cute.
What it is:
An execution-ready MACD overlay with phase gating (Expansion-Only), participation gating (Weakness-Lite), and one-click Classic vs VW-MACD Compare—all adaptive, with minimal inputs.
What’s in v1 (feature set)
Overlay ribbon on price: Fast/Slow MACD value rendered as a price-level ribbon with contextual fill and optional candle tint.
Dual value model: Classic MA-MACD (EMA/SMA) and VW-MACD (Rolling VWAP fast/slow).
Compare mode: A/B Classic vs VW-MACD with a VW ghost ribbon.
Weakness-Lite (1-bar, adaptive): Gates/fades low-participation crosses using
RVOL deficit, Effort-vs-Result failure, and over-extension vs value/ATR (Strict adds wick pressure).
Expansion-Only (Impulse/Squeeze): Triangles print only when a cross coincides with a true-range burst and a histogram-slope ignition out of compression.
Signal hygiene: ±1-bar proximity around crosses, slope awareness, 2-bar debounce.
Explainable filtering: Tiny gray dots show crosses that were intentionally filtered (weak and/or no expansion).
How to use:
Use defaults: Mode Classic, Gate by Weakness ON, Expansion-Only ON, Sensitivity Auto.
Read signals fast:
Solid triangle = cross + expansion confirmed (+ not weak if gate is ON).
Faded triangle = cross + expansion but weak participation (visible only when gate is OFF).
Gray dot = there was a cross, but it was filtered (no genuine expansion or weak & gated).
Validate quickly: Flip Compare to check VW-MACD agreement. Classic + VW alignment usually improves confidence.
Why overlay > sub-pane oscillator
You see where the cross occurs: relative to value, local structure, and S/R, right on price.
The ribbon exposes regime shifts; tint hints expansion vs contraction at a glance.
Execution becomes more context-aware and less “signal-in-a-vacuum.”
Signals & visuals
Triangles (solid): MACD crossed Signal and market showed expansion out of compression; if Gate by Weakness is ON, triangle prints only with acceptable participation.
Triangles (faded): Same as above but weak (shown only when you turn the gate OFF).
Gray dots: Crosses that were filtered (no expansion and/or Weakness gate).
Ribbon: Fast vs Slow value (Classic or VW, according to Mode). Fill and candle tint reflect expansion/contraction.
Inputs
Calculation Mode: Classic | VW | Compare
VW uses Rolling VWAP fast/slow.
Compare: Classic is primary; VW shows as a ghost ribbon for A/B checks.
Gate triangles by Weakness: ON/OFF
Uses RVOL, Effort-vs-Result, extension vs value/ATR (Strict adds wick-pressure).
Sensitivity: Off / Auto / Strict (default Auto).
Expansion-Only (Impulse/Squeeze): ON/OFF
Requires compression → release: tight ribbon + flat momentum, then TR/ATR burst with hist slope flip / cross proximity.
Display: Ribbon / Candle Tint / Weakness Markers.
Advanced (optional): Evaluate Weakness only near signals, Channel (k × |MACD|), Style Preset.
No numeric thresholds to tune—all filters self-calibrate from rolling stats.
Best practices
4H crypto: Defaults are strong—Auto, Gate ON, Expansion-Only ON.
Clean trends: If you feel you miss some tidy resumptions, briefly toggle Expansion-Only OFF.
Choppy regimes: Set Sensitivity → Strict to cut more noise without adding lag.
Confirmation: Use Compare; Classic + VW alignment typically yields better follow-through.
Alerts
MACD Signal Cross Up/Down — execution-grade (use Once per bar close).
Weakness-Lite Flag — optional context alert to help audit filtered crosses.
Attribution & License
Attribution: Based on the algorithmic concept of TradingView’s built-in MACD (fast MA – slow MA, signal, histogram).
No original TradingView source code is redistributed; overlay rendering, VW-MACD, Weakness-Lite, Expansion-Only, gating visuals, and UX are new work.
License: MPL-2.0. Educational purposes only—not financial advice.
