Fuzzy SMA with DCTI Confirmation[FibonacciFlux]FibonacciFlux: Advanced Fuzzy Logic System with Donchian Trend Confirmation
Institutional-grade trend analysis combining adaptive Fuzzy Logic with Donchian Channel Trend Intensity for superior signal quality
Conceptual Framework & Research Foundation
FibonacciFlux represents a significant advancement in quantitative technical analysis, merging two powerful analytical methodologies: normalized fuzzy logic systems and Donchian Channel Trend Intensity (DCTI). This sophisticated indicator addresses a fundamental challenge in market analysis – the inherent imprecision of trend identification in dynamic, multi-dimensional market environments.
While traditional indicators often produce simplistic binary signals, markets exist in states of continuous, graduated transition. FibonacciFlux embraces this complexity through its implementation of fuzzy set theory, enhanced by DCTI's structural trend confirmation capabilities. The result is an indicator that provides nuanced, probabilistic trend assessment with institutional-grade signal quality.
Core Technological Components
1. Advanced Fuzzy Logic System with Percentile Normalization
At the foundation of FibonacciFlux lies a comprehensive fuzzy logic system that transforms conventional technical metrics into degrees of membership in linguistic variables:
// Fuzzy triangular membership function with robust error handling
fuzzy_triangle(val, left, center, right) =>
if na(val)
0.0
float denominator1 = math.max(1e-10, center - left)
float denominator2 = math.max(1e-10, right - center)
math.max(0.0, math.min(left == center ? val <= center ? 1.0 : 0.0 : (val - left) / denominator1,
center == right ? val >= center ? 1.0 : 0.0 : (right - val) / denominator2))
The system employs percentile-based normalization for SMA deviation – a critical innovation that enables self-calibration across different assets and market regimes:
// Percentile-based normalization for adaptive calibration
raw_diff = price_src - sma_val
diff_abs_percentile = ta.percentile_linear_interpolation(math.abs(raw_diff), normLookback, percRank) + 1e-10
normalized_diff_raw = raw_diff / diff_abs_percentile
normalized_diff = useClamping ? math.max(-clampValue, math.min(clampValue, normalized_diff_raw)) : normalized_diff_raw
This normalization approach represents a significant advancement over fixed-threshold systems, allowing the indicator to automatically adapt to varying volatility environments and maintain consistent signal quality across diverse market conditions.
2. Donchian Channel Trend Intensity (DCTI) Integration
FibonacciFlux significantly enhances fuzzy logic analysis through the integration of Donchian Channel Trend Intensity (DCTI) – a sophisticated measure of trend strength based on the relationship between short-term and long-term price extremes:
// DCTI calculation for structural trend confirmation
f_dcti(src, majorPer, minorPer, sigPer) =>
H = ta.highest(high, majorPer) // Major period high
L = ta.lowest(low, majorPer) // Major period low
h = ta.highest(high, minorPer) // Minor period high
l = ta.lowest(low, minorPer) // Minor period low
float pdiv = not na(L) ? l - L : 0 // Positive divergence (low vs major low)
float ndiv = not na(H) ? H - h : 0 // Negative divergence (major high vs high)
float divisor = pdiv + ndiv
dctiValue = divisor == 0 ? 0 : 100 * ((pdiv - ndiv) / divisor) // Normalized to -100 to +100 range
sigValue = ta.ema(dctiValue, sigPer)
DCTI provides a complementary structural perspective on market trends by quantifying the relationship between short-term and long-term price extremes. This creates a multi-dimensional analysis framework that combines adaptive deviation measurement (fuzzy SMA) with channel-based trend intensity confirmation (DCTI).
Multi-Dimensional Fuzzy Input Variables
FibonacciFlux processes four distinct technical dimensions through its fuzzy system:
Normalized SMA Deviation: Measures price displacement relative to historical volatility context
Rate of Change (ROC): Captures price momentum over configurable timeframes
Relative Strength Index (RSI): Evaluates cyclical overbought/oversold conditions
Donchian Channel Trend Intensity (DCTI): Provides structural trend confirmation through channel analysis
Each dimension is processed through comprehensive fuzzy sets that transform crisp numerical values into linguistic variables:
// Normalized SMA Deviation - Self-calibrating to volatility regimes
ndiff_LP := fuzzy_triangle(normalized_diff, norm_scale * 0.3, norm_scale * 0.7, norm_scale * 1.1)
ndiff_SP := fuzzy_triangle(normalized_diff, norm_scale * 0.05, norm_scale * 0.25, norm_scale * 0.5)
ndiff_NZ := fuzzy_triangle(normalized_diff, -norm_scale * 0.1, 0.0, norm_scale * 0.1)
ndiff_SN := fuzzy_triangle(normalized_diff, -norm_scale * 0.5, -norm_scale * 0.25, -norm_scale * 0.05)
ndiff_LN := fuzzy_triangle(normalized_diff, -norm_scale * 1.1, -norm_scale * 0.7, -norm_scale * 0.3)
// DCTI - Structural trend measurement
dcti_SP := fuzzy_triangle(dcti_val, 60.0, 85.0, 101.0) // Strong Positive Trend (> ~85)
dcti_WP := fuzzy_triangle(dcti_val, 20.0, 45.0, 70.0) // Weak Positive Trend (~30-60)
dcti_Z := fuzzy_triangle(dcti_val, -30.0, 0.0, 30.0) // Near Zero / Trendless (~+/- 20)
dcti_WN := fuzzy_triangle(dcti_val, -70.0, -45.0, -20.0) // Weak Negative Trend (~-30 - -60)
dcti_SN := fuzzy_triangle(dcti_val, -101.0, -85.0, -60.0) // Strong Negative Trend (< ~-85)
Advanced Fuzzy Rule System with DCTI Confirmation
The core intelligence of FibonacciFlux lies in its sophisticated fuzzy rule system – a structured knowledge representation that encodes expert understanding of market dynamics:
// Base Trend Rules with DCTI Confirmation
cond1 = math.min(ndiff_LP, roc_HP, rsi_M)
strength_SB := math.max(strength_SB, cond1 * (dcti_SP > 0.5 ? 1.2 : dcti_Z > 0.1 ? 0.5 : 1.0))
// DCTI Override Rules - Structural trend confirmation with momentum alignment
cond14 = math.min(ndiff_NZ, roc_HP, dcti_SP)
strength_SB := math.max(strength_SB, cond14 * 0.5)
The rule system implements 15 distinct fuzzy rules that evaluate various market conditions including:
Established Trends: Strong deviations with confirming momentum and DCTI alignment
Emerging Trends: Early deviation patterns with initial momentum and DCTI confirmation
Weakening Trends: Divergent signals between deviation, momentum, and DCTI
Reversal Conditions: Counter-trend signals with DCTI confirmation
Neutral Consolidations: Minimal deviation with low momentum and neutral DCTI
A key innovation is the weighted influence of DCTI on rule activation. When strong DCTI readings align with other indicators, rule strength is amplified (up to 1.2x). Conversely, when DCTI contradicts other indicators, rule impact is reduced (as low as 0.5x). This creates a dynamic, self-adjusting system that prioritizes high-conviction signals.
Defuzzification & Signal Generation
The final step transforms fuzzy outputs into a precise trend score through center-of-gravity defuzzification:
// Defuzzification with precise floating-point handling
denominator = strength_SB + strength_WB + strength_N + strength_WBe + strength_SBe
if denominator > 1e-10
fuzzyTrendScore := (strength_SB * STRONG_BULL + strength_WB * WEAK_BULL +
strength_N * NEUTRAL + strength_WBe * WEAK_BEAR +
strength_SBe * STRONG_BEAR) / denominator
The resulting FuzzyTrendScore ranges from -1.0 (Strong Bear) to +1.0 (Strong Bull), with critical threshold zones at ±0.3 (Weak trend) and ±0.7 (Strong trend). The histogram visualization employs intuitive color-coding for immediate trend assessment.
Strategic Applications for Institutional Trading
FibonacciFlux provides substantial advantages for sophisticated trading operations:
Multi-Timeframe Signal Confirmation: Institutional-grade signal validation across multiple technical dimensions
Trend Strength Quantification: Precise measurement of trend conviction with noise filtration
Early Trend Identification: Detection of emerging trends before traditional indicators through fuzzy pattern recognition
Adaptive Market Regime Analysis: Self-calibrating analysis across varying volatility environments
Algorithmic Strategy Integration: Well-defined numerical output suitable for systematic trading frameworks
Risk Management Enhancement: Superior signal fidelity for risk exposure optimization
Customization Parameters
FibonacciFlux offers extensive customization to align with specific trading mandates and market conditions:
Fuzzy SMA Settings: Configure baseline trend identification parameters including SMA, ROC, and RSI lengths
Normalization Settings: Fine-tune the self-calibration mechanism with adjustable lookback period, percentile rank, and optional clamping
DCTI Parameters: Optimize trend structure confirmation with adjustable major/minor periods and signal smoothing
Visualization Controls: Customize display transparency for optimal chart integration
These parameters enable precise calibration for different asset classes, timeframes, and market regimes while maintaining the core analytical framework.
Implementation Notes
For optimal implementation, consider the following guidance:
Higher timeframes (4H+) benefit from increased normalization lookback (800+) for stability
Volatile assets may require adjusted clamping values (2.5-4.0) for optimal signal sensitivity
DCTI parameters should be aligned with chart timeframe (higher timeframes require increased major/minor periods)
The indicator performs exceptionally well as a trend filter for systematic trading strategies
Acknowledgments
FibonacciFlux builds upon the pioneering work of Donovan Wall in Donchian Channel Trend Intensity analysis. The normalization approach draws inspiration from percentile-based statistical techniques in quantitative finance. This indicator is shared for educational and analytical purposes under Attribution-NonCommercial-ShareAlike 4.0 International (CC BY-NC-SA 4.0) license.
Past performance does not guarantee future results. All trading involves risk. This indicator should be used as one component of a comprehensive analysis framework.
Shout out @DonovanWall
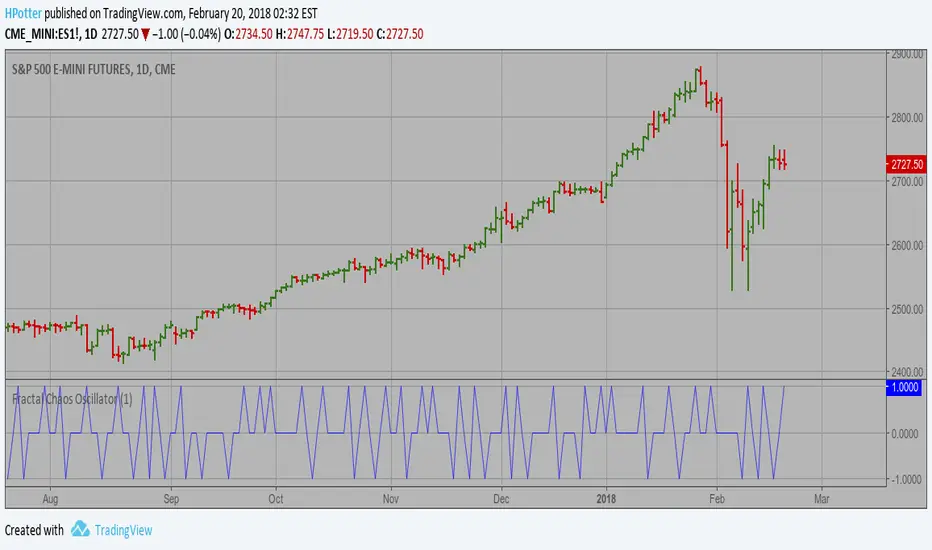
Ocillator


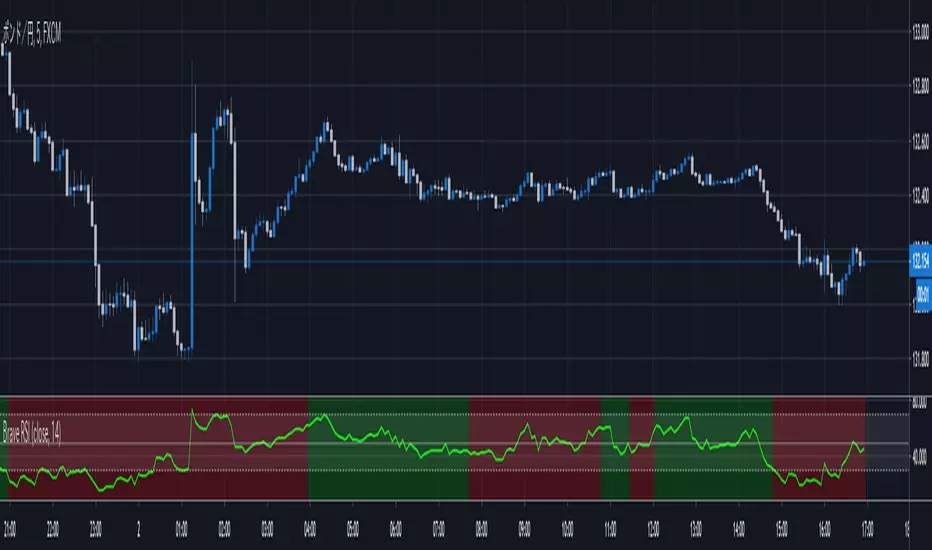
Brave RSICreated so that the background color changes according to the trend and is compatible with Brave Band.
Two lines are displayed at the top and bottom, the timing of inversion at the upper and lower limits,
It also serves as a guide for buying and selling on the intermediate line.
Fractal Chaos Oscillator The value of Fractal Chaos Oscillator is calculated as the difference between
the most subtle movements of the market. In general, its value moves between
-1.000 and 1.000. The higher the value of the Fractal Chaos Oscillator, the
more one can say that it follows a certain trend – an increase in prices trend,
or a decrease in prices trend.
Being an indicator expressed in a numeric value, traders say that this is an
indicator that puts a value on the trendiness of the markets. When the FCO reaches
a high value, they initiate the “buy” operation, contrarily when the FCO reaches a
low value, they signal the “sell” action. This is an excellent indicator to use in
intra-day trading.