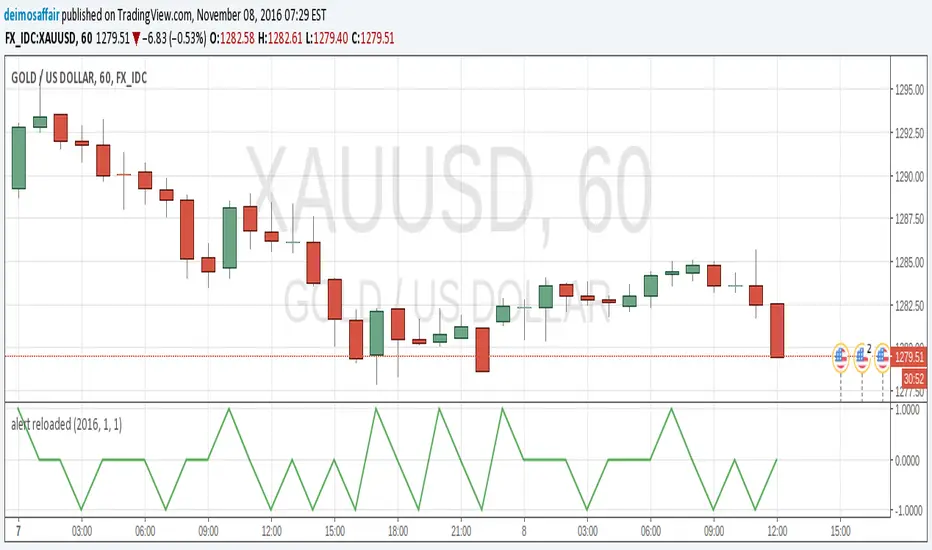
alert reloadedtype: alert creation
required time: 5 minutes
level: easy
Getting alerts for indicators and strats is good to easy the eyes of the charts for a while :)
After my first script itroducing how to do alerts here there is an easier, more clear way to create an alert. It's still good to do it the "old way" to understand/debug an alert, but after that you'll want this extra tool for sure.
I assume you read my previous post, or understand how alerts are set up on a chart.
So, there is this function called alercondition() that does (almost)the whole job for us :)
The function does NOT create the alert automatically, what is does is introducing a new option in the alerts popup. While in the v1.0 of my script the alert was triggered checking for the plot value against 0.9 or -0.9, in this example the alertcondition() function just fires the alert by itself.
Get the script for yourself, in favourites, copy/paste, whatever. Add it to any chart. Then, open the popup to create an alert(the little clock at the top). There will be a drop menu with the options and "Alert reloaded". This is the title provided in the study() parameter. Choose this one.
Now, the second drop menu has the "going UP" and "going DOWN" options. These are the titles from the alertcondition() function. Select one. Make all the aditional choices for the alert you want. Save it.
And that's it, the alert will fire when the conditions become true. You can still keep the plot() for graphical reference, but it's now an extra, removing it will not affect the alert, so more space in the chart. Yey!! :)
Noob
Back to zero: Understanding seriestype: pine series basic example
time required: 10 minutes
level: medium (need to know the "array" data variable as a generic programming concept, basic Pine syntax)
tl;dr how variables and series work in Pine
Pine is an array/vector language. That's something that twists how it behaves, and how we have to think about it. A lot of misunderstandings come from forgetting this fact. This example tries to clear that concept.
First, you need to know what an array is, and how it works in a programmig language. Also, having javascript under your belt helps too. If you don't, google "javascript array basic tutorial" is your friend :)
So, in pine arrays are called "series". Every variable is an array with values for each candle in the chart. if we do:
myVar = true
this is not a constant. It is a series of values for each candle, { true, true,....., true }
In practice, the result is the same, but we can access each of the values in the series, like myVar{0}, myVar{7}, myVar{anyNumber}....
Again, it is not a constant, since you can access/modify the each value individually
so, lets show it:
plot (myVar, clolor = gray)
this plots an horizontal line of value 1 ( 1 is equal to true ) so it's all good.
On to a more usual series:
tipicalSeries = close > open ? true : false
plot(tipicalSeries, color= blue)
This gives the expected result, a tipical up and down line with values at 1 or 0. Naturally, "tipicalSeries" is an array, the "ups" and "downs" are all stored under the same variable, indexed by the candles.
In Pine, the ZERO position in the array is the last one, which corresponds to the last candle on the right. Say you have a chart with 12 candles. The close would be the closing value of what we intuitively think as first candle, the one on the left. then close ... and so on.... until close , the value of the "last" candle, the one on the right. It actually helps to start thinking of the positions backwards, counting down to zero, rocket launch style :)
And back to our series. The myVar will also be the same size, from myVar to myVar .
When we do some operation with them, something simple like
if ( myVar == tipicalSeries)
what is really happening is that internally, Pine is checking each of the indexes, as in myVar == tipicalSeries , myVar == tipicalSeries .... myVar == tipicalSeries
And we can store that stuff to check it. simply:
result = (myVar == tipicalSeries) ? true : false //yes, this is the same as tipicalSeries, but we're not in a boolean logic tut ;)
plot (result)
The reason we can plot the result is that it is an array, not a single value. The example indicator i provide shows a plot where the values are obtained from different places in the array, this line here:
mySeries3 = mySeries2 and mySeries1
this creates a series that is the result of the PREVIOUS values stored (the zero index is the one most at the right, or the "current" one), which here just causes a shift in the plotted line by one candle.
Go ahead, grab a copy of my code, try to change the indexes and see the results. Understanding this stuff is critical to go deeper into Pine :)

Hello World scriptmy first script!!!
took me a couple of hours to put it together, the documentation could be much, much better
