Movingaveragecrossover

ColorFlow EMA📊 ColorFlow EMA — Trend Flow & Bias Indicator
🔹 What This Indicator Does
ColorFlow EMA is a clean, visual trend-flow indicator designed to show directional bias and momentum state at a glance.
It uses two exponential moving averages:
Fast EMA (default: 10)
Slow EMA (default: 20)
The area between the EMAs is color-shaded to clearly display whether price is in a bullish or bearish flow.
🎨 Visual Logic
🔵 Blue shading → Bullish flow
(Fast EMA above Slow EMA)
🔴 Red shading → Bearish flow
(Fast EMA below Slow EMA)
Optional crossover markers can be enabled for visual confirmation when EMA alignment changes.
🧠 How to Use ColorFlow EMA
This indicator is not a standalone strategy and is not intended for signal-chasing.
It is best used as a context and bias filter alongside:
Price action
Market structure (HH/HL, LH/LL)
Support & resistance or supply & demand zones
Pullbacks vs premium/discount
Typical use cases:
Favor longs when the flow is blue
Favor shorts when the flow is red
Avoid forcing trades when EMAs are tangled or flat
Wait for pullbacks into structure instead of chasing price
⚠️ Important Notes
EMA crossovers alone do not guarantee profitable trades
Market conditions, structure, and location always matter
Works best in trending or transitioning markets
Not designed for ranging/choppy environments without context
⚙️ Customization
EMA lengths can be adjusted
Crossover markers can be toggled on/off
Designed to stay visually clean and uncluttered
🎯 Who This Indicator Is For
Traders who prioritize price action over indicators
Intraday traders (forex, indices, ETFs, stocks)
Traders who want clarity, not noise
📝 Final Thought
ColorFlow EMA answers one simple question:
“Should I be looking for longs or shorts here?”
Use it for bias, not prediction.

Programmers Toolbox of ta LibraryA programmer's "Swiss army knife" for selecting functions from the " ta Library by Trading View " during coding. Illustrates the results of the individual library functions. Adds a few extra features. Extensively and uniquely documented.

3 EMA with Alerts 2025This indicator plots three key EMAs (20, 50, and 200) directly on the chart, making it easy to track short-, medium-, and long-term trends. A color-coded table is displayed in the top-right corner for quick reference.
The script also includes smart alerts that trigger only when the state changes:
• 🔵 EMA 20 crossing above EMA 50 & EMA 200 → Bullish signal
• 🔴 EMA 20 crossing below EMA 50 & EMA 200 → Bearish signal
This tool is designed for traders who want clean visuals, reliable alerts, and simplified trend recognition in 2025 markets.

Institutional Trend & Liquidity Nexus [Pro]Concept & Methodology
The core philosophy of this script is "Confluence Filtering." It does not simply overlay indicators; it forces them to work together. A signal is only valid if it aligns with the macro trend and liquidity structure.
Key Components:
Trend Engine: Uses a combination of EMA (7/21) for fast entries and SMA (200) for macro trend direction. The script includes a logical filter that invalidates Buy signals below the SMA 200 to prevent counter-trend trading.
Liquidity Imbalance (FVG): Automatically detects Fair Value Gaps to identify areas where price is likely to react. Unlike standalone FVG scripts, this module is visually optimized to show support/resistance zones without obscuring price action.
Smart Confluence Zones (Originality):
The script calculates a background "State" based on multiple factors.
Bullish Zone (Green Background): Triggers ONLY when Price > SMA 200 AND RSI > 50 AND Price > Baseline EMA.
Bearish Zone (Red Background): Triggers ONLY when Price < SMA 200 AND RSI < 50 AND Price < Baseline EMA.
This visual aid helps traders stay out of choppy markets and only focus when momentum and trend are aligned.
█ How to Use
Entry: Wait for a "Triangle" signal (Buy/Sell).
Validation: Check the Background Color. Is it highlighting a Confluence Zone?
Example: A Buy Signal inside a Green Confluence Zone is a high-probability setup.
Example: A Buy Signal with no background color suggests weak momentum and should be taken with caution.
Targets: Use the plotted FVG boxes as potential take-profit targets or re-entry zones.

Adaptive Trend SelectorThe Adaptive Trend Selector is a comprehensive trend-following tool designed to automatically identify the optimal moving average crossover strategy. It features adjustable parameters and an integrated backtester that delivers institutional-grade insights into the recommended strategy. The model continuously adapts to new data in real time by evaluating multiple moving average combinations, determining the best performing lengths, and presenting the backtest results in a clear, color-coded table that benchmarks performance against the buy-and-hold strategy.
At its core, the model systematically backtests a wide range of moving average combinations to identify the configuration that maximizes the selected optimization metric. Users can choose to optimize for absolute returns or risk-adjusted returns using the Sharpe, Sortino, or Calmar ratios. Alternatively, users can enable manual optimization to test custom fast and slow moving average lengths and view the corresponding backtest results. The label displays the Compounded Annual Growth Rate (CAGR) of the strategy, with the buy-and-hold CAGR in parentheses for comparison. The table presents the backtest results based on the fast and slow lengths displayed at the top:
Sharpe = CAGR per unit of standard deviation.
Sortino = CAGR per unit of downside deviation.
Calmar = CAGR relative to maximum drawdown.
Max DD = Largest peak-to-trough decline in value.
Beta (β) = Return sensitivity relative to buy-and-hold.
Alpha (α) = Excess annualized risk-adjusted returns.
Win Rate = Ratio of profitable trades to total trades.
Profit Factor = Total gross profit per unit of losses.
Expectancy = Average expected return per trade.
Trades/Year = Average number of trades per year.
This indicator is designed with flexibility in mind, enabling users to specify the start date of the backtesting period and the preferred moving average strategy. Supported strategies include the Exponential Moving Average (EMA), Simple Moving Average (SMA), Wilder’s Moving Average (RMA), Weighted Moving Average (WMA), and Volume-Weighted Moving Average (VWMA). To minimize overfitting, users can define constraints such as a minimum and maximum number of trades per year, as well as an optional optimization margin that prioritizes longer, more robust combinations by requiring shorter-length strategies to exceed this threshold. The table follows an intuitive color logic that enables quick performance comparison against buy-and-hold (B&H):
Sharpe = Green indicates better than B&H, while red indicates worse.
Sortino = Green indicates better than B&H, while red indicates worse.
Calmar = Green indicates better than B&H, while red indicates worse.
Max DD = Green indicates better than B&H, while red indicates worse.
Beta (β) = Green indicates better than B&H, while red indicates worse.
Alpha (α) = Green indicates above 0%, while red indicates below 0%.
Win Rate = Green indicates above 50%, while red indicates below 50%.
Profit Factor = Green indicates above 2, while red indicates below 1.
Expectancy = Green indicates above 0%, while red indicates below 0%.
In summary, the Adaptive Trend Selector is a powerful tool designed to help investors make data-driven decisions when selecting moving average crossover strategies. By optimizing for risk-adjusted returns, investors can confidently identify the best lengths using institutional-grade metrics. While results are based on the selected historical period, users should be mindful of potential overfitting, as past results may not persist under future market conditions. Since the model recalibrates to incorporate new data, the recommended lengths may evolve over time.

TGFA Flexible Alerts Multi-MA CrossoversTGFA Flexible Alerts, Multi-MA Crossovers
Description
Flexible MA crossovers with BUY/SELL alerts, customizable candle colors, and an info box for ATR/volatility insights. Supports EMA/SMA/HMA/VWAP on any chart.
Overview
TGFA Flexible Alerts is a versatile Pine Script indicator for traders seeking customizable moving average (MA) crossovers, visual signals, and quick-reference metrics. It overlays crossover lines (e.g., fast EMA over slow SMA), generates BUY/SELL labels and alerts, colors candles based on themes, and includes an optional info box with ATR bands, support/resistance, and trend projections. Built for any symbol and timeframe (optimized for 1H intraday), it auto-detects Heikin Ashi charts and handles mixed MA types like responsive HMA with lagging EMAs. All logic uses built-in TA functions for reliability—no repainting on confirmed bars.
Key Features
MA Crossover Engine: Configurable lines (EMA, SMA, HMA, VWAP) with dynamic colors (HMA tints green/red based on slope). Enable/disable via inputs.
Invert Signals Toggle: Flips BUY/SELL logic for mixed MA setups (e.g., HMA as fast line over EMA).
Reasoning: Traditional crossovers assume a fast line (low lag) crossing above a slow line (high lag) for buys. HMA's hull design makes it ultra-responsive, so it may "lead" too aggressively—causing premature signals. Inverting aligns it with user intuition (e.g., HMA dipping below then recovering signals strength), reducing false positives in trending markets. Test on your pairs!
Visual Alerts: BUY/SELL labels at crossover price (with optional price display and offset adjustment).
Single MA Overlays: Independent plots for EMA/SMA/HMA/VWAP (length 0 to hide).
Info Box: Real-time table with current price, ±1/2 ATR bands, median price (over lookback), trend (SMA50 slope), volatility % (ATR normalized), support/resistance (recent highs/lows), and reversal projections (tied to SMA50 pivot for up/down bias).
Candle Coloring: 20+ themes (dark/light canvases) for bull/bear/reversal/low-volume bars—e.g., Emerald Blaze greens uptrends, dims on low vol. Toggle off for no changes.
Chart Source Flexibility: Auto-switches to Heikin Ashi if detected; manual override for Regular/HA.
Alerts fire on crossovers/crossunders (custom messages with ticker/interval). Open-source for forking.
How to Use
Add to Chart: Search in TradingView's public library, apply to any symbol (e.g., stocks, forex). Best on 1H for intraday, but works on daily/weekly too.
Setup Crossovers: Choose Line 1/2 types/lengths (e.g., HMA 9 over SMA 20). Enable "Invert Signals" if using HMA—prevents lag mismatches in volatile assets.
Alerts & Labels: Toggle labels for visuals; set TradingView alerts on "Buy"/"Sell" conditions. Use offset for crowded charts.
Info Box Insights: Enable for quick scans—e.g., enter long near support if trend is bullish and price > median. Adjust ATR length (default 14) for sensitivity.
Candle Themes: Pick a scheme (e.g., Neon Pulse for dark mode); it overrides bar colors without altering data.
Customization Tip: For HMA-heavy setups, invert + short lengths (5-9) catch turns early; pair with volume filter in alerts.
Limitations & Disclaimers - Designed for overlay on price charts; may overlap in tight ranges—adjust transparency via styles.
HMA can repaint intra-bar; signals confirm on close. Not back tested for all assets—validate with strategy tester.
Info box projections use SMA(50) as a trend pivot (same for up/down as reference); customize via code for advanced calcs. Candle colors are cosmetic only.
This is an analysis tool, not advice. Trading involves risk; combine with fundamentals/news. Past performance isn't indicative of future results. No liability for losses.
I'm still a newbie, so feedback encouraged!
Thank you!!
ThisGirl

Multi SMA + Golden/Death + Heatmap + BB**Multi SMA (50/100/200) + Golden/Death + Candle Heatmap + BB**
A practical trend toolkit that blends classic 50/100/200 SMAs with clear crossover labels, special 🚀 Golden / 💀 Death Cross markers, and a readable candle heatmap based on a dynamic regression midline and volatility bands. Optional Bollinger Bands are included for context.
* See trend direction at a glance with SMAs.
* Get minimal, de-cluttered labels on important crosses (50↔100, 50↔200, 100↔200).
* Highlight big regime shifts with special Golden/Death tags.
* Read momentum and volatility with the candle heatmap.
* Add Bollinger Bands if you want classic mean-reversion context.
Designed to be lightweight, non-repainting on confirmed bars, and flexible across timeframes.
# What This Indicator Does (plain English)
* **Tracks trend** using **SMA 50/100/200** and lets you optionally compute each SMA on a higher or different timeframe (HTF-safe, no lookahead).
* **Prints labels** when SMAs cross each other (up or down). You can force signals only after bar close to avoid repaint.
* **Marks Golden/Death Crosses** (50 over/under 200) with special labels so major regime changes stand out.
* **Colors candles** with a **heatmap** built from a regression midline and volatility bands—greenish above, reddish below, with a smooth gradient.
* **Optionally shows Bollinger Bands** (basis SMA + stdev bands) and fills the area between them.
* **Includes alert conditions** for Golden and Death Cross so you can automate notifications.
---
# Settings — Simple Explanations
## Source
* **Source**: Price source used to calculate SMAs and Bollinger basis. Default: `close`.
## SMA 50
* **Show 50**: Turn the SMA(50) line on/off.
* **Length 50**: How many bars to average. Lower = faster but noisier.
* **Color 50** / **Width 50**: Visual style.
* **Timeframe 50**: Optional alternate timeframe for SMA(50). Leave empty to use the chart timeframe.
## SMA 100
* **Show 100**: Turn the SMA(100) line on/off.
* **Length 100**: Bars used for the mid-term trend.
* **Color 100** / **Width 100**: Visual style.
* **Timeframe 100**: Optional alternate timeframe for SMA(100).
## SMA 200
* **Show 200**: Turn the SMA(200) line on/off.
* **Length 200**: Bars used for the long-term trend.
* **Color 200** / **Width 200**: Visual style.
* **Timeframe 200**: Optional alternate timeframe for SMA(200).
## Signals (crossover labels)
* **Show crossover signals**: Prints triangle labels on SMA crosses (50↔100, 50↔200, 100↔200).
* **Wait for bar close (confirmed)**: If ON, signals only appear after the candle closes (reduces repaint).
* **Min bars between same-pair signals**: Minimum spacing to avoid duplicate labels from the same SMA pair too often.
* **Trend filter (buy: 50>100>200, sell: 50<100<200)**: Only show bullish labels when SMAs are stacked bullish (50 above 100 above 200), and only show bearish labels when stacked bearish.
### Label Offset
* **Offset mode**: Choose how to push labels away from price:
* **Percent**: Offset is a % of price.
* **ATR x**: Offset is ATR(14) × multiplier.
* **Percent of price (%)**: Used when mode = Percent.
* **ATR multiplier (for ‘ATR x’)**: Used when mode = ATR x.
### Label Colors
* **Bull color** / **Bear color**: Background of triangle labels.
* **Bull label text color** / **Bear label text color**: Text color inside the triangles.
## Golden / Death Cross
* **Show 🚀 Golden Cross (50↑200)**: Show a special “Golden” label when SMA50 crosses above SMA200.
* **Golden label color** / **Golden text color**: Styling for Golden label.
* **Show 💀 Death Cross (50↓200)**: Show a special “Death” label when SMA50 crosses below SMA200.
* **Death label color** / **Death text color**: Styling for Death label.
## Candle Heatmap
* **Enable heatmap candle colors**: Turns the heatmap on/off.
* **Length**: Lookback for the regression midline and volatility measure.
* **Deviation Multiplier**: Band width around the midline (bigger = wider).
* **Volatility basis**:
* **RMA Range** (smoothed high-low range)
* **Stdev** (standard deviation of close)
* **Upper/Middle/Lower color**: Gradient colors for the heatmap.
* **Heatmap transparency (0..100)**: 0 = solid, 100 = invisible.
* **Force override base candles**: Repaint base candles so heatmap stays visible even if your chart has custom coloring.
## Bollinger Bands (optional)
* **Show Bollinger Bands**: Toggle the overlay on/off.
* **Length**: Basis SMA length.
* **StdDev Multiplier**: Distance of bands from the basis in standard deviations.
* **Basis color** / **Band color**: Line colors for basis and bands.
* **Bands fill transparency**: Opacity of the fill between upper/lower bands.
---
# Features & How It Works
## 1) HTF-Safe SMAs
Each SMA can be calculated on the chart timeframe or a higher/different timeframe you choose. The script pulls HTF values **without lookahead** (non-repainting on confirmed bars).
## 2) Crossover Labels (Three Pairs)
* **50↔100**, **50↔200**, **100↔200**:
* **Triangle Up** label when the first SMA crosses **above** the second.
* **Triangle Down** label when it crosses **below**.
* Optional **Trend Filter** ensures only signals aligned with the overall stack (50>100>200 for bullish, 50<100<200 for bearish).
* **Debounce** spacing avoids repeated labels for the same pair too close together.
## 3) Golden / Death Cross Highlights
* **🚀 Golden Cross**: SMA50 crosses **above** SMA200 (often a longer-term bullish regime shift).
* **💀 Death Cross**: SMA50 crosses **below** SMA200 (often a longer-term bearish regime shift).
* Separate styling so they stand out from regular cross labels.
## 4) Candle Heatmap
* Builds a **regression midline** with **volatility bands**; colors candles by their position inside that channel.
* Smooth gradient: lower side → reddish, mid → yellowish, upper side → greenish.
* Helps you see momentum and “where price sits” relative to a dynamic channel.
## 5) Bollinger Bands (Optional)
* Classic **basis SMA** ± **StdDev** bands.
* Light visual context for mean-reversion and volatility expansion.
## 6) Alerts
* **Golden Cross**: `🚀 GOLDEN CROSS: SMA 50 crossed ABOVE SMA 200`
* **Death Cross**: `💀 DEATH CROSS: SMA 50 crossed BELOW SMA 200`
Add these to your alerts to get notified automatically.
---
# Tips & Notes
* For fewer false positives, keep **“Wait for bar close”** ON, especially on lower timeframes.
* Use the **Trend Filter** to align signals with the broader stack and cut noise.
* For HTF context, set **Timeframe 50/100/200** to higher frames (e.g., H1/H4/D) while you trade on a lower frame.
* Heatmap “Length” and “Deviation Multiplier” control smoothness and channel width—tune for your asset’s volatility.

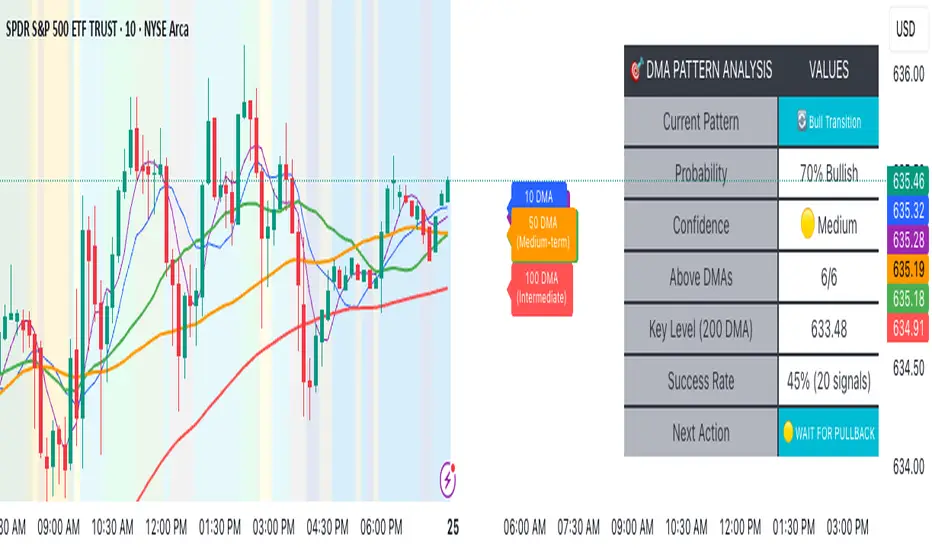
Advanced DMA Pattern Detection SystemAdvanced DMA Pattern Detection System with Smart Intelligence
Professional-grade moving average indicator that combines traditional DMA analysis with advanced pattern recognition and probabilistic forecasting.
Core Features:
6 Key DMAs (5, 10, 20, 50, 100, 200) with descriptive labels showing trading purpose
Advanced Pattern Recognition - Detects Institutional Accumulation, Distribution Phases, Bull/Bear Transitions, and Choppy Markets
Probability Engine - Assigns confidence scores (0-100%) with Low/Medium/High classifications
Historical Validation - Tracks success rate of last 20 pattern signals for real performance data
Smart Alert System - Only triggers on significant pattern changes (20%+ probability shifts)
Dual Display System:
Movable Information Table - Shows current pattern, probability, confidence level, success rate, and recommended action
Chart Alerts & Background Colors - Visual confirmation of high-confidence setups (80%+ patterns)
Traditional DMA Labels - Clear identification of each average's trading significance
Complete Customization:
Master on/off controls for entire system
Individual toggles for all components (DMAs, table, alerts, colors)
Adjustable alert sensitivity (Conservative/Medium/Aggressive)
6 table positions to fit any chart layout
Perfect For: Swing traders, position traders, and anyone wanting systematic trend analysis with quantified probability scores rather than subjective interpretation.
Bottom Line: Transforms basic moving averages into an intelligent trading system that tells you exactly what the market structure means and what to do about it.
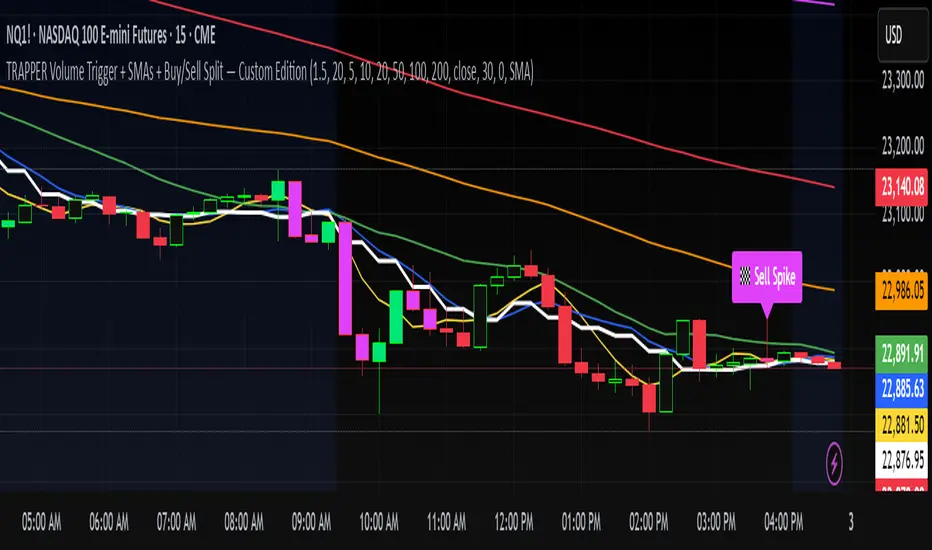
TRAPPER Volume Trigger + SMAs + Buy/Sell SplitThe TRAPPER TRIGGER is a precision-based volume spike indicator designed for intraday traders, scalpers, and swing traders who rely on key volume activity to anticipate sharp market movements. It operates on volume delta logic, detecting disproportionate buying or selling activity that signifies potential market reversals or breakouts.
How It Works:
Volume Spike Logic (Delta-Based)
The script calculates a dynamic volume threshold using a moving average of historical volume data.
It identifies a delta spike by comparing current volume against this threshold—when volume exceeds it significantly, it suggests abnormal activity.
If the candle closes higher than it opens (bullish), the script registers it as a Buy Spike ⚖️.
If the candle closes lower than it opens (bearish), it marks a Sell Spike 🏁.
These are not based on the candle’s body size but the volume differential (delta) between buy/sell pressure inferred from candle direction.
Trigger Labels
Only the most recent buy/sell spike is labeled for clarity, avoiding clutter.
Labels are color-coded to match the candle body (e.g., bright green for bullish, magenta for bearish).
Label style: ⚖️ for Buy Spikes, 🏁 for Sell Spikes.
SMA Suite (Fully Customizable):
Six SMAs: 5 (yellow), 10 (blue), 20 (green), 50 (orange), 100 (red), 200 (white).
Each can be toggled and customized in the script settings for visibility and styling.
Key Benefits
Clean, minimalistic charting — focuses only on high-probability events.
Provides delta-driven insights without requiring access to full L2 order book data.
Works across any timeframe — logic recalculates and resets zones per timeframe switch.
Designed for sniper-style entries—ideal for traders who prefer minimal noise and maximum signal clarity.
Easily extendable with SR zones, AVWAP, liquidity levels, or alerts if desired in future updates.
Who It’s For
Scalpers and intraday traders looking for clean triggers.
Swing traders wanting confirmation of institutional moves.
Volume profile enthusiasts who need a trigger alert system.
Developers who want a base volume framework to build more advanced tools on.
Disclaimer
This script is provided as-is and is intended for educational and informational purposes only. It does not constitute financial advice, investment recommendations, or a solicitation to buy or sell any security or asset.
All trading involves risk. Users should perform their own due diligence and consult with a qualified financial advisor before making any trading decisions. The author of this script assumes no liability for any losses or damages arising from the use or reliance on this tool.
By using this script, you acknowledge and agree that you are solely responsible for your own trading decisions and outcomes.
CAN INDICATORCAN Moving Averages Indicator - Feature Guide
1. Multiple Moving Averages (20 MAs)
- Supports up to 20 individual moving averages
- Each MA can be independently configured:
- Enable/Disable toggle
- Length (period) setting
- Type selection (SMA, EMA, DEMA, VWMA, RMA, WMA)
- Color customization
- Individual timeframe settings when global timeframe is disabled
Pre-configured MA Settings:
1. MA1-8: SMA type
- Lengths: 20, 50, 100, 200, 365, 489, 600, 1460
2. MA9-20: EMA type
- Lengths: 30, 60, 120, 240, 300, 400, 500, 700, 800, 900, 1000, 2000
2. Global Timeframe Settings
Location: Global Settings group
Features:
- Use Global Timeframe: Toggle to use one timeframe for all MAs
- Global Timeframe: Select the timeframe to apply globally
3. Label Display Options
Location: Main Inputs section
Controls:
- Show MA Type: Display MA type (SMA, EMA, etc.)
- Show MA Length: Display period length
- Show Resolution: Display timeframe
- Label Offset: Adjust label position
4. Cross Alerts System
Location: Cross Alerts group
Features:
1. Price Crosses:
- Alerts when price crosses any selected MA
- Select MA to monitor (1-20)
- Triggers on crossover/crossunder
2. MA Crosses:
- Alerts when one MA crosses another
- Select fast MA (1-20)
- Select slow MA (1-20)
- Triggers on crossover/crossunder
5. Relative Strength (RS) Analysis
Location: Relative Strength group
Features:
- Select any MA to monitor (1-20)
- Compares MA to its own average
- Adjustable RS Length (default 14)
- Visual feedback via background color:
- Green: MA above its average (uptrend)
- Red: MA below its average (downtrend)
- Customizable colors and transparency
6. Moving Average Types Available
1. **SMA** (Simple Moving Average)
- Equal weight to all prices
2. **EMA** (Exponential Moving Average)
- More weight to recent prices
3. **DEMA** (Double Exponential Moving Average)
- Reduced lag compared to EMA
4. **VWMA** (Volume Weighted Moving Average)
- Incorporates volume data
5. **RMA** (Running Moving Average)
- Smoother than EMA
6. **WMA** (Weighted Moving Average)
- Linear weight distribution
Usage Tips
1. **For Trend Following:**
- Enable longer-period MAs (MA4-MA8)
- Use cross alerts between long-term MAs
- Monitor RS for trend strength
2. **For Short-term Trading:**
- Focus on shorter-period MAs (MA1-MA3, MA9-MA11)
- Enable price cross alerts
- Use multiple timeframe analysis
3. **For Multiple Timeframe Analysis:**
- Disable global timeframe
- Set different timeframes for each MA
- Compare MA relationships across timeframes
4. **For Performance:**
- Disable unused MAs
- Limit active alerts to necessary pairs
- Use RS selectively on key MAs

Easy MA SignalsEasy MA Signals
Overview
Easy MA Signals is a versatile Pine Script indicator designed to help traders visualize moving average (MA) trends, generate buy/sell signals based on crossovers or custom price levels, and enhance chart analysis with volume-based candlestick coloring. Built with flexibility in mind, it supports multiple MA types, crossover options, and customizable signal appearances, making it suitable for traders of all levels. Whether you're a day trader, swing trader, or long-term investor, this indicator provides actionable insights while keeping your charts clean and intuitive.
Configure the Settings
The indicator is divided into three input groups for ease of use:
General Settings:
Candlestick Color Scheme: Choose from 10 volume-based color schemes (e.g., Sapphire Pulse, Emerald Spark) to highlight high/low volume candles. Select “None” for TradingView’s default colors.
Moving Average Length: Set the MA period (default: 20). Adjust for faster (lower values) or slower (higher values) signals.
Moving Average Type: Choose between SMA, EMA, or WMA (default: EMA).
Show Buy/Sell Signals: Enable/disable signal plotting (default: enabled).
Moving Average Crossover: Select a crossover type (e.g., MA vs VWAP, MA vs SMA50) for signals or “None” to disable.
Volume Influence: Adjust how volume impacts candlestick colors (default: 1.2). Higher values make thresholds stricter.
Signal Appearance Settings:
Buy/Sell Signal Shape: Choose shapes like triangles, arrows, or labels for signals.
Buy/Sell Signal Position: Place signals above or below bars.
Buy/Sell Signal Color: Customize colors for better visibility (default: green for buy, red for sell).
Custom Price Alerts:
Custom Buy/Sell Alert Price: Set specific price levels for alerts (default: 0, disabled). Enter a non-zero value to enable.
Set Up Alerts
To receive notifications (e.g., sound, popup, email) when signals or custom price levels are hit:
Click the Alert button (alarm clock icon) in TradingView.
Select Easy MA Signals as the condition and choose one of the four alert types:
MA Crossover Buy Alert: Triggers on MA crossover buy signals.
MA Crossover Sell Alert: Triggers on MA crossover sell signals.
Custom Buy Alert: Triggers when price crosses above the custom buy price.
Custom Sell Alert: Triggers when price crosses below the custom sell price.
Enable Play Sound and select a sound (e.g., “Bell”).
Set the frequency (e.g., Once Per Bar Close for confirmed signals) and create the alert.
Analyze the Chart
Moving Average Line: Displays the selected MA with color changes (green for bullish, red for bearish, gray for neutral) based on price position relative to the MA.
Buy/Sell Signals: Appear as shapes or labels when crossovers or custom price levels are hit.
Candlestick Colors: If a color scheme is selected, candles change color based on volume strength (high, low, or neutral), aiding in trend confirmation.
Why Use Easy MA Signals?
Easy MA Signals is designed to simplify technical analysis while offering advanced customization. It’s ideal for traders who want:
A clear visualization of MA trends and crossovers.
Flexible signal generation based on MA crossovers or custom price levels.
Volume-enhanced candlestick coloring to identify market strength.
Easy-to-use settings with tooltips for beginners and pros alike.
This script is particularly valuable because it combines multiple features into one indicator, reducing chart clutter and providing actionable insights without overwhelming the user.
Benefits of Easy MA Signals
Highly Customizable: Supports SMA, EMA, and WMA with adjustable lengths.
Offers multiple crossover options (VWAP, SMA10, SMA20, etc.) for tailored strategies.
Custom price alerts allow precise targeting of key levels.
Volume-Based Candlestick Coloring: 10 unique color schemes highlight volume strength, helping traders confirm trends.
Adjustable volume influence ensures adaptability to different markets.
Flexible Signal Visualization: Choose from various signal shapes (triangles, arrows, labels) and positions (above/below bars).
Customizable colors improve visibility on any chart background.
Alert Integration: Built-in alert conditions for crossovers and custom prices support sound, email, and app notifications.
Easy setup for real-time trading decisions.
User-Friendly Design: Organized input groups with clear tooltips make configuration intuitive.
Suitable for beginners and advanced traders alike.
Example Use Cases
Swing Trading with MA Crossovers:
Scenario: A trader wants to trade Bitcoin (BTC/USD) on a 4-hour chart using an EMA crossover strategy.
Setup:
Set Moving Average Type to EMA, Length to 20.
Set Moving Average Crossover to “MA vs SMA50”.
Enable Show Buy/Sell Signals and choose “arrowup” for buy, “arrowdown” for sell.
Select “Emerald Spark” for candlestick colors to highlight volume surges.
Usage: Buy when the EMA20 crosses above the SMA50 (green arrow appears) and volume is high (dark green candles). Sell when the EMA20 crosses below the SMA50 (red arrow). Set alerts for real-time notifications.
Scalping with Custom Price Alerts:
Scenario: A day trader monitors Tesla (TSLA) on a 5-minute chart and wants alerts at specific support/resistance levels.
Setup:
Set Custom Buy Alert Price to 150.00 (support) and Custom Sell Alert Price to 160.00 (resistance).
Use “labelup” for buy signals and “labeldown” for sell signals.
Keep Moving Average Crossover as “None” to focus on price alerts.
Usage: Receive a sound alert and label when TSLA crosses 150.00 (buy) or 160.00 (sell). Use volume-colored candles to confirm momentum before entering trades.
When NOT to Use Easy MA Signals
High-Frequency Trading: Reason: The indicator relies on moving averages and volume, which may lag in ultra-fast markets (e.g., sub-second trades). High-frequency traders may need specialized tools with real-time tick data.
Alternative: Use order book or market depth indicators for faster execution.
Low-Volatility or Sideways Markets:
Reason: MA crossovers and custom price alerts can generate false signals in choppy, range-bound markets, leading to whipsaws.
Alternative: Use oscillators like RSI or Bollinger Bands to trade within ranges.
This indicator is tailored more towards less experienced traders. And as always, paper trade until you are comfortable with how this works if you're unfamiliar with trading! We hope you enjoy this and have great success. Thanks for your interested in Easy MA Signals!

AllMA Trend Radar [trade_lexx]📈 AllMA Trend Radar is your universal trend analysis tool!
📊 What is AllMA Trend Radar?
AllMA Trend Radar is a powerful indicator that uses various types of Moving Averages (MA) to analyze trends and generate trading signals. The indicator allows you to choose from more than 30 different types of moving averages and adjust their parameters to suit your trading style.
💡 The main components of the indicator
📈 Fast and slow moving averages
The indicator uses two main lines:
- Fast MA (blue line): reacts faster to price changes
- Slow MA (red line): smoother, reflects a long-term trend
The combined use of fast and slow MA allows you to get trend confirmation and entry/exit points from the market.
🔄 Wide range of moving averages
There are more than 30 types of moving averages at your disposal:
- SMA: Simple moving average
- EMA: Exponential moving average
- WMA: Weighted moving average
- DEMA: double exponential MA
- TEMA: triple exponential MA
- HMA: Hull Moving Average
- LSMA: Moving average of least squares
- JMA: Eureka Moving Average
- ALMA: Arnaud Legoux Moving Average
- ZLEMA: moving average with zero delay
- And many others!
🔍 Indicator signals
1️⃣ Fast 🆚 Slow MA signals (intersection and ratio of fast and slow MA)
Up/Down signals (intersection)
- Buy (Up) signal:
- What happens: the fast MA crosses the slow MA from bottom to top
- What does the green triangle with the "Buy" label under the candle look
like - What does it mean: a likely upward trend reversal or an uptrend strengthening
- Sell signal (Down):
- What happens: the fast MA crosses the slow MA from top to bottom
- What does it look like: a red triangle with a "Sell" mark above the candle
- What does it mean: a likely downtrend reversal or an increase in the downtrend
Greater/Less signals (ratio)
- Buy signal (Greater):
- What happens: the fast MA becomes higher than the slow MA
- What does it look like: a green triangle with a "Buy" label under the candle
- What does it mean: the formation or confirmation of an uptrend
- Sell signal (Less):
- What happens: the fast MA becomes lower than the slow MA
- What does it look like: a red triangle with a "Sell" mark above the candle
- What does it mean: the formation or confirmation of a downtrend
2️⃣ Signals ⚡️ Fast MA (fast MA and price)
Up/Down signals (intersection)
- Buy signal (Up Fast):
- What happens: the price crosses the fast MA from bottom to top
- What does it look like: a green triangle with a "Buy" label under the candle
- What does it mean: a short-term price growth signal
- Sell signal (Down Fast):
- What happens: the price crosses the fast MA from top to bottom
- What does it look like: a red triangle with a "Sell" label above the candle
- What does it mean: a short-term price drop signal
Greater/Less signals (ratio)
- Buy signal (Greater Fast):
- What happens: the price is getting higher than the fast MA
- What does it look like: a green triangle with a "Buy" label under the candle
- What does it mean: the price is above the fast MA, which indicates an upward movement
- Sell signal (Less Fast):
- What happens: the price is getting lower than the fast MA
- What does it look like: a red triangle with a "Sell" mark above the candle
- What does it mean: the price is under the fast MA, which indicates a downward movement
3️⃣ Signals 🐢 Slow MA (slow MA and price)
Up/Down signals (intersection)
- Buy signal (Up Slow):
- What happens: the price crosses the slow MA from bottom to top
- What does it look like: a green triangle with a "Buy" label under the candle
- What does it mean: a potential medium-term upward trend reversal
- Sell signal (Down Slow):
- What happens: the price crosses the slow MA from top to bottom
- What does it look like: a red triangle with a "Sell" label above the candle
- What does it mean: a potential medium-term downward trend reversal
Greater/Less signals (ratio)
- Buy signal (Greater Slow):
- What happens: the price is getting above the slow MA
- What does it look like: a green triangle with a "Buy" label under the candle
- What does it mean: the price is above the slow MA, which indicates a strong upward movement
- Sell signal (Less Slow):
- What is happening: the price is getting below the slow MA
- What does it look like: a red triangle with a "Sell" mark above the candle
- What does it mean: the price is under the slow MA, which indicates a strong downward movement
🛠 Filters to filter out false signals
1️⃣ Minimum distance between the signals
- What it does: sets the minimum number of candles between signals of the same type
- Why it is needed: it prevents the appearance of too frequent signals, especially during periods of high volatility
- How to set it up: Set a different value for each signal type (default: 3-5 bars)
- Example: if the value is 3 for Up/Down signals, after the buy signal appears, the next buy signal may appear no earlier than 3 bars later
2️⃣ Advanced indicator filters
🔍 RSI Filter
- What it does: Checks the Relative Strength Index (RSI) value before generating a signal
- Why it is needed: it helps to avoid countertrend entries and catch reversal points
- How to set up:
- For buy signals (🔋 Buy): set the RSI range, usually in the oversold zone (for example, 1-30)
- For sell signals (🪫 Sell): set the RSI range, usually in the overbought zone (for example, 70-100)
- Example: if the RSI = 25 (in the range 1-30), the buy signal will be confirmed
📊 MFI Filter (Cash Flow Index)
- What it does: analyzes volumes and the direction of price movement
- Why it is needed: confirms signals with data on the activity of cash flows
- How to set up:
- For buy signals (🔋 Buy): set the MFI range in the oversold zone (for example, 1-25)
- For sell signals (🪫 Sell): set the MFI range in the overbought zone (for example, 75-100)
- Example: if MFI = 80 (in the range of 75-100), the sell signal will be confirmed
📈 Stochastic Filter
- What it does: analyzes the position of the current price relative to the price range
- Why it is needed: confirms signals based on overbought/oversold conditions
- How to configure:
- You can configure the K Length, D Length and Smoothing parameters
- For buy signals (🔋 Buy): set the stochastic range in the oversold zone (for example, 1-20)
- For sell signals (🪫 Sell): set the stochastic range in the overbought zone (for example, 80-100)
- Example: if stochastic = 15 (is in the range of 1-20), the buy signal will be confirmed
🔌 Connecting to trading strategies
The indicator provides various connectors to connect to your trading strategies.:
1️⃣ Individual connectors for each type of signal
- 🔌Fast vs Slow Up/Down MA Signal🔌: signals for the intersection of fast and slow MA
- 🔌Fast vs Slow Greater/Less MA Signal🔌: signals of the ratio of fast and slow MA
- 🔌Fast Up/Down MA Signal🔌: signals of the intersection of price and fast MA
- 🔌Fast Greater/Less MA Signal🔌: signals of the ratio of price and fast MA
- 🔌Slow Up/Down MA Signal🔌: signals of the intersection of price and slow MA
- 🔌Slow Greater/Less MA Signal🔌: Price versus slow MA signals
2️⃣ Combined connectors
- 🔌Combined Up/Down MA Signal🔌: combines all the crossing signals (Up/Down)
- 🔌Combined Greater/Less MA Signal🔌: combines all the signals of the ratio (Greater/Less)
- 🔌Combined All MA Signals🔌: combines all signals (Up/Down and Greater/Less)
❗️ All connectors return values:
- 1: buy signal
- -1: sell signal
- 0: no signal
📚 How to start using AllMA Trend Radar
1️⃣ Selection of types of moving averages
- Add an indicator to the chart
- Select the type and period for the fast MA (default: DEMA with a period of 14)
- Select the type and period for the slow MA (default: SMA with a period of 14)
- Experiment with different types of MA to find the best combination for your trading style
2️⃣ Signal settings
- Turn on the desired signal types (Up/Down, Greater/Less)
- Set the minimum distance between the signals
- Activate and configure the necessary filters (RSI, MFI, Stochastic)
3️⃣ Checking on historical data
- Analyze how the indicator works based on historical data
- Pay attention to the accuracy of the signals and the presence of false alarms
- Adjust the settings if necessary
4️⃣ Introduction to the trading strategy
- Decide which signals will be used to enter the position.
- Determine which signals will be used to exit the position.
- Connect the indicator to your trading strategy through the appropriate connectors
🌟 Practical application examples
Scalping strategy
- Fast MA: TEMA with a period of 8
- Slow MA: EMA with a period of 21
- Active signals: Fast MA Up/Down
- Filters: RSI (range 1-40 for purchases, 60-100 for sales)
- Signal spacing: 3 bars
Strategy for day trading
- Fast MA: TEMA with a period of 10
- Slow MA: SMA with a period of 20
- Active signals: Fast MA Up/Down and Fast vs Slow Greater/Less
- Filters: MFI (range 1-25 for purchases, 75-100 for sales)
- Signal spacing: 5 bars
Swing Trading Strategy
- Fast MA: DEMA with a period of 14
- Slow MA: VWMA with a period of 30
- Active signals: Fast vs Slow Up/Down and Slow MA Greater/Less
- Filters: Stochastic (range 1-20 for purchases, 80-100 for sales)
- Signal spacing: 8 bars
A strategy for positional trading
- Fast MA: HMA with a period of 21
- Slow MA: SMA with a period of 50
- Active signals: Slow MA Up/Down and Fast vs Slow Greater/Less
- Filters: RSI and MFI at the same time
- The distance between the signals: 10 bars
💡 Tips for using AllMA Trend Radar
1. Select the types of MA for market conditions:
- For trending markets: DEMA, TEMA, HMA (fast MA)
- For sideways markets: SMA, WMA, VWMA (smoothed MA)
- For volatile markets: KAMA, AMA, VAMA (adaptive MA)
2. Combine different types of signals:
- Up/Down signals work better when moving from a sideways trend to a directional
one - Greater/Less signals are optimal for fixing a stable trend
3. Use filters effectively:
- The RSI filter works great in trending markets
- MFI filter helps to confirm the strength of volume movement
- Stochastic filter works well in lateral ranges
4. Adjust the minimum distance between the signals:
- Small values (2-3 bars) for short-term trading
- Average values (5-8 bars) for medium-term trading
- Large values (10+ bars) for long-term trading
5. Use combination connectors:
- For more reliable signals, connect the indicator through the combined connectors
💰 With the AllMA Trend Radar indicator, you get a universal trend analysis tool that can be customized for any trading style and timeframe. The combination of different types of moving averages and advanced filters allows you to significantly improve the accuracy of signals and the effectiveness of your trading strategy!

PineVersatilitiesBundleLibrary "PineVersatilitiesBundle"
Versatilities (aka, Versatile Utilities) Pack includes:
- Eighteen Price Variants bundled in a Map,
- Nine Smoothing Variants bundled in a Map,
- Visualisations that indicate on both - pane and chart.
price_variants(lb)
Computes Several different averages using current and previous OHLC values
Parameters:
lb (int) : - lookback distance for combining OHLC values from the past with the present
Returns: Map of Eighteen Uncommon Combinations of single and two-bar OHLC averages (rounded-to-mintick)
dynamic_MA(masrc, malen, lsmaoff, almasgm, almaoff, almaflr)
Dynamically computes Eight different MAs and returns a Map containing Nine MAs
Parameters:
masrc (float) : source series to compute MA
malen (simple int) : lookback distance for MA
lsmaoff (simple int) : optional LSMA offset - default is 0
almasgm (simple float) : optional ALMA sigma - default is 5
almaoff (simple float) : optional ALMA offset - default is 0.5
almaflr (simple bool) : optional ALMA floor flag - default is false
Returns: Map of MAs - 'ALMA', 'EMA', 'HMA', 'LSMA', 'RMA', 'SMA', 'SWMA', 'WMA', 'ALL' (rounded-to-mintick)

Multiple MAsHere's a well-written description in English for your "Multiple MAs" indicator that you can use when publishing on TradingView. It’s concise, professional, and highlights the key features of the indicator while explaining its purpose for traders.
---
### Multiple MAs Indicator
#### Overview
The **Multiple MAs** indicator is a versatile and straightforward tool designed to help traders visualize price trends using multiple Simple Moving Averages (SMAs) on a single chart. By plotting six SMAs with customizable lengths (MA5, MA10, MA20, MA50, MA100, and MA200), this indicator provides a clear view of short-term, medium-term, and long-term trends, making it ideal for trend-following strategies, crossover analysis, and identifying potential support/resistance levels.
#### Features
- **Customizable MA Lengths**: Adjust the periods of all six moving averages (MA5, MA10, MA20, MA50, MA100, MA200) to suit your trading style and timeframe.
- **Distinct Visuals**: Each MA is plotted with a unique color and line width for easy identification:
- MA5 (Dodger Blue, 1px)
- MA10 (Green, 1px)
- MA20 (Red, 2px)
- MA50 (Purple, 3px)
- MA100 (Gray, 3px)
- MA200 (White, 3px)
- **Overlay on Price Chart**: The indicator overlays directly on the price chart, allowing for seamless integration with other technical analysis tools.
- **High Precision**: Displays values with 8-decimal precision, ensuring accuracy for assets with small price movements (e.g., forex pairs or cryptocurrencies).
#### How to Use
1. **Trend Identification**: Use the longer MAs (e.g., MA100, MA200) to determine the overall trend direction. If the price is above these MAs, the trend is likely bullish; if below, it’s likely bearish.
2. **Crossover Signals**: Look for crossovers between shorter MAs (e.g., MA5 crossing MA20) for potential entry or exit signals. For example:
- A bullish signal occurs when a shorter MA crosses above a longer MA.
- A bearish signal occurs when a shorter MA crosses below a longer MA.
3. **Support and Resistance**: MAs often act as dynamic support or resistance levels. Watch for price reactions around these lines, especially the MA50, MA100, and MA200.
4. **Divergence Analysis**: Compare the slope of different MAs to identify potential trend reversals or weakening momentum.
#### Settings
- **MA5 Length**: Default is 5 bars.
- **MA10 Length**: Default is 10 bars.
- **MA20 Length**: Default is 20 bars.
- **MA50 Length**: Default is 50 bars.
- **MA100 Length**: Default is 100 bars.
- **MA200 Length**: Default is 200 bars.
#### Best Practices
- **Timeframe**: This indicator works on any timeframe but is particularly effective on daily, 4-hour, and 1-hour charts for swing trading or trend-following strategies.
- **Combine with Other Tools**: Pair the Multiple MAs with other indicators like RSI, MACD, or volume analysis to confirm signals and avoid false breakouts.
- **Adjust for Volatility**: For highly volatile assets, consider increasing the MA lengths to reduce noise and focus on broader trends.
#### Notes
- The indicator is lightweight and optimized for performance, ensuring it runs smoothly even on lower timeframes.
- Colors and line widths are pre-set for clarity but can be customized in the indicator settings if needed.
#### Credits
Created by kosar_v. Feedback and suggestions are welcome to improve this tool for the TradingView community!

Trend Zone Moving Averages📈 Trend Zone Moving Averages
The Trend Zone Moving Averages indicator helps traders quickly identify market trends using the 50SMA, 100SMA, and 200SMA. With dynamic background colors, customizable settings, and real-time alerts, this tool provides a clear view of bullish, bearish, and extreme trend conditions.
🔹 Features:
Trend Zones with Dynamic Background Colors
Green → Bullish Trend (50SMA > 100SMA > 200SMA, price above 50SMA)
Red → Bearish Trend (50SMA < 100SMA < 200SMA, price below 50SMA)
Yellow → Neutral Trend (Mixed signals)
Dark Green → Extreme Bullish (Price above all three SMAs)
Dark Red → Extreme Bearish (Price below all three SMAs)
Customizable Moving Averages
Toggle 50SMA, 100SMA, and 200SMA on/off from the settings.
Perfect for traders who prefer a cleaner chart.
Real-Time Trend Alerts
Get instant notifications when the trend changes:
🟢 Bullish Zone Alert – When price enters a bullish trend.
🔴 Bearish Zone Alert – When price enters a bearish trend.
🟡 Neutral Zone Alert – When trend shifts to neutral.
🌟 Extreme Bullish Alert – When price moves above all SMAs.
⚠️ Extreme Bearish Alert – When price drops below all SMAs.
✅ Perfect for Any Market
Works on stocks, forex, crypto, and commodities.
Adaptable for day traders, swing traders, and investors.
⚙️ How to Use: Trend Zone Moving Averages Strategy
This strategy helps traders identify and trade with the trend using the Trend Zone Moving Averages indicator. It works across stocks, forex, crypto, and commodities.
🟢 Bullish Trend Strategy (Green Background)
Objective: Look for buying opportunities when the market is in an uptrend.
Entry Conditions:
✅ Background is Green (Bullish Zone).
✅ Price is above the 50SMA (confirming strength).
✅ Price pulls back to the 50SMA and bounces OR breaks above a key resistance level.
Stop Loss:
🔹 Place below the most recent swing low or just under the 50SMA.
Take Profit:
🔹 First target at the next resistance level or recent swing high.
🔹 Second target if price continues higher—trail stops to lock in profits.
🔴 Bearish Trend Strategy (Red Background)
Objective: Look for shorting opportunities when the market is in a downtrend.
Entry Conditions:
✅ Background is Red (Bearish Zone).
✅ Price is below the 50SMA (confirming weakness).
✅ Price pulls back to the 50SMA and rejects OR breaks below a key support level.
Stop Loss:
🔹 Place above the most recent swing high or just above the 50SMA.
Take Profit:
🔹 First target at the next support level or recent swing low.
🔹 Second target if price keeps falling—trail stops to secure profits.
🌟 Extreme Trend Strategy (Dark Green / Dark Red Background)
Objective: Trade with momentum when the market is in a strong trend.
Entry Conditions:
✅ Dark Green Background → Extreme Bullish: Price is above all three SMAs (strong uptrend).
✅ Dark Red Background → Extreme Bearish: Price is below all three SMAs (strong downtrend).
Trade Execution:
🔹 For longs (Dark Green): Look for breakout entries above resistance or pullbacks to the 50SMA.
🔹 For shorts (Dark Red): Look for breakdown entries below support or rejections at the 50SMA.
Risk Management:
🔹 Use tighter stop losses and trail profits aggressively to maximize gains.
🟡 Neutral Trend Strategy (Yellow Background)
Objective: Avoid trading or wait for a breakout.
What to Do:
🔹 Avoid trading in this zone—price is indecisive.
🔹 Wait for confirmation (background turns green/red) before taking a trade.
🔹 Use alerts to notify you when the trend resumes.
📌 Final Tips
Use this strategy with price action for extra confirmation.
Combine with support/resistance levels to improve accuracy.
Set alerts for trend changes so you never miss an opportunity.
Enjoy!

Waldo's RSI Color Trend Candles
TradingView Description for Waldo's RSI Color Trend Candles
Title: Waldo's RSI Color Trend Candles
Short Title: Waldo RSI CTC
Overview:
Waldo's RSI Color Trend Candles is a visually intuitive indicator designed to enhance your trading experience by color-coding candlesticks based on the integration of Relative Strength Index (RSI) momentum and moving average trend analysis. This innovative tool overlays directly on your price chart, providing a clear, color-based representation of market sentiment and trend direction.
What is it?
This indicator combines the power of RSI with the simplicity of moving averages to offer traders a unique way to visualize market conditions:
RSI Integration: The RSI is computed with customizable parameters, allowing traders to adjust how momentum is interpreted. The RSI values influence the primary color of the candles, indicating overbought or oversold market states.
Moving Averages: Utilizing two Simple Moving Averages (SMAs) with user-defined lengths, the indicator helps in identifying trend directions through their crossovers. The fast MA and slow MA can be toggled on/off for visual clarity.
Color Trend Candles: The 'Color Trend Candles' feature uses a dynamic color scheme to reflect different market conditions:
Purple for overbought conditions when RSI exceeds the set threshold (default 70).
Blue for oversold conditions when RSI falls below the set threshold (default 44).
Green indicates a bullish trend, confirmed by both price action and RSI being bullish (fast MA crossing above slow MA, with price above the slow MA).
Red signals a bearish trend, when both price and RSI are bearish (fast MA crossing below slow MA, with price below the slow MA).
Gray for neutral or mixed market sentiment, where signals are less clear or contradictory.
How to Use It:
Waldo's RSI Color Trend Candles is tailored for traders who appreciate visual cues in their trading strategy:
Trend and Momentum Insight: The color of each candle gives an immediate visual representation of both the trend (via MA crossovers) and momentum (via RSI). Green and red candles align with bullish or bearish trends, respectively, providing a quick reference for market direction.
Identifying Extreme Conditions: Purple and blue candles highlight potential reversal zones or areas where the market might be overstretched, offering opportunities for contrarian trades or to anticipate market corrections.
Customization: Users can adjust the RSI length, overbought/oversold levels, and the lengths of the moving averages to align with their trading style or the specific characteristics of the asset they're trading.
This customization ensures the indicator can be tailored to various market conditions.
Simplified Decision Making: Designed for traders who prefer a visual approach, this indicator simplifies the decision-making process by encoding complex market data into an easy-to-understand color system.
However, for a robust trading strategy, it's recommended to use it alongside other analytical tools.
Control Over Display: The option to show or hide moving averages and to enable or disable the color-coding of candles provides users with control over how information is presented, allowing for a cleaner chart or more detailed analysis as preferred.
Conclusion:
Waldo's RSI Color Trend Candles offers a fresh, visually appealing method to interpret market trends and momentum through the color of candlesticks. It's ideal for traders looking for a straightforward way to gauge market sentiment at a glance. While this indicator can significantly enhance your trading setup, remember to incorporate it within a broader strategy, using additional confirmation from other indicators or analysis methods to manage risk and validate trading decisions. Dive into the colorful world of trading with Waldo's RSI Color Trend Candles and let the market's mood guide your trades with clarity and ease.

Dynamic RSI Bollinger Bands with Waldo Cloud
TradingView Indicator Description: Dynamic RSI Bollinger Bands with Waldo Cloud
Title: Dynamic RSI Bollinger Bands with Waldo Cloud
Short Title: Dynamic RSI BB Waldo
Overview:
Introducing an experimental indicator, the Dynamic RSI Bollinger Bands with Waldo Cloud, designed for adventurous traders looking to explore new dimensions in technical analysis. This indicator overlays on your chart, providing a unique perspective by integrating the Relative Strength Index (RSI) with Bollinger Bands, creating a dynamic trading tool that adapts to market conditions through the lens of momentum and volatility.
What is it?
This innovative indicator combines the traditional Bollinger Bands with the RSI in a way that hasn't been commonly explored. Here's a breakdown:
RSI Integration: The RSI is calculated with customizable length settings, and its values are used not just for momentum analysis but as the basis for the Bollinger Bands. This means the position and width of the bands are directly influenced by the RSI, offering a visual representation of momentum within the context of price volatility.
Dynamic Bollinger Bands: Instead of using price directly, the Bollinger Bands are calculated using a scaled version of the RSI. This scaling is done to fit the RSI values into the price range, ensuring the bands are relevant to the actual price movement. The standard deviation for these bands is also scaled accordingly, providing a unique volatility measure that's momentum-driven.
Waldo Cloud: Named after a visual representation concept, the 'Waldo Cloud' refers to the colored area between the Bollinger Bands, which changes based on various conditions:
Purple when RSI is overbought.
Blue when RSI is oversold.
Green for bullish conditions, defined by the fast-moving average crossing above the slow one, RSI is bullish, and the price is above the slow MA.
Red for bearish conditions, when the fast MA crosses below the slow MA, the RSI is bearish, and the price is below the slow MA.
Gray for neutral market conditions.
Moving Averages: Two simple moving averages (Fast MA and Slow MA) are included, which can be toggled on or off, offering additional trend analysis through crossovers.
How to Use It:
Given its experimental nature, this indicator should be used with caution and in conjunction with other analysis methods:
Identifying Market Conditions: Use the color of the Waldo Cloud to gauge market sentiment. A green cloud might suggest a good time to consider long positions, while a red cloud could indicate potential shorting opportunities. Purple and blue clouds highlight extreme conditions that might precede reversals.
Volatility and Momentum: The dynamic nature of the Bollinger Bands based on RSI provides insight into how momentum is affecting price volatility. When the bands are wide, it might indicate high momentum and potential trend continuation or reversal, depending on the RSI's position relative to its overbought/oversold levels.
Trend Confirmation: The moving average crossovers can act as confirmation signals. For instance, a bullish crossover (fast MA over slow MA) within a green cloud might strengthen a buy signal, whereas a bearish crossover in a red cloud might reinforce a sell decision.
Customization: Adjust the RSI length, overbought/oversold levels, and moving average lengths to suit different trading styles or market conditions. Experiment with these settings to find what works best for your strategy.
Combining with Other Indicators: Since this is an experimental tool, it's advisable to use it alongside established indicators like traditional Bollinger Bands, MACD, or trend lines to validate signals.
Conclusion:
The Dynamic RSI Bollinger Bands with Waldo Cloud is an experimental venture into combining momentum with volatility visually and interactively. It's designed for traders who are open to exploring new methods of market analysis.
Remember, due to its experimental status, this indicator should be part of a broader trading strategy, and backtesting or paper trading is recommended before applying it in live trading scenarios. Keep an eye on how the market reacts to the signals provided by this indicator and always consider risk management practices.

Waldo Cloud Bollinger Bands
Waldo Cloud Bollinger Bands Indicator Description for TradingView
Title: Waldo Cloud Bollinger Bands
Short Title: Waldo Cloud BB
Overview:
The Waldo Cloud Bollinger Bands indicator is a sophisticated tool designed for traders looking to combine the volatility analysis of Bollinger Bands with the momentum insights of the Relative Strength Index (RSI) and moving average crossovers. This indicator overlays on your chart, providing a visual representation that helps in identifying potential trading opportunities based on price action, momentum, and trend direction.
Concept:
This indicator merges three key technical analysis concepts:
Bollinger Bands: These are used to measure market volatility. The bands consist of a central moving average (basis) with an upper and lower band that are standard deviations away from this average. In this indicator, you can customize the type of moving average used for the basis (SMA, EMA, SMMA, WMA, VWMA), the length of the period, the source price, and the standard deviation multiplier, offering flexibility to adapt to different market conditions.
Relative Strength Index (RSI): The RSI is incorporated to provide insight into the momentum of price movements. Users can adjust the RSI length and overbought/oversold levels and even choose the price source for RSI calculation, allowing for tailored momentum analysis. The RSI values influence the cloud color between the Bollinger Bands, signaling market conditions.
Moving Average Crossovers: Two moving averages with customizable lengths and types are used to identify trend direction through crossovers. A fast MA (default 20 periods) and a slow MA (default 50 periods) are plotted when enabled, helping to signal potential bullish or bearish market conditions when they cross over each other.
Functionality:
Bollinger Bands Calculation: The basis of the Bollinger Bands is calculated using a user-defined moving average type, with a customizable length, source, and standard deviation multiplier. The upper and lower bands are then plotted around this basis.
RSI Calculation: The RSI is computed using a user-specified source, length, and overbought/oversold levels. This RSI value is used to determine the color of the cloud between the Bollinger Bands, which visually represents market sentiment:
Purple when RSI is overbought.
Blue when RSI is oversold.
Green for bullish conditions (when the fast MA crosses above the slow MA, RSI is bullish, and the price is above the slow MA).
Red for bearish conditions (when the fast MA crosses below the slow MA, RSI is bearish, and the price is below the slow MA).
Gray for neutral conditions.
Trend Analysis: The indicator uses two moving averages to help determine the trend direction.
When the fast MA crosses over the slow MA, it suggests a potential change in trend direction, which, combined with RSI conditions, provides a more comprehensive trading signal.
Customization:
Users can select the type of moving average for all calculations through the "Global MA Type" setting, ensuring consistency in how trends and volatility are interpreted.
The Bollinger Bands settings allow for adjustments in length, source, standard deviation, and offset, giving traders control over how volatility is measured.
RSI settings include the ability to change the RSI source, length, and overbought/oversold thresholds, which can be fine-tuned to match trading strategies.
The option to show or hide moving averages provides clarity on the chart, focusing on either the Bollinger Bands or including the MA crossovers for trend analysis.
Usage:
This indicator is ideal for traders who incorporate both volatility and momentum in their trading decisions.
By observing the color changes in the cloud, along with the position of the price relative to the moving averages, traders can gauge potential entry and exit points.
For instance, a green cloud with a price above the slow MA might suggest a strong buying opportunity, while a red cloud with a price below might indicate selling pressure.
Conclusion:
The Waldo Cloud Bollinger Bands indicator offers a unique blend of volatility, momentum, and trend analysis, providing traders with a multi-faceted view of market conditions. Its customization options make it adaptable to various trading styles and market environments, making it a valuable addition to any trader's toolkit on Trading View.

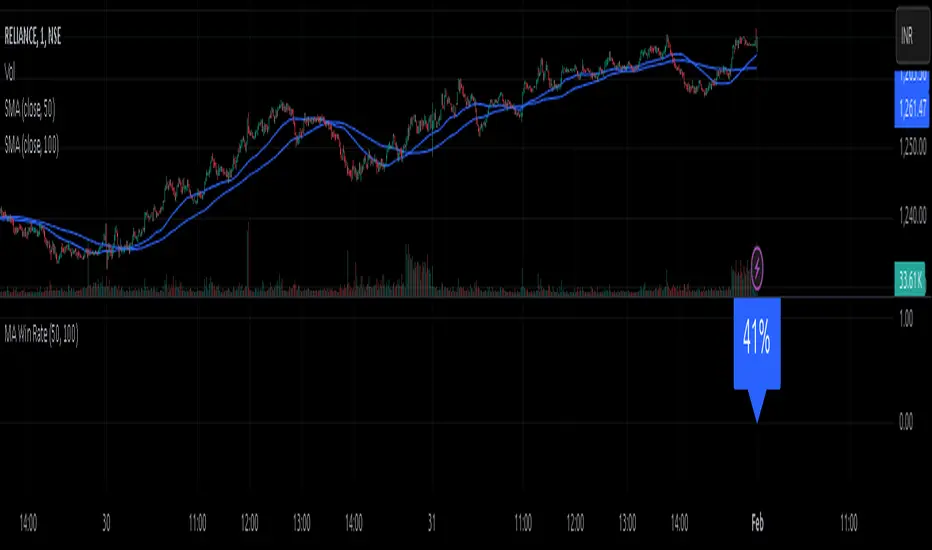
MA Win RateMoving Average Cross Win Rate
This simple yet useful script calculates the percentage of times a moving average crossover successfully predicts price movement.
Win Conditions:
1] A Golden Cross (fast MA crossing above slow MA) where the price moves up afterward.
2] A Death Cross (fast MA crossing below slow MA) where the price moves down afterward.
In this script, I have used a Simple Moving Average (SMA) for illustration.
You can modify the code to apply any type of moving average and test its accuracy.
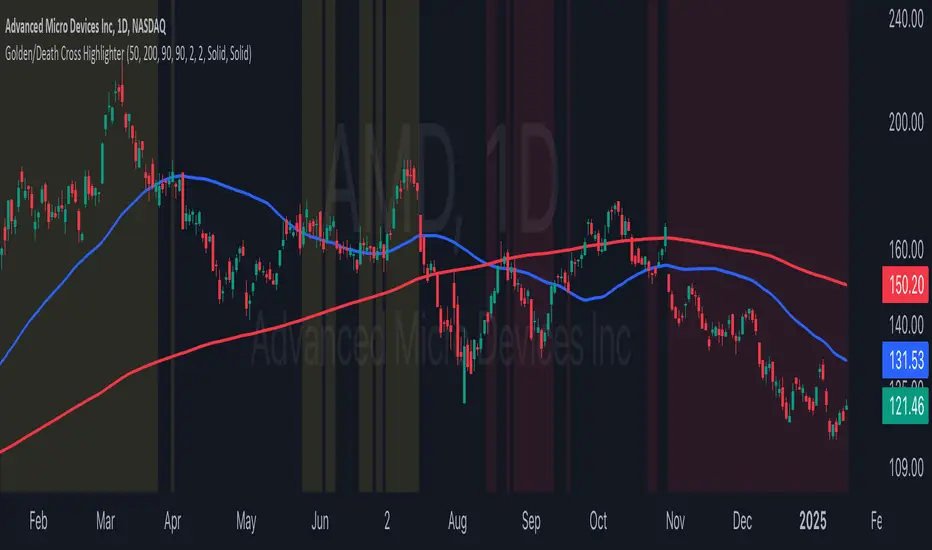
Golden/Death Cross HighlighterThis indicator helps you easily identify and visualize Golden Cross and Death Cross patterns combined with price action confirmation. It highlights chart backgrounds when specific conditions are met, making it easy to spot potential trend changes.
🔑 Key Features:
Highlights Golden Cross conditions (50 SMA crosses above 200 SMA) when price closes above both MAs
Highlights Death Cross conditions (50 SMA crosses below 200 SMA) when price closes below both MAs
Customizable MA lengths (default: 50 and 200)
Adjustable highlight opacity
Built-in alerts for cross events
Clear visualization of both moving averages
📈 Color Guide:
Yellow Background: Golden Cross active + price above both MAs
Red Background: Death Cross active + price below both MAs
⚙️ Settings:
Fast MA Length: Length of faster moving average (default 50)
Slow MA Length: Length of slower moving average (default 200)
Golden Cross Highlight Opacity: Adjust visibility of bullish highlights
Death Cross Highlight Opacity: Adjust visibility of bearish highlights
💡 Usage Tips:
Use in combination with other indicators for confirmation
Set up alerts for potential trend changes
Adjust opacity to match your chart style
Works best on higher timeframes (4H, Daily, Weekly)
Mean Reversion Pro Strategy [tradeviZion]Mean Reversion Pro Strategy : User Guide
A mean reversion trading strategy for daily timeframe trading.
Introduction
Mean Reversion Pro Strategy is a technical trading system that operates on the daily timeframe. The strategy uses a dual Simple Moving Average (SMA) system combined with price range analysis to identify potential trading opportunities. It can be used on major indices and other markets with sufficient liquidity.
The strategy includes:
Trading System
Fast SMA for entry/exit points (5, 10, 15, 20 periods)
Slow SMA for trend reference (100, 200 periods)
Price range analysis (20% threshold)
Position management rules
Visual Elements
Gradient color indicators
Three themes (Dark/Light/Custom)
ATR-based visuals
Signal zones
Status Table
Current position information
Basic performance metrics
Strategy parameters
Optional messages
📊 Strategy Settings
Main Settings
Trading Mode
Options: Long Only, Short Only, Both
Default: Long Only
Position Size: 10% of equity
Starting Capital: $20,000
Moving Averages
Fast SMA: 5, 10, 15, or 20 periods
Slow SMA: 100 or 200 periods
Default: Fast=5, Slow=100
🎯 Entry and Exit Rules
Long Entry Conditions
All conditions must be met:
Price below Fast SMA
Price below 20% of current bar's range
Price above Slow SMA
No existing position
Short Entry Conditions
All conditions must be met:
Price above Fast SMA
Price above 80% of current bar's range
Price below Slow SMA
No existing position
Exit Rules
Long Positions
Exit when price crosses above Fast SMA
No fixed take-profit levels
No stop-loss (mean reversion approach)
Short Positions
Exit when price crosses below Fast SMA
No fixed take-profit levels
No stop-loss (mean reversion approach)
💼 Risk Management
Position Sizing
Default: 10% of equity per trade
Initial capital: $20,000
Commission: 0.01%
Slippage: 2 points
Maximum one position at a time
Risk Control
Use daily timeframe only
Avoid trading during major news events
Consider market conditions
Monitor overall exposure
📊 Performance Dashboard
The strategy includes a comprehensive status table displaying:
Strategy Parameters
Current SMA settings
Trading direction
Fast/Slow SMA ratio
Current Status
Active position (Flat/Long/Short)
Current price with color coding
Position status indicators
Performance Metrics
Net Profit (USD and %)
Win Rate with color grading
Profit Factor with thresholds
Maximum Drawdown percentage
Average Trade value
📱 Alert Settings
Entry Alerts
Long Entry (Buy Signal)
Short Entry (Sell Signal)
Exit Alerts
Long Exit (Take Profit)
Short Exit (Take Profit)
Alert Message Format
Strategy name
Signal type and direction
Current price
Fast SMA value
Slow SMA value
💡 Usage Tips
Consider starting with Long Only mode
Begin with default settings
Keep track of your trades
Review results regularly
Adjust settings as needed
Follow your trading plan
⚠️ Disclaimer
This strategy is for educational and informational purposes only. It is not financial advice. Always:
Conduct your own research
Test thoroughly before live trading
Use proper risk management
Consider your trading goals
Monitor market conditions
Never risk more than you can afford to lose
📋 Release Notes
14 January 2025
Added New Fast & Slow SMA Options:
Fibonacci-based periods: 8, 13, 21, 144, 233, 377
Additional period: 50
Complete Fast SMA options now: 5, 8, 10, 13, 15, 20, 21, 34, 50
Complete Slow SMA options now: 100, 144, 200, 233, 377
Bug Fixes:
Fixed Maximum Drawdown calculation in the performance table
Now using strategy.max_drawdown_percent for accurate DD reporting
Previous version showed incorrect DD values
Performance metrics now accurately reflect trading results
Performance Note:
Strategy tested with Fast/Slow SMA 13/377
Test conducted with 10% equity risk allocation
Daily Timeframe
For Beginners - How to Modify SMA Levels:
Find this line in the code:
fastLength = input.int(title="Fast SMA Length", defval=5, options= )
To add a new Fast SMA period: Add the number to the options list, e.g.,
To remove a Fast SMA period: Remove the number from the options list
For Slow SMA, find:
slowLength = input.int(title="Slow SMA Length", defval=100, options= )
Modify the options list the same way
⚠️ Note: Keep the periods that make sense for your trading timeframe
💡 Tip: Test any new combinations thoroughly before live trading
"Trade with Discipline, Manage Risk, Stay Consistent" - tradeviZion

HOD/LOD/PMH/PML/PDH/PDL Strategy by @tradingbauhaus This script is a trading strategy @tradingbauhaus designed to trade based on key price levels, such as the High of Day (HOD), Low of Day (LOD), Premarket High (PMH), Premarket Low (PML), Previous Day High (PDH), and Previous Day Low (PDL). Below, I’ll explain in detail what the script does:
Core Functionality of the Script:
Calculates Key Price Levels:
HOD (High of Day): The highest price of the current day.
LOD (Low of Day): The lowest price of the current day.
PMH (Premarket High): The highest price during the premarket session (before the market opens).
PML (Premarket Low): The lowest price during the premarket session.
PDH (Previous Day High): The highest price of the previous day.
PDL (Previous Day Low): The lowest price of the previous day.
Draws Horizontal Lines on the Chart:
Plots horizontal lines on the chart for each key level (HOD, LOD, PMH, PML, PDH, PDL) with specific colors for easy visual identification.
Defines Entry and Exit Rules:
Long Entry (Buy): If the price crosses above the PMH (Premarket High) or the PDH (Previous Day High).
Short Entry (Sell): If the price crosses below the PML (Premarket Low) or the PDL (Previous Day Low).
Long Exit: If the price reaches the HOD (High of Day) during a long position.
Short Exit: If the price reaches the LOD (Low of Day) during a short position.
How the Script Works Step by Step:
Calculates Key Levels:
Uses the request.security function to fetch the HOD and LOD of the current day, as well as the highs and lows of the previous day (PDH and PDL).
Calculates the PMH and PML during the premarket session (before 9:30 AM).
Plots Levels on the Chart:
Uses the plot function to draw horizontal lines on the chart representing the key levels (HOD, LOD, PMH, PML, PDH, PDL).
Each level has a specific color for easy identification:
HOD: White.
LOD: Purple.
PDH: Orange.
PDL: Blue.
PMH: Green.
PML: Red.
Defines Trading Rules:
Uses conditions with ta.crossover and ta.crossunder to detect when the price crosses key levels.
Long Entry: If the price crosses above the PMH or PDH, a long position (buy) is opened.
Short Entry: If the price crosses below the PML or PDL, a short position (sell) is opened.
Long Exit: If the price reaches the HOD during a long position, the position is closed.
Short Exit: If the price reaches the LOD during a short position, the position is closed.
Executes Orders Automatically:
Uses the strategy.entry and strategy.close functions to open and close positions automatically based on the defined rules.
Advantages of This Strategy:
Based on Key Levels: Uses important price levels that often act as support and resistance.
Easy to Visualize: Horizontal lines on the chart make it easy to identify levels.
Automated: Entries and exits are executed automatically based on the defined rules.
Limitations of This Strategy:
Dependent on Volatility: Works best in markets with significant price movements.
False Crosses: There may be false crosses that generate incorrect signals.
No Advanced Risk Management: Does not include dynamic stop-loss or take-profit mechanisms.
How to Improve the Strategy:
Add Stop-Loss and Take-Profit: To limit losses and lock in profits.
Filter Signals with Indicators: Use RSI, MACD, or other indicators to confirm signals.
Optimize Levels: Adjust key levels based on the asset’s behavior.
In summary, this script is a trading strategy that operates based on key price levels, such as HOD, LOD, PMH, PML, PDH, and PDL. It is useful for traders who want to trade based on significant support and resistance levels.
