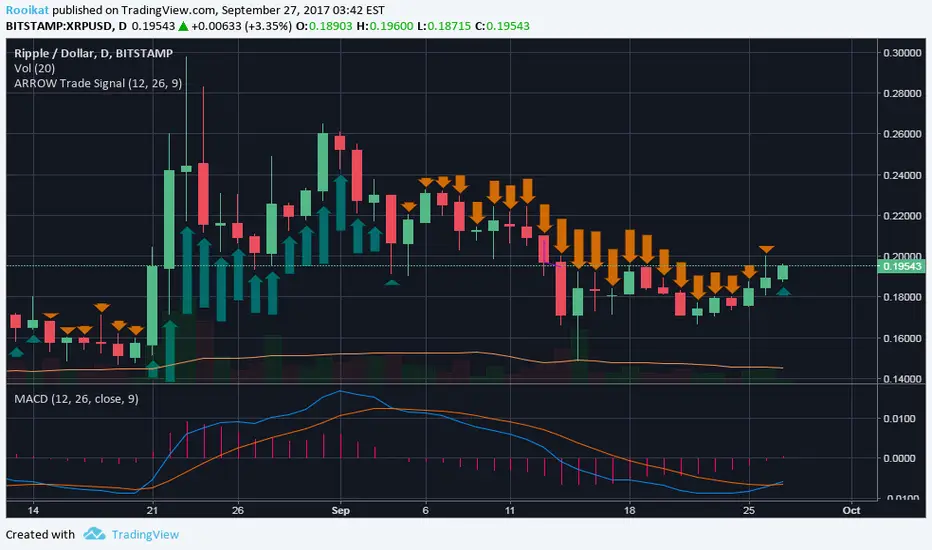
ARROW Trade SignalShort Arrows will indicate beginning of opposite signal. Wait for to confirm by at-least 2 bars. Indicador Pine Script®por Rooikat33330
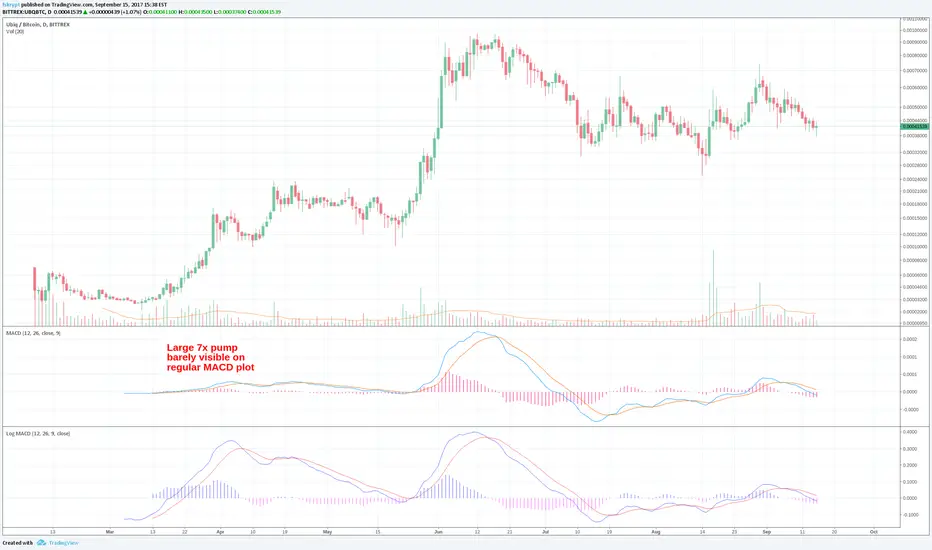
Log-space MACDThis indicator is identical to regular MACD indicator except it is calculated in log space, which is useful for looking at long-term trends.Indicador Pine Script®por fskryptActualizado 22226
Modified MACDThis is a modified version of the MACD (Moving Average Convergence/Divergence) oscillator. Instead of using exponential moving averages this modified version make use of simple moving averages. The default periods for this modified version of MACD is 3/10/16. This modified version of the MACD oscillator is described in detailed in Appendix B in the book The Art and Science of Technical Analysis: Market Structure, Price Action and Trading Strategies by Adam Grimes. Indicador Pine Script®por modhelius22146
Ichimoku Kinko Hyo + HULL-MA_X + MacDThe Ichimoku Kinko Hyo system includes five kinds of signal, of which this strategy uses the most recent of ones i.e. Tenkan Sen / Kijun Sen Cross and price crosses the Kijun Sen. As the Chikou Span, Senkou Span A and Senkou Span B are shifted into the past/future, the trigger signals will be only be used for visual confirmation and not part of the strategy. The Tenkan Sen, also known as the Turning or Conversion line, is a moving average of the highest high and lowest low over the last 9 periods in this strategy. The Kijun Sen, also known as the Standard or Base line, is a moving average of the highest high and lowest low over the last 24 periods in this strategy. The Chikou Span, also known as the Lagging line, is the closing price plotted 24 periods behind in this strategy. The Senkou Span A, also known as the 1st leading line, is a moving average of the Tenkan Sen and Kijun Sen and is plotted 24 periods ahead in this strategy. The Senkou Span B, also known as the 2nd leading line, is a moving average of the highest high and lowest low over the last 51 trading days is plotted 24 periods ahead in this strategy. Moving average convergence divergence (MaCD) is a trend-following momentum indicator that shows the relationship between two moving averages of prices. The MaCD is calculated in this strategy by subtracting the 24-day exponential moving average (EMA) from the 12-day EMA. A nine-day EMA of the MACD, called the "signal line", aMaCD in this case, is then plotted on top of the MaCD. In this strategy, MaCD/ aMaCD Cross is functioning as a trigger for buy and sell signals. As with most technical analysis methods, Ichimoku is likely to produce frequent conflicting signals in non-trending markets, So in addition to Ichimoku Kinko Hyo, the Hull MA is popular amongst some day traders, as the indicator which in combination with MaCD attempts to give an accurate signal by eliminating lags and improving the smoothness of the line. Alan Hull, developed this moving average indicator and hence it’s called the Hull MA. Now, let’s dissect how the Hull moving average is calculated. The Hull MA involves the weighted moving average (WMA) in its calculation. First, calculate the WMA with period (n / 2) and multiply this by 2. Remember ‘n’ is the time period configurable based on the trader’s requirement. The default setting is 12 periods in this strategy, fast Hull MA crossing slow Hull MA will generate a circle on charts. Second, calculate the WMA for period “n” and subtract if from the first step. Thirdly, calculate the weighted moving average with period sqrt (n) using the data from the second step. You can take a look at the below formula: Hull MA= WMA (2*WMA (n/2) − WMA (n)), sqrt (n)) The Hull MA Cross in combination with Tenkan Sen / Kijun Sen Cross and MaCD tries to give an accurate signal by eliminating lags and improve the smoothness of price activity. Please note that price trends can and do change often, so your readings of the charts and this trading system should be probabilistic, rather than predictive. Estrategia Pine Script®por emohilActualizado 99956
MACD Crossover Backtest MACD – Moving Average Convergence Divergence. The MACD is calculated by subtracting a 26-day moving average of a security's price from a 12-day moving average of its price. The result is an indicator that oscillates above and below zero. When the MACD is above zero, it means the 12-day moving average is higher than the 26-day moving average. This is bullish as it shows that current expectations (i.e., the 12-day moving average) are more bullish than previous expectations (i.e., the 26-day average). This implies a bullish, or upward, shift in the supply/demand lines. When the MACD falls below zero, it means that the 12-day moving average is less than the 26-day moving average, implying a bearish shift in the supply/demand lines. A 9-day moving average of the MACD (not of the security's price) is usually plotted on top of the MACD indicator. This line is referred to as the "signal" line. The signal line anticipates the convergence of the two moving averages (i.e., the movement of the MACD toward the zero line). Let's consider the rational behind this technique. The MACD is the difference between two moving averages of price. When the shorter-term moving average rises above the longer-term moving average (i.e., the MACD rises above zero), it means that investor expectations are becoming more bullish (i.e., there has been an upward shift in the supply/demand lines). By plotting a 9-day moving average of the MACD, we can see the changing of expectations (i.e., the shifting of the supply/demand lines) as they occur. You can change long to short in the Input Settings WARNING: - For purpose educate only - This script to change bars colors.Estrategia Pine Script®por HPotter77569
4 Hour MACD (Philip Nel ForexFactory)This is the basic script that shows MACD as described with settings in the thread www.forexfactory.comIndicador Pine Script®por acolytee11138
MACD 4C by vkno422 + signal line - squattterMACD 4C by vkno422 + signal line - squattterIndicador Pine Script®por squattter1313 2.1 K
Hull MACD with Force Index Backcolorswww.tradingview.com Like many other indicators this tells the past and it will dutifully follow the future price changes whatever they will be. This is an upgrade of the "Hull Moving Average Convergence/Divergence" low lag indicator in my scripts. Added Elder Force Index (background colors) to include effects of Volume. When EFI goes positive the background goes green, when it slopes up (more positive than previous bar) it is darker green. Negative red and slope down darker red. I find it useful in all time frames but I use mostly hour and day. The direction color combined with price action and macd tell whether the volume supports the price movement and the shading (darker green for increasing up volume and darker red for increasing down volume) tells of the degree of support. Since when the EFI is positive and dropping, for example, the price can be dropping with opposite for negative. Dark shading tells where the EFI and possibly the price is headed (at the moment). Light shading says to check more on other indications for likely direction. Changed also the histogram color so it stands out of background and added hlines to make relative volatility and peak height easier to see. Anyway help yourself if any of this code is useful to you, enjoy, happy trading and Keep Smiling!Indicador Pine Script®por Tom1trader99445
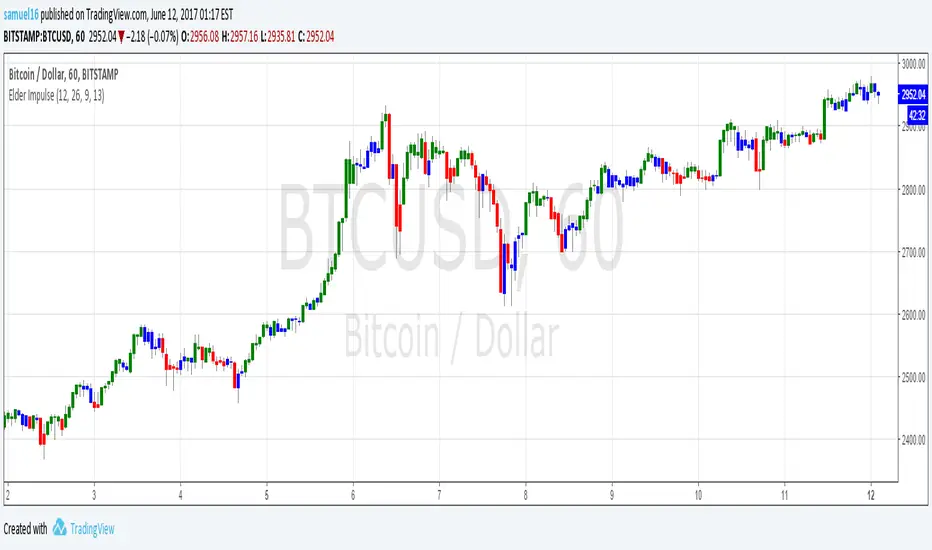
Elder Impulse SystemQuickly Identify Trends with the Elder Impulse Indicator. Pretty much the same as , but written from scratch to be simpler to use and the source code easier to read (no offense, LazyBear) For more info, see stockcharts.com Indicador Pine Script®por astraloverflow2424 3.2 K
Cosmo BB + MACD StrategySignals on upper + lower Bollinger Bands and filter on MACD (high + low)Indicador Pine Script®por pcosmin3365
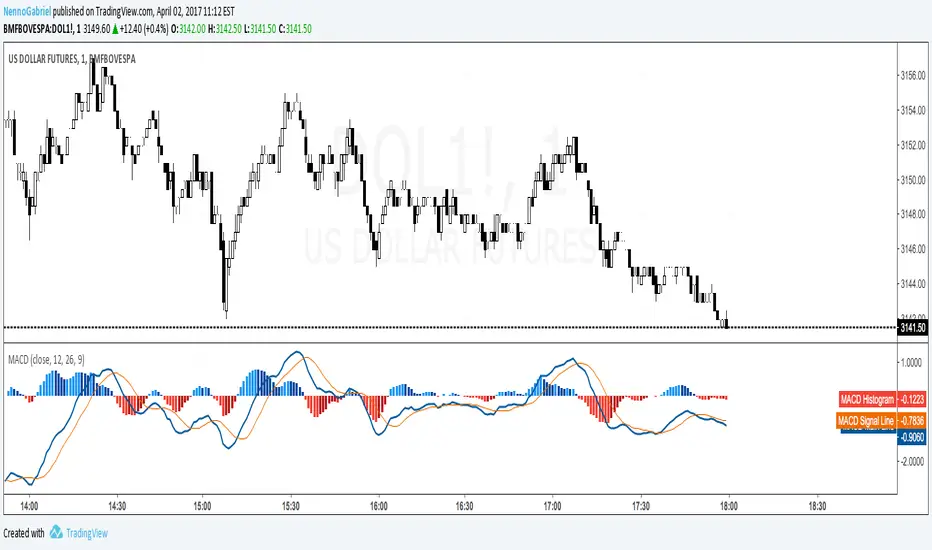
Moving Average Convergence/DivergenceJust a pretty for to show MACD with histogram on the chartIndicador Pine Script®por NennoGabriel427
MACD OverlayMACD Overlay indicator plots the MACD directly on price. This helps you better understand the MACD indicator and filter the false signals.Indicador Pine Script®por n.bhaskar19931818 1.1 K
MACD_TracerSimple Script for a very fast MACD Best used as an Indicator Overlay for studying detailed movement. Indicator over Indicator Using as a Indicator overlay. You must drag and drop an indicator over another indicator. After you have the visual of both indicators in one indicator box, you must go to CHART PROPERTIES and SCALE LEFT . This way both your indicators are scaled to same axis. Analysis Having both indicators allows me the ability to better detect what the indicator is specialized to do. In this case I have one indicator that has strength at detecting Momentum shifts and the other detects Divergences. Indicador Pine Script®por QuantitativeExhaustion1176
EMARCOThis is the study of the ratio of the MACD exponential moving averages, 0.993 and 1.003 were used to define the overextended positions since this is the highest the oscillator usually goes, price tends to reverse when overextended. RE1 (ratio equation 1) = the fast Exponential Moving Average (12 points) divided by the slow Exponential Moving Average (26 points) and RE2 is reciprocal. Here we see that when the RE1 is greater than RE2 price tends to drop and so when the opposite is trueIndicador Pine Script®por DarkMessiah77711116
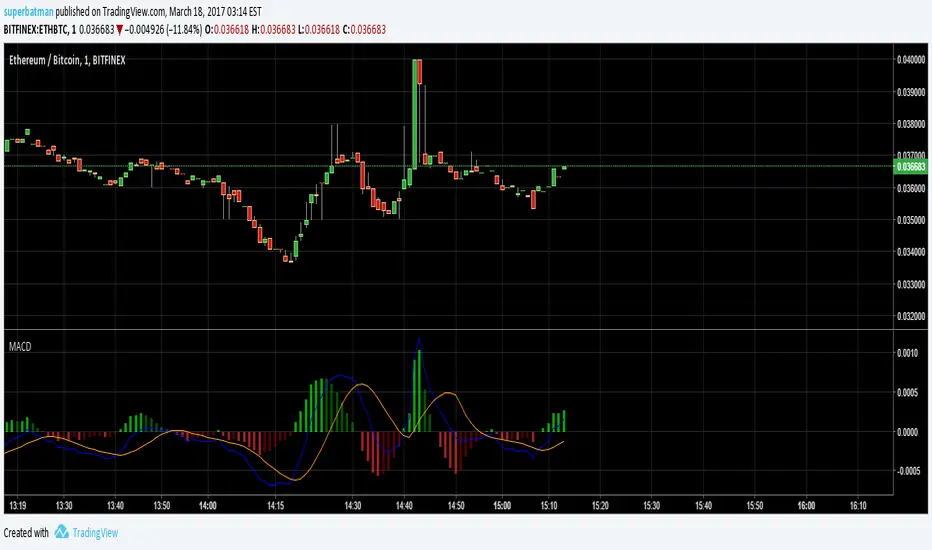
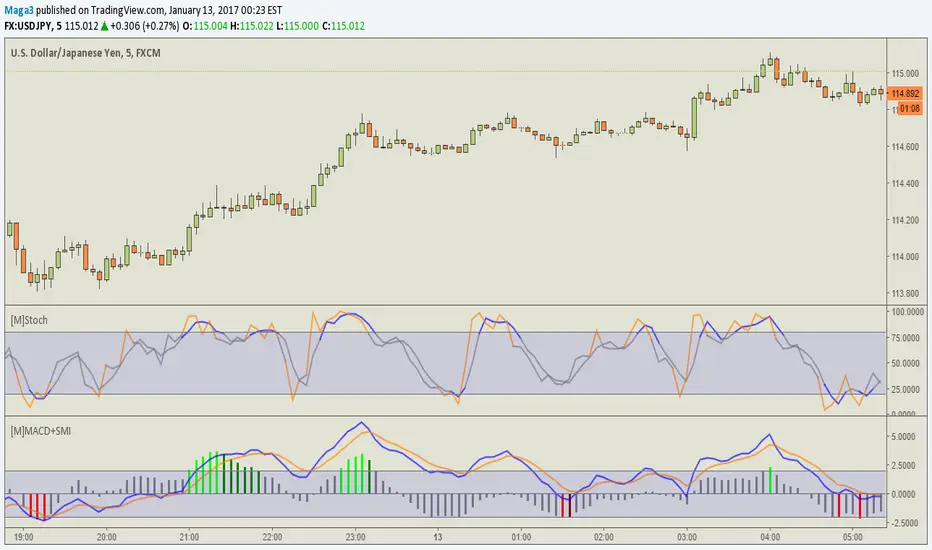
[M] MACD + SMI MACD + SMI -2.23% Ergodic When leaving the zone, MACD is painted in different colors, while in the area - is gray. In the settings you can disable shading in gray or SMI -2.23% . Works on the major currency pairs, the rest has not been tested. Because it did for me) //Google translate ---------------------- МАКД+SMI Ergodic При выходе из зоны, MACD окрашивается в разные цвета, при нахождении в зоне - остается серым. В настройках есть возможность отключить закрашивание в серый или SMI -2.23% . Работает на основных валютных парах, на остальных не тестировался, потому что делал для себя)Indicador Pine Script®por Maga3255
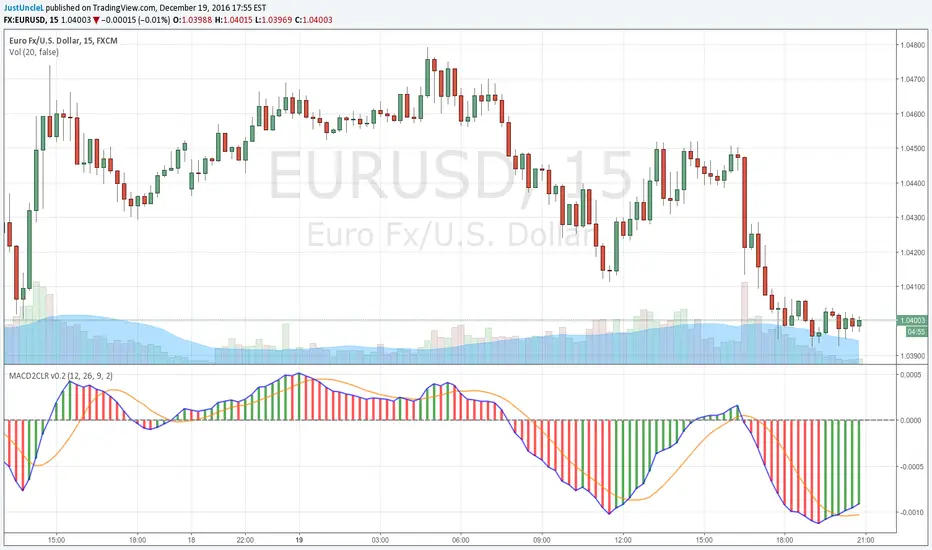
MACD DEUTER 2 colour v0.2 by JustUncleLThis is an updated version of the MACD DEUTER 2 colour indicator. This version includes the Signal line and option to change the length calculating the MACD direction change.Indicador Pine Script®por JustUncleLActualizado 77676
Ergotic MACD Strategy Backtest This is one of the techniques described by William Blau in his book "Momentum, Direction and Divergence" (1995). If you like to learn more, we advise you to read this book. His book focuses on three key aspects of trading: momentum, direction and divergence. Blau, who was an electrical engineer before becoming a trader, thoroughly examines the relationship between price and momentum in step-by-step examples. From this grounding, he then looks at the deficiencies in other oscillators and introduces some innovative techniques, including a fresh twist on Stochastics. On directional issues, he analyzes the intricacies of ADX and offers a unique approach to help define trending and non-trending periods. Blau`s indicator is like usual MACD, but it plots opposite of meaningof stndard MACD indicator. You can change long to short in the Input Settings Please, use it only for learning or paper trading. Do not for real trading.Estrategia Pine Script®por HPotter112
Price Divergence Detector V3 revised by JustUncleLThis is a revised version of the original "Price Divergence Detector by RicardoSantos". Description: Price Divergence detection for various methods : RSI, MACD, STOCH, VOLUME, ACC-DIST, FISHER, CCI, BB %B and Ehlers IdealRSI. Both Hidden and Regular Divergences are detected. Mofidifications: Revision 3.0 by JustUncleL Added option to disable/enable Hidden and Regular Divergence Added new divergence method BB %B (close only) Added new divergence mothos Ehlers IdealRSI (close only) Revision 2.0 - by RicardoSantos References: Information on Divergence Trading: www.babypips.com www.incrediblecharts.com (BB %B) Indicador Pine Script®por JustUncleLActualizado 5858 6.7 K
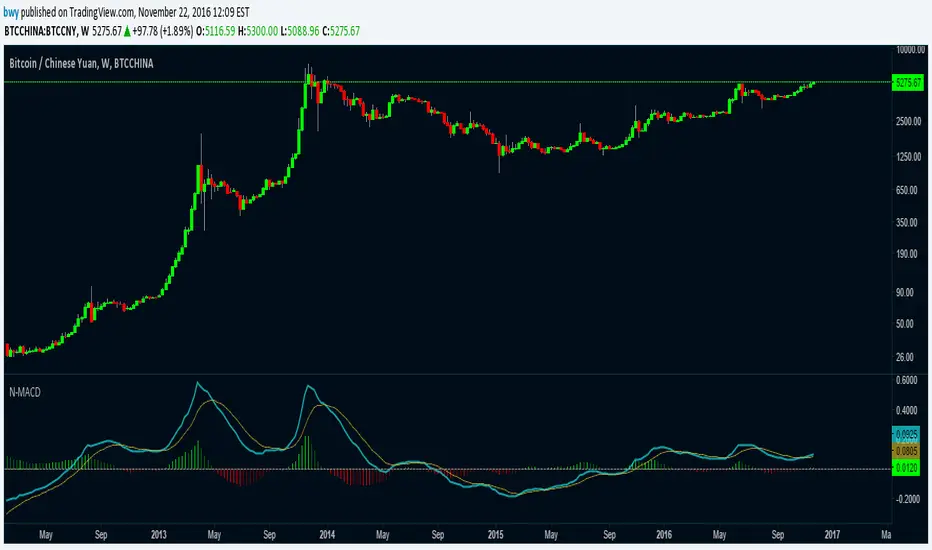
Normalized Moving Average Convergence/DivergenceThis MACD normalizes the price so that it can be compared against moves that took place at prices of significant difference. There are also options to change if the MACD and the signal line are computed using EMA or SMA.Indicador Pine Script®por bwy11158
JC_MacD_RSI_Candle_Strat_public// // Author : Jacques CRETINON // Last Version : V1.0 11-22-2016 // // Risk disclaimer : Do not use this script in production environment. We assume no liability or responsibility for any damage to you, your computer, or your other property, due to the use of this script. // // Purpose of this script : // 1- use same pine code for strategy or study script (with simple modifications) // 2- be able to send alerts : enterlong, entershort, exitlong, exitshort, stoplosslong, stoplossshort, takeprofitlong, takeprofitshort in a study script like a strategy script should do // 3- do not repaint (I HOPE) // // RoadMap : // 1- manage : Trailing Stop Loss and Trailing Stop Loss offset // // I use this script : // 1- with default value for XAUUSD, current chart resolution : 1mn, large timeframe : 15mn. // 2- That's why I hard code MACD5 (5mn average), MACD15 (15mn average), MACD60 (1h average) ... // 3- MACD, RSI (1mn and 15mn) and Candles info are my inputs to take any decisions // // I do not publish my enterLong, enterShort, exitLong and exitShort conditions (lines 204 to 207 are sample !) as they are not as perfect as I'd like. Fell free to use your own conditions :) // // Please, report me any bug, fell free to discuss and share. English is not my natural language, so be clement ;) Happy safe trading :) Estrategia Pine Script®por Cretinon44127
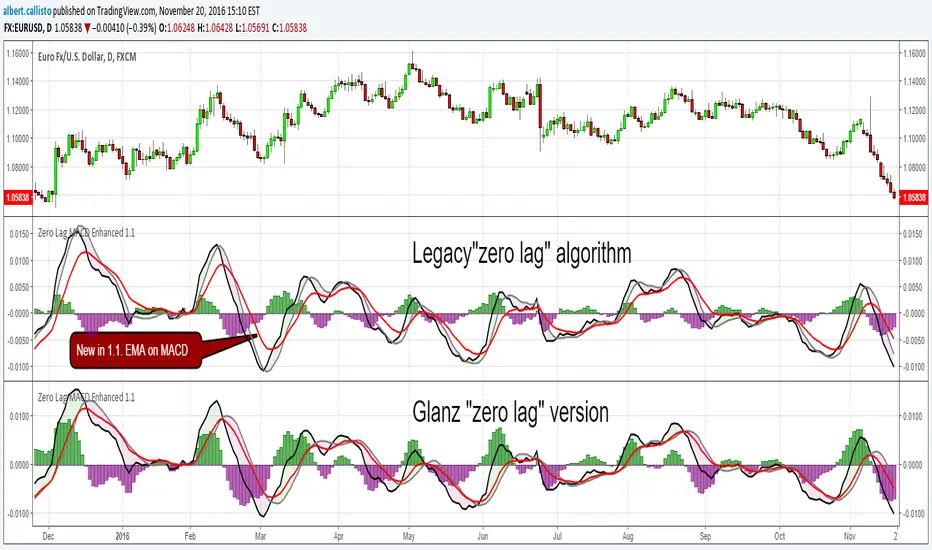
Zero Lag MACD Enhanced - Version 1.1ENHANCED ZERO LAG MACD Version 1.1 Based on ZeroLag EMA - see Technical Analysis of Stocks and Commodities, April 2000 Original version by user Glaz. Thanks ! Ideas and code from @yassotreyo version. Tweaked by Albert Callisto (AC) New features: Added original signal line formula Added optional EMA on MACD Added filling between the MACD and signal line I looked at other versions of the zero lag and noticed that the histogram was slightly different. After looking at other zero lags on TV, I noticed that the algorithm implementation of Glanz generated a modified signal line. I decided to add the old version to be compliant with the original algorithm that you will find in other platforms like MT4, FXCM, etc. So now you can choose if you want the original algorithm or Glanz version. It's up to you then to choose which one you prefer. I also added an extra EMA applied on the MACD. This is used in a system I am currently studying and can be of some interest to filter out false signals.Indicador Pine Script®por albert.callisto55508