Genuine Liquidation Delta [Mxwll] - No EstimatesTHANK YOU TradingView for allowing us to upload custom data!!!
As a result, Mxwll Capital is providing an indicator that shows REAL liquidation delta for over 100 cryptocurrencies sourced directly from a popular crypto exchange!
Features
Crypto exchange sourced liquidation delta
Crypto exchange sourced long liquidation daily count
Crypto exchange sourced short liquidation daily count
All provided data extends back 2 years!!
Various aesthetic components to illustrate data
Liquidation delta data (sourced from a popular exchange) is provided for:
1000shib
aave
ada
algo
alice
arb
audio
alpha
ankr
ape
apt
atom
avax
axs
bal
band
bat
bch
bel
blz
blur
bnb
bnx
btc
chr
chz
comp
coti
crv
ctk
dash
defi
doge
dot
dydx
edu
egld
enj
ens
eos
etc
eth
fil
flm
ftm
fxs
gala
gmx
grt
hbar
hnt
icx
id
inj
iost
iota
joe
kava
knc
ksm
ldo
lina
link
lit
lrc
ltc
mana
mask
matic
mkr
near
neo
ocean
omg
one
ont
op
people
qtum
reef
ren
rndr
rose
rlc
rsr
rune
rvn
sand
sfp
skl
snx
sol
stmx
storj
sui
sushi
sxp
theta
tomo
trb
trx
unfi
uni
vet
waves
xem
xlm
xmr
xrp
xtz
yfi
zec
zen
zil
zrx
How-To
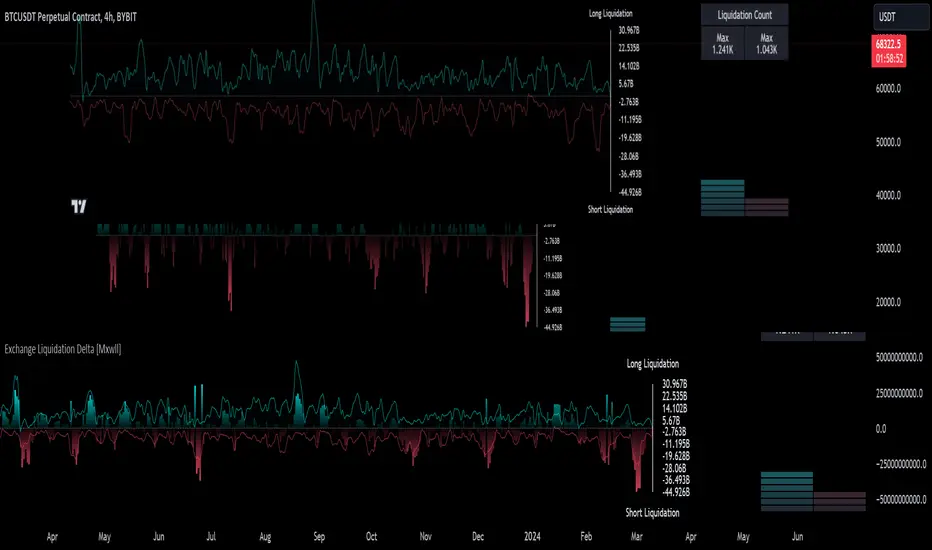
The image above shows the indicator with default settings.
The image above shows the start point of our data!
Over 2-years of data, allowing for plentiful analysis!
The image above explains the primary plot.
Filled blue columns reflect liquidation delta exceeding the long side. When the liquidation delta plot is aqua and exceeds 0 to the upside, longs were liquidated more than shorts for the
day.
Filled red columns reflect liquidation delta exceeding the short side. When the liquidation delta plot is red and exceeds 0 to the downside, shorts were liquidated more than longs for the day.
The image above explains the solid line (polyline) plot and its intentions!
Filled, solid, blue line reflects the total number of long liquidation events for the period.
Filled, solid, red line reflects the total number of short liquidation events for the period.
Keep in mind that the total number of liquidation events is normalized to plot alongside the total liquidation delta for the day. So, there aren't "millions" of liquidation events taking place, the total liquidation count for the long and short side is simply normalized to fit atop total liquidation delta.
The image above explains the liquidation count meter the indicator provides!
The left (blue columns) reflect the intensity of long liquidation events for the day. The right (red columns) reflect the intensity of short liquidation events for the day.
The "Max" numbers at the top show the maximum number of long liquidation events, or short liquidation events, for their respective columns.
Therefore, if the number of long liquidation events were "1.241k", as stated for this cryptocurrency in the table, the blue meter would be full. Similar logic applies to the red meter.
Once more, THANK YOU @TradingView and @PineCoders for allowing us to upload custom data! This project wouldn't be possible without it!