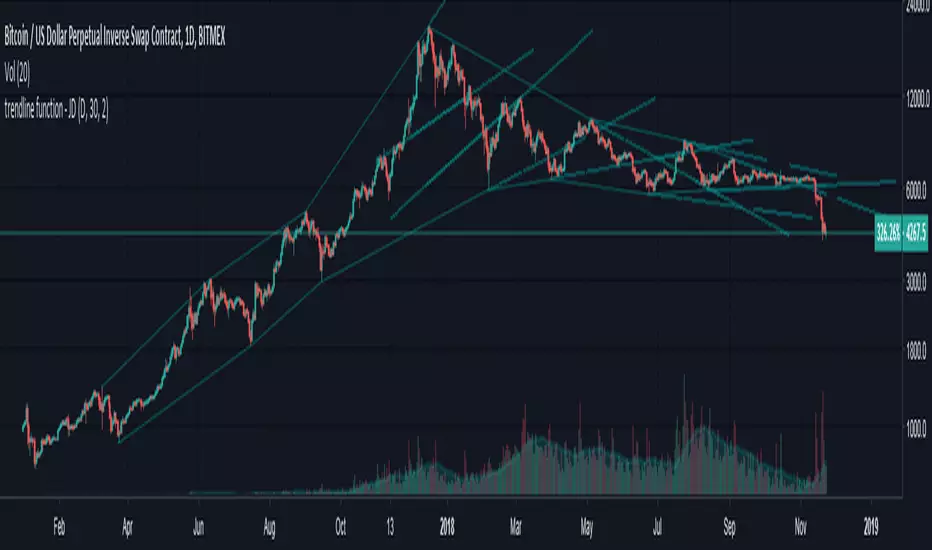
trendline function - JD!EXPERIMENTAL!
As TV doesn't provide a function to draw lines between points, I wrote a function to do this in one my own indicators.
The function itself however can be applied/modified for different use cases, eg. drawing trendlines.
In this (proof of concept) example I used it to draw lines based on past high/low pivot points.
The inputs required:
* an INPUT FUNCTION (in this form, its designed to work with functions that have occasional values and na-values between them, it then connects the non-zero values to form a line)
* a BOOL (to indicate if you want to draw only the rising or falling lines)
* a DELAY (in this case this is the lookback period for the pivot-points function, this is to compensate the calculation of the past and realtime points)
The function returns:
* the function to draw the extension from the BASE-LINE to the current time (here this is the connection of the last pivot-point to the current point to bridge the gap of the lookback period, this is NOT REALTIME!)
* the function to draw the extension for the current time (here this is the continuation of the line until a new pivot-point is valid, this is DRAWN IN REALTIME!!)
* the color of the lines (in this case the lines are only colored (lime or fuchsia) if they either go up or down, else they are invisible, this is to clean up the invalid lines)
these output functions can then simply be plotted using the 'plot' function.
JD.
Lines


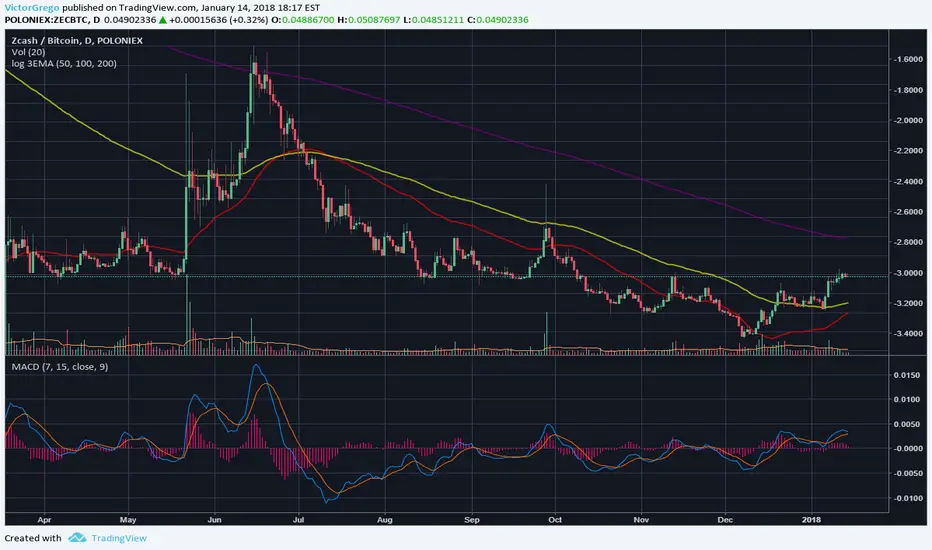
log 3EMAlogarithmic exponential moving average
plots 3 lines instead of 1
default is 50,100,200
use standard scale instead of log, for this to work properly.
BTC tip jar: 1Mv1s7nLaTsRoLai5WXEGg8doisXuiPUXy
ETH tip jar: 0x6113DDD23D0D5aCad3d1f8640A8A571E9Cb86cB8
LTC tip jar: LYvyoqTSWxa22TQw3E7818xy4AfYNi6xcm
BCH tip jar: 1GC7oZ7MhLkamKCDdZFnUfV21SKWq84VdY

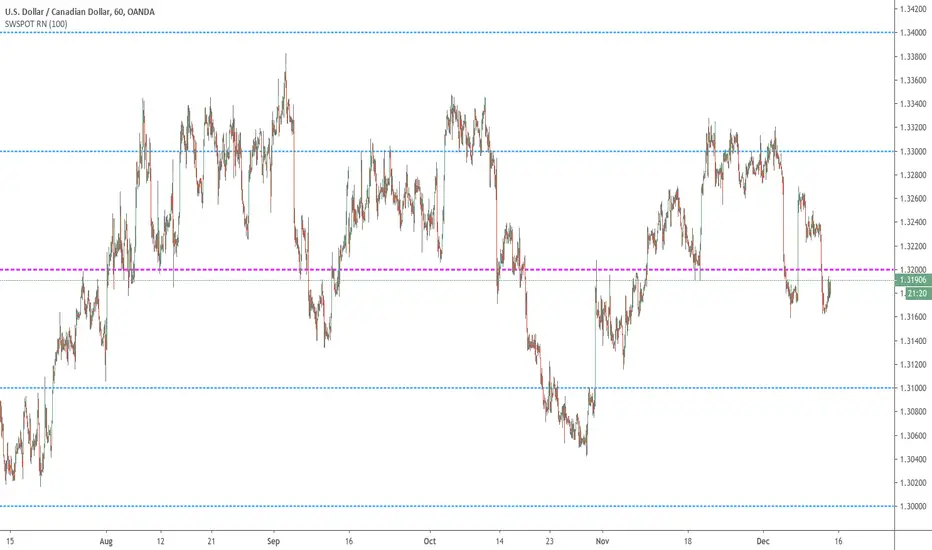
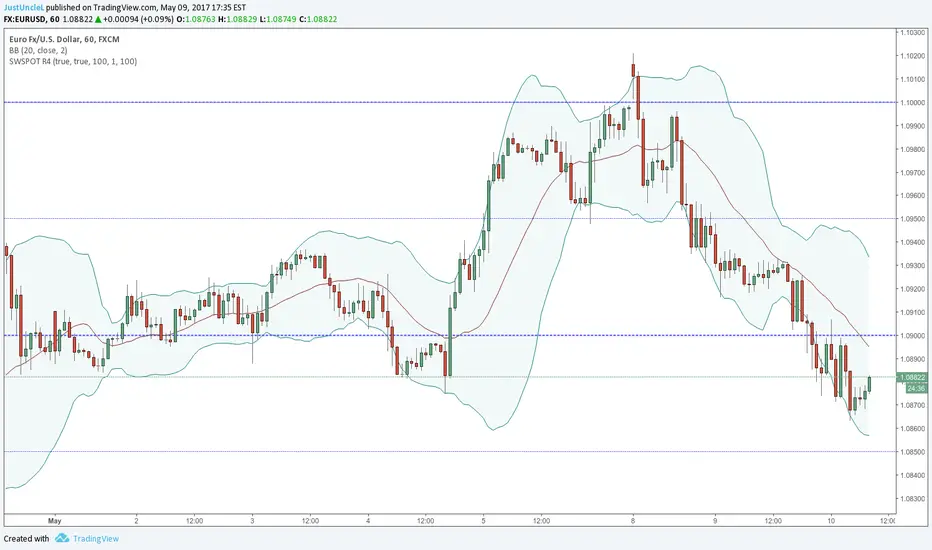
Sweetspot Gold RN - by JustUncleLThis is an alternate version of "Sweetspot Gold R4" that does not use sublevels. Removing the sublevels allows more efficient use of the plots (TV script has a limit of 64 plot calls).
This works well for all currency pairs I've tested, most commodities, and most stocks.
The indicator plots the so called "round price levels" or "00" levels. For example, 1.4000, 1.4400, 1.4500.
It automatically calculates the levels for each chart time frame. Optionally you can manually select main level size (in pips)
Use this indicator as a guidance to a better mapping of Support/Resistance levels on the chart. Next time you draw Support/Resistance lines, if they coincide with round price levels, you have got a excellent S/R level to work with!
Sweetspot Gold R4-22 - by JustUncleLThis upgrade I have attempted to improve the Automatic levels calculation and better automatic levels selections. It should now work better with exotic currencies, indices, commodities, and stocks.
The indicator plots the so called "round price levels" or "00" levels, which end on 00 and 50: for example, 1.4000, 1.4400, 1.4450. It automatically calculates the levels for based on your charts time frame. Alternatively you can manually select main level size (in pips) and/or the number of sub-levels (0, 1, 2, 3, 9). Generally speaking, the program tries to keep to 3 Digit "00" rounding for currencies and non-stocks, and 2 Digit "00" rounding for Stocks.
Use this indicator as a guidance to a better mapping of Support/Resistance levels on the chart. Next time you draw Support/Resistance lines, if they coincide with round price levels, especially "00", you have got a excellent S/R level to work with!
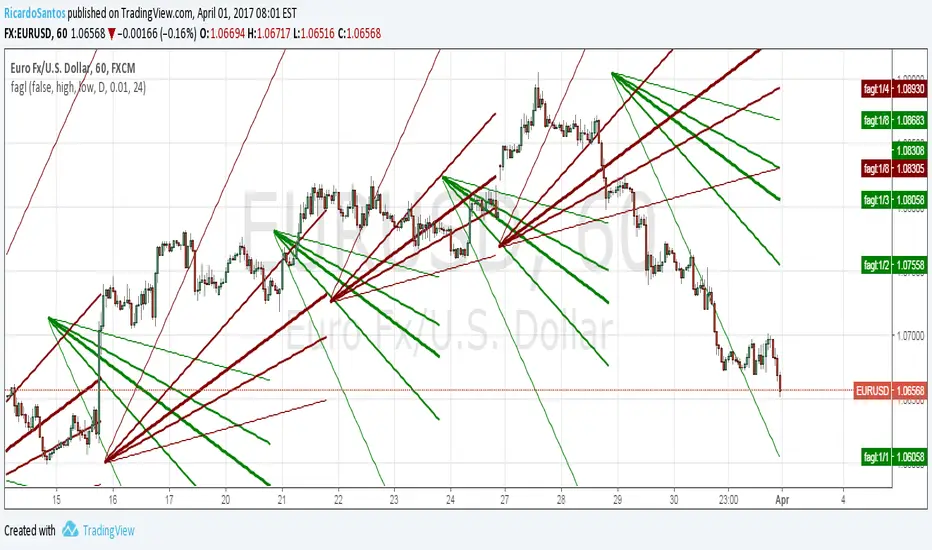
[RS]Fractal Auto Gann LinesEXPERIMENTAL:
GANN lines projection based on zigzag tops/bottoms, use at your own risk.
[RS]Average Advance and Decline Lines V0Method to draw linear regression lines from average price advance&decline range
