Advanced Dynamic Swing Anchored VWAP (Adaptive, Smart Pivots)🔹 Overview
The Advanced Dynamic Swing Anchored VWAP is a powerful trading tool that automatically anchors VWAP to detected swing highs and lows, while adapting dynamically to market volatility using ATR-based tracking.
Unlike static VWAP lines, this adaptive version provides smarter trend tracking, real-time pivot detection, and swing labeling (HH, HL, LH, LL) to help traders identify market structure shifts with precision.
✨ Key Features
✅ Swing Pivot Detection – Automatic detection of swing highs & lows based on your chosen period.
✅ Adaptive ATR Tracking – VWAP responsiveness adjusts dynamically with volatility.
✅ Smart Labels – Marks pivots with HH, HL, LH, LL to track market structure.
✅ Trend-Based Coloring – VWAP changes color based on bullish or bearish direction.
✅ Alerts – Get notified instantly on new swing pivots or trend shifts.
✅ Multi-Market Ready – Works across Forex, Crypto, Stocks, and Indices.
🔍 How to Use
Identify Trend Direction – Green VWAP line = bullish swings; Red = bearish swings.
Watch Pivots – HH/HL indicate bullish structure, while LH/LL indicate bearish structure.
Combine With Confirmation – Best used with RSI, MACD, or Price Action for confluence.
Set Alerts – Never miss a trend shift with built-in TradingView alerts.
🎯 Best For
Swing traders looking for precision pivot detection.
Trend-following traders using VWAP-based support/resistance.
Scalpers who need adaptive VWAP levels that adjust to volatility.
Multi-asset traders (Crypto, Forex, Stocks, Futures).
📈 Why This Indicator?
The standard VWAP is static. Anchored VWAP requires manual anchoring. This advanced version automates the process, adapts to volatility, and visually shows pivots for smarter entries and exits.
By combining anchored VWAP logic with adaptive ATR filtering, this tool gives a next-gen trading edge for both discretionary and systematic traders.
LH
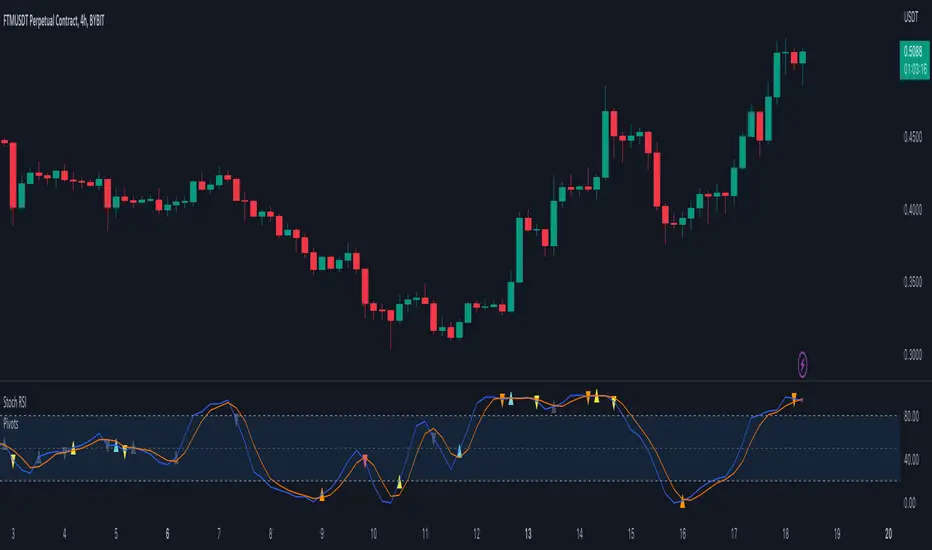
Pivots For IndicatorsThis is an overlay indicator that finds and identifies pivots. It is very sensitive so works best on smoother oscillators such as Stoch RSI. Make sure you set the source to your indicator after you overlay it. You will need to adjust the rev high and low inputs in the settings. For example Stoch RSI would have a revhigh = 80 and revlow = 20. This script is not designed to work on the chart.
Yellow = First Higher low or First Lower High
Orange = Reversal (Indicator low and high levels can be adjusted in settings.
Teal = Higher Low
Red = Lower High
Gray = Higher high or Lower Low
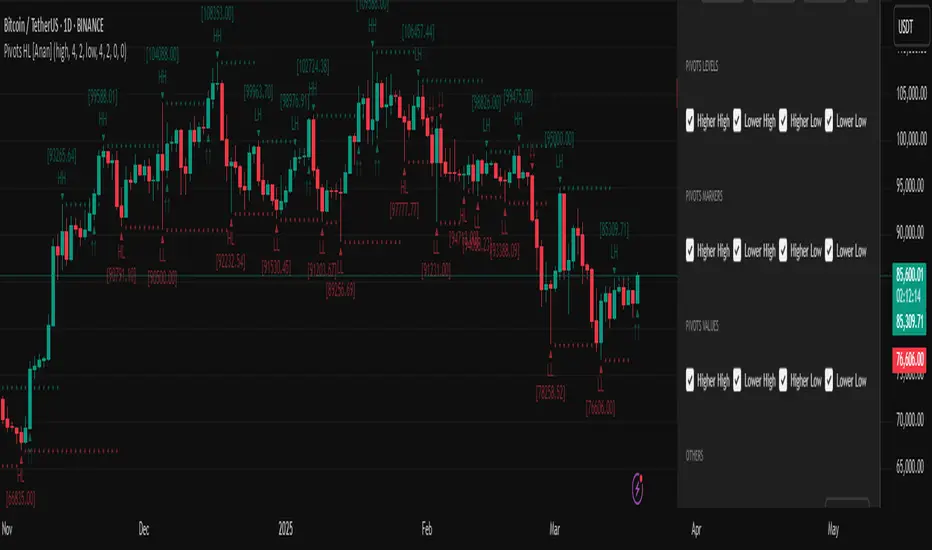
Pivot Points High Low MTF [Anan]█ OVERVIEW
Pivot Points High Low with Multi Time Frames support and bull/bear signal depends on pivot average
█ FEATURES
- Fully control of pivot (Source / Length Left / Length Right)
- Show HH, LL, LH, HL price on candles
- Show Avg Pivot High Low.
- Show Bull/Bear Labels.
- Control of signal accuracy (default: 0.5%)
- Show Pivot High Low Levels as a Fractal Chaos Channel.
- Multi-timeframe Table with support of Pivot High Low and pivot Average.
- BreakOut and BreakDown Labels in the table.
- Full control of displaying any row or any column.
- Full control of Table position and Size and Colors.
Pivot Points [CB]Automatically label pivots as HH/LH and HL/LL.
The criteria for determining pivot points can be configured.
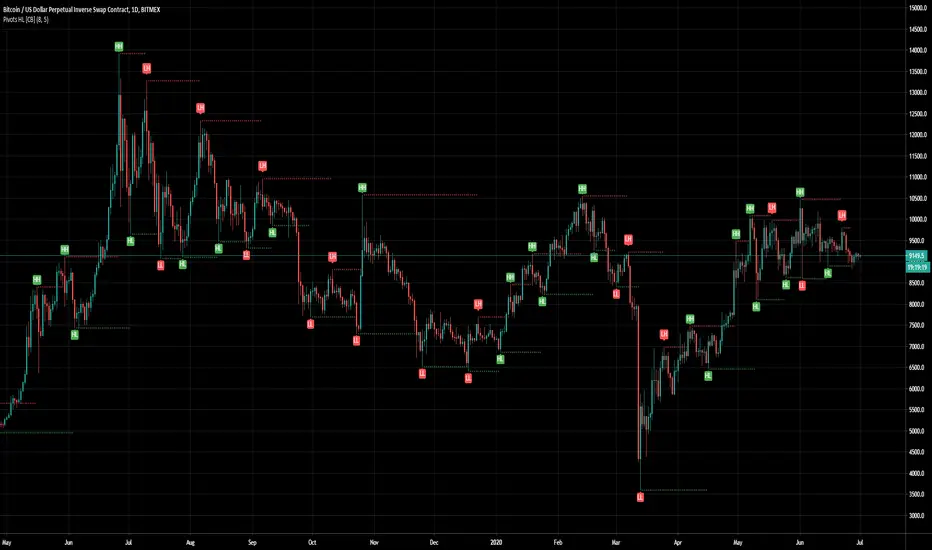
Pivot Points High Low (HH/HL/LH/LL) [Anan]Hello Friends,
This is my own version of ( Pivot Hilo Support n Resistance Levels R3-3 by JustUncleL )
- V4 Pinescript
- Removed MA dependency filters
- Add some arrows