Fearzone & Greedzone Levels - Contrarian & Breakout (Expo)"Be fearful when others are greedy, and greedy when others are fearful" - Warren Buffett. Fearzone & Greedzone Levels - Contrarian & Breakout (Expo) is a contrarian and breakout indicator that gives us an indication when fear and greed begins to take over in the market. Traders should be prepared for increased volatility and good trading opportunities.
This indicator can both be used to identify potential reversal points and be used to identify breakouts from previous Fear and Greed Levels.
The Fearzone and Greedzone can be visualized with candlesticks or with circles depending on what you prefer.
Alert conditions are added.
HOW TO USE
1. Use the indicator to identify when investors are fearful and greedy.
2. Use the indicator to identify potential reversal points.
3. Use the indicator to identify potential breakouts.
INDICATOR IN ACTION
4 hour chart
4 hour chart
I hope you find this indicator useful , and please comment or contact me if you like the script or have any questions/suggestions for future improvements. Thanks!
I will continually work on this indicator, so please share your experience and feedback as it will enable me to make even better improvements. Thanks to everyone that has already contacted me regarding my scripts. Your feedback is valuable for future developments!
-----------------
Disclaimer
Copyright by Zeiierman.
The information contained in my scripts/indicators/ideas does not constitute financial advice or a solicitation to buy or sell any securities of any type. I will not accept liability for any loss or damage, including without limitation any loss of profit, which may arise directly or indirectly from the use of or reliance on such information.
All investments involve risk, and the past performance of a security, industry, sector, market, financial product, trading strategy, or individual’s trading does not guarantee future results or returns. Investors are fully responsible for any investment decisions they make. Such decisions should be based solely on an evaluation of their financial circumstances, investment objectives, risk tolerance, and liquidity needs.
My scripts/indicators/ideas are only for educational purposes!
Levels

Pivot LinesThis indicator provides possible short, medium, and long-term support and resistance levels based on recent highs and lows. The furthest the level is, the thicker its line is, making it easy to spot stronger levels where 2 lines overlap. It can be configured to use open/close values instead of high/low for tighter levels.
Default settings:
- Short Period: 20
- Medium Period: 50
- Long Period: 100
This script also provides alerts for when the price crosses over/under a given level or pulls back.
Note: It sometimes displays supports above the price and resistances below it, I still have to figure out why (and fix it if possible), but it's still useful.


Key price levelsFunction: labelling recent highs and lows automatically. Easy and clean.
In this example, we can see the previous low of the ticker is around 105.5, the previous high is around 120.
We can set up our entries and exits by referring to the last lows and highs.
Users can adjust the searching bar range by themselves.

Auto Fibonacci Levels and DMA WMA Resistances by Ahmad DukhanHi,
This indicator will give you from -100% to 300% of the Fibonacci levels that is carefully calculated that doesn't change with frame change and is very reliable regardless which symbol you are trading (Ask for screenshot proof for symbol you trade)
Also included with
- Fibonacci Levels
Daily S/R
- 20 DMA
- 50 DMA
- 100 DMA
- 200 DMA
Weekly S/R
- 20 WMA
- 50 WMA
- 100 WMA
- 200 WMA
With options to toggle/enable/disable any of the above
For more details on how to get this indicator DM me
Thanks

All past LevelsContains all past levels that we need
1. Previous Monthly High
2. Previous Monthly Low
3. Previous Weekly High
4. Previous Weekly Low
5. Previous Daily High
6. Previous Daily Low
7. Previous Monthly Range Average (PMH+PML)/2
8. Previous WeeklyRange Average (PWH+PWL)/2
9. Previous Daily Range Average (PDH+PDL)/2
10. Monthly Open
11. Weekly Open
12. Daily Open
NSDT Auto Support / Resistance LevelsSimple script that automatically plots support and resistance lines based on the pivot points of the number of candles you choose to look back upon.
All options are editable.

NSDT Horizontal MA LinesDisplays up to 5 moving averages as horizontal lines based on the most recent candle. It is important to remember that the line is drawn from right to left.
This gives the chart a nice clean look.
Moving average lengths can be adjusted. Line lengths can be adjusted.

True ATH/ATL w/ labelsPlots the All Time High and All Time Low, with optional labels when a new ATH/ATL is created. Reaches all the way back in history for the true high/low, not limited to the most recent 5000 candles like most scripts. Works on all time frames.
Cuban's Price Action ChannelThe latest in the indicator series tailored to discretionary traders.
This script draws a channel by using the highs and lows of previous timeframes. The H1 and H4 fill is extremely useful for taking low timeframe front-side reversals in a ranging environment, while providing high timeframe levels to take profit at, and plan your next trade.
I believe this script provides a solid fundamental price action understanding and foundation to anyone's discretionary trading setup.

Bhoomi Monthly Levels - NIFTY Next 25This is a custom indicator which assists with monthly levels of Next25 stocks of NIFTY 50.
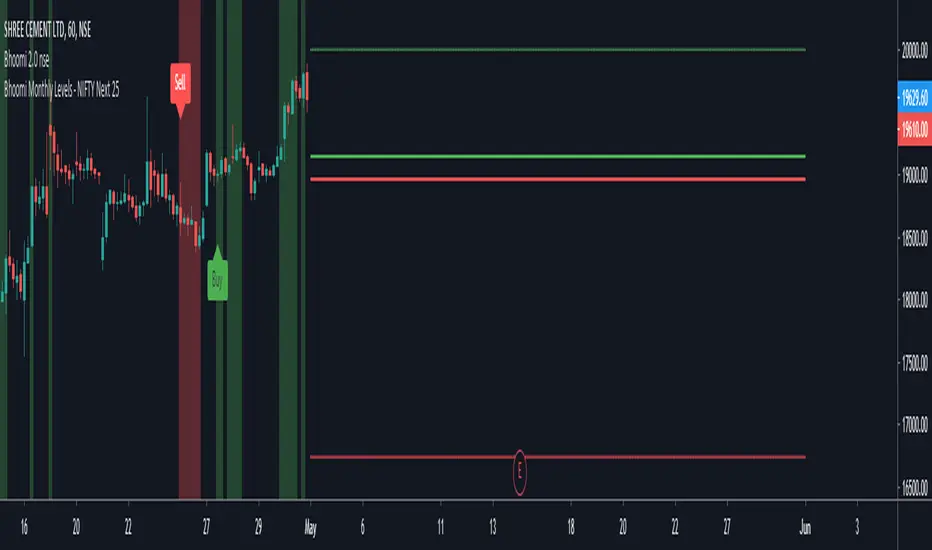
Bhoomi Monthly Levels - NIFTY 25This is a custom indicator which assists with monthly levels of first 25 stocks of NIFTY 50.

Level KingShows key historical support & resistance (S/R) levels on multiple timeframes
Shows two nearest levels below and above current close price on 2 selected time frames
Option to select timeframes (daily, weekly, monthly, current)
Option to display moving average S/R levels as well (daily and weekly)
Option to display levels for current bar only, or to show all historic S/R levels as they occurred
Strategies include:
Enter or add to long positions on "support" (when price touches a green/blue line)
Enter or add to short positions on "resistance" (when price touches a red/purple line)
Take profit from a long position when a "resistance" level is touched for the first time
Take profit from a short position when a "support" level is touched for the first time

Chonky Initial Balance (crypto)Plots the Initial Balance for crypto assets.
I use it for XBTUSD specifically.
The Initial Balance range is an area watched by Market/Volume Profile traders.
The idea behind it is that participants will start the day with a premeditated bias towards the market, and this is the first glimpse into how the rest of the day may unfold.
Access: DM me and I will consider granting access

Areas of Support/Resistance & BreakoutA pretty little indicator showing pivotal breakouts - that is, locating critical pivot points within price action, connecting the dots and trading the breakouts from this area!
-----------
Useful for finding good entry levels, exit levels, areas of strong support/resistance and most importantly - the Breakout!
Includes "Bars to the Left" variable so you can shorten or lengthen the indicator as required.
Good Luck and Happy Trading!

gannsquareof9chart2This Indicator works on W.D.Gann Square of 9 chart
gann works on SQUARES: ODD and EVEN
HIGH and LOW of this chart will be the " SQUARES "
this chart provides 7 major and 8 minor levels in between the ODD or EVEN Squares .
major levels are colored in blue and white respectively.
minor levels are colored in olive .
better visibility in dark background
change the color of the levels according to your requirement.
Once the HIGH or LOW (or SQUARES) breaks The next ODD or EVEN SQUARES open up ,
As the breakout of Squares happens the chart expands and acquire the new HIGH or LOW.
I have given Three different resolution option user can switch between:
DAILY ; WEEKLY ; MONTHLY .
thankyou

Chonky ATR LevelsChoose any custom ATR settings (smoothing, period, time frame, lookback)
and project daily high/low with current daily high/low values

[e2] Fibonacci slicerFibonacci slicer function.
The script is a simple calculator that accepts any 2 input values and divides the distance between those values using Fibonacci proportions.
- Easy for script integration (lines 21-35).
- The function accepts any 2 values and their order doesn't matter.
- Correctly divides negative-negative, negative-positive, positive-negative and positive-positive values.
- Calculates 7 levels derived from the Golden ratio (1.618033).

NSDT Colored Support And Resistance ZonesScript that allows you to plot four (4) different support/resistance zones. The zones will change color whether the candle is over or under or within the zone area. All options can be modified. Tip: If you want eight (8) zones, just load the indicator twice.

RSI LevelsRSI Levels
- The relative strength index ( RSI ) is a technical indicator used in the analysis of financial markets.
It is intended to chart the current and historical strength or weakness of a stock or market based on the closing prices of a recent trading period.
- This indicator allows us to visualize the levels of rsi in the chart, so that we can calculate take profit and stop points in a simple way,
knowing what position the price is currently in relation to these levels and how much space we have.
- We can also visualize the slope of the three levels of rsi , overbought, oversold and level 50, something that is not possible in the oscillator version.
- It allows you to display 2 rsi values at the same time.
- Allows to change the color of candlesticks based on rsi.

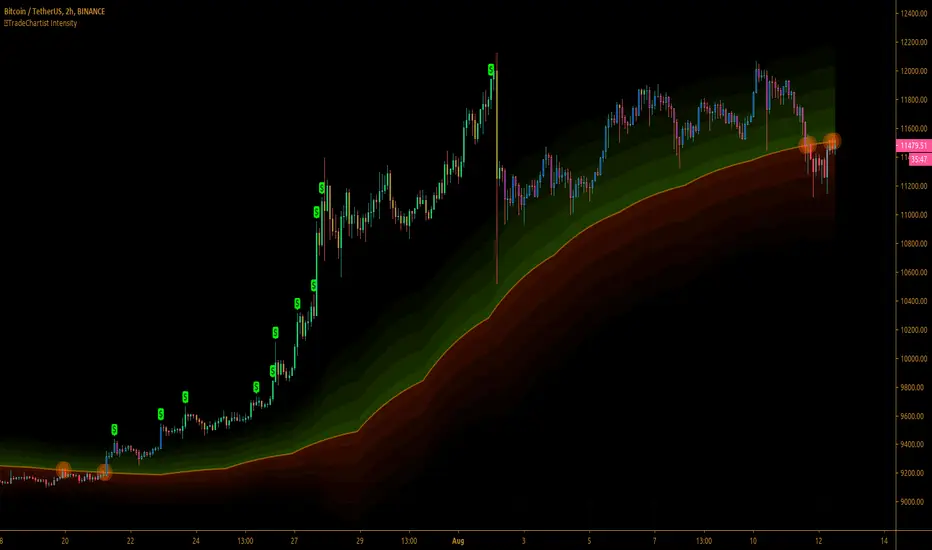
™TradeChartist Intensity™TradeChartist Intensity is a visual indicator that comes with Intensity color candles and Auto-fibs feature that helps any trader with Entry/Exit and levels confirmation based on where the price is, in relation to the Orange Price Equilibrium line and the 5 zones of Bull/Bear limits that fade into the top or bottom outer space.
™TradeChartist Intensity itself doesn't plot BUY or SELL signals, but when used with ™TradeChartist Rubicon gives a better picture for trade confirmations. It can also be used as a standalone indicator and works equally effective with other traditional and non-traditional indicators.
The indicator comes with simple settings with useful features outlined below.
Intensity Color Candles
Intensity Color Candles when activated from settings paints the candles/bars with colors specific to the Bull/Bear limits or the outer space and is easy to identify the signal strength over time.
Uptrend - The bars/candles move away from the Orange Price Equilibrium line towards the upper Bull limits with bar color fading slowly leading to outer space where the bar color turns neon green.
Downtrend - The bars/candles move away from the Orange Price Equilibrium line towards the lower Bear limits with bar color fading slowly leading to outer space where the bar color turns neon red.
When the price candle wick or body touches the Orange Price Equilibrium line, distinct torchlight circle appears to signal the trader of a potential change in price direction which can be used as a signal confirmation in conjunction with another indicator before taking a trade position.
Show Auto Fib Levels
Auto Fib Levels plot automatic Fib levels based on significant Highs and Lows based on Intensity strategy which mostly are reference prices of recent highest high above Orange Equilibrium price line and recent lowest low below the Orange Equilibrium price line.
15m XBT chart with 'Show Auto Fib Levels' checked and 'Show Fibs from current High/Low' unchecked under indicator settings
These Auto Fib Levels change when the price movement/trend changes direction and will be based on trending price direction.
Show Fibs from current High/Low
When this option is chosen from indicator settings, the auto fib levels are drawn from the highest high of the trending price direction to lowest low of last trend for uptrend or vice-versa for downtrend.
15m XBT chart as above with 'Show Fibs from current High/Low' unchecked under indicator settings
Show Profit Candles
Activating this option from indicator settings will automatically plot $ labels above candle highs that hit important resistance levels during uptrend and candle lows that hit important support levels during downtrend. This will help traders take out profits during trades based on their personal profit goals and realistic trade targets based on momentum/RSI/volatility etc.
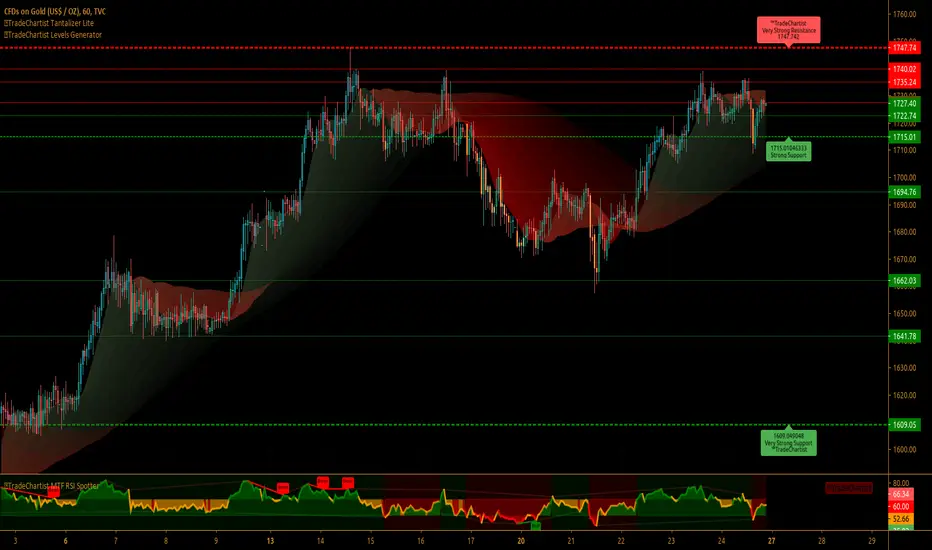
Example chart of XAUUSD 1hr Gold chart showing both Long and Short trade Profit candles
Give a thumbs up or leave a comment if you like the script.
™TradeChartist Levels Generator V4"™TradeChartist Levels Generator" is an easy to use script that can be used by traders of all levels from beginners to advanced professionals.
What does the script do?
Plots the support and resistance levels automatically based on user preference of Local levels of Lower or Higher Timeframe from indicator settings.
Plots Fibonacci retracement levels between high and low based on 'Days' or 'Candles' lookback from indicator settings.
The script proves to be very effective when used with another indicator for trend confirmation like the ribbon (not included in this script) shown on chart.
What markets can this script be used on?
Forex
Stocks
Commodities
Cryptocurrencies
and almost any asset on Trading View
What is the difference between "Plot Levels" and "Plot Fibonacci Levels"?
"Plot Levels" plots support and resistance levels automatically without any input from the user other than preferred levels 'plot' from the indicator settings namely
Plot Local Levels for Higher TF - Plots all important Support/Resistance levels for mostly higher time frames (1hr or higher) - Short to Mid term outlook
Plot Local Levels for Lower TF - Plots all important Support/Resistance levels for mostly smaller time frames (can be used for up to 1hr in most cases) -
Recommended for Scalping/Swing Trading mostly dependent on volatility
"Plot Fibonacci Levels" plots all standard Fibonacci retracement levels - 0, 23.6%, 38.2%, 50%, 61.8%, 78.6% and 100% based on
"Days" Lookback - Fibonacci levels between High and Low based on number of days in the past, starting from the current day on any time frame chart
"Candles" Lookback - Fibonacci levels between High and Low based on number of candles in the past, starting from the current candle on any time frame chart
Can the Fibonacci levels be reversed?
Yes. The Fibonacci levels can be reversed by checking the "Reverse" checkbox from the indicator settings. This is very handy if the trend looks like there may be a support or resistance from one of the Fib levels and a possibility of a new high or a new low based on the price action.
What is the need for "Plot 1.272 Fibonacci Level" under "Plot Fibonacci Levels"?
1.272 is an important Fibonacci number as it is the square root of 1.618 and is the near support or resistance after 100% price retracement. Even though it keeps moving on the chart dependent on the new high or new low based on Days/Candles lookback, it serves as a 'nice to have' reference for any trader looking beyond 100% retracement for support/resistance .
Why do the 'local levels' lines' color changes between green and red?
The nearby levels lines change color based on price closing above or below them. This happens to only closest local levels for lower TF near price action and for top/bottom lines of the local levels for higher TF.
The line turns green when it becomes support as price closes above it.
The line turns red when it becomes resistance as price closes below it.
This is a free to use indicator. Give a thumbs up or leave a comment if you like the script.