Forex Renko LeaderboardForex Warlord: Kinetic Velocity Leaderboard
This indicator is a specialized dashboard designed to rank the 7 Major Forex pairs based on their real-time "Kinetic Velocity" and acceleration. Unlike standard strength meters that measure relative price change, the Warlord Engine calculates exactly how fast a pair is generating net profits per second, accounting for the "Physics" of the market: drag (spread costs) and inertia (lag).
It is designed specifically for momentum traders who need to know not just which pair is moving, but which pair is moving fast enough to overcome the cost of the spread and generate immediate net return.
HOW IT WORKS
The script runs a "Virtual Renko" simulation on your time-based chart (works best on 1-second or 1-minute timeframes). It tracks price movement in "Bricks" and calculates a standardized "Score" for each pair.
The Score represents "Net Pips per Second."
-- A positive score (> 0.00) means the price is moving fast enough to clear the spread and generate profit.
-- A negative score (< 0.00) means the price is moving too slowly, and the spread cost is eating the volatility.
The system then applies a "Smart Decay" penalty. If a pair is moving fast but starting to decelerate (slowing down), its score is penalized to prevent you from buying the top.
HOW TO USE IT
1. Attach the indicator to any chart (EURUSD, 1-Second or 1-Minute recommended for high-speed scalping).
2. Look at the Dashboard on the right side of the screen.
3. Identify the Rank #1 Pair. This is the currency currently moving with the highest velocity.
4. Check the "Action" Column:
-- TRADE (Green): The pair is Rank #1 AND its velocity is high enough to be profitable.
-- NO TRADE (Red): The pair is moving too slowly, or the spread cost is too high relative to the move.
-- SPREAD > MAX (Red): The calculated move does not clear your specified "Max Broker Cost."
-- NO TRADE (ZONE) (Red): The market is in the "Dead Zone" (typically 17:00-18:00 EST), where spreads widen and liquidity vanishes.
5. Check the "State" Icon:
-- Rocket: The pair is accelerating. This is the ideal entry signal.
-- Warning: The pair is decelerating. Caution is advised as momentum is fading.
ALERTS
The indicator features a built-in alert system. You can create an alert in TradingView to notify you specifically when the "Renko Leaderboard Ranking" changes. This allows you to wait for the market to tell you which pair is taking the lead without staring at the screen.
INPUTS & SETTINGS
-- Renko Brick Size (Pips): The most critical tuning knob. Determines the sensitivity of the engine. Smaller bricks (e.g., 2-3 pips) make it hyper-sensitive for scalping. Larger bricks (e.g., 10 pips) tune it for swing trends. Changing this instantly recalculates the entire board.
-- Max Broker Cost (Pips): Your "Hurdle Rate." If a pair's projected profit does not clear this cost (default 1.0 pip), the dashboard will forbid the trade.
-- Dead Zone Start/End (Hour): Hard-coded risk management. By default, it blocks all signals between 17:00 and 18:00 EST (New York Close) to protect you from high-spread rollover hours.
-- HMA Time Dilation: A smoothing factor to prevent noise on 1-second charts.
DISCLAIMER
This tool is for informational purposes only. It measures past velocity to rank current momentum. Past performance is not indicative of future results. Always verify the actual bid/ask spread on your broker before executing, as the script uses a fixed spread calculation.
Leaderboard

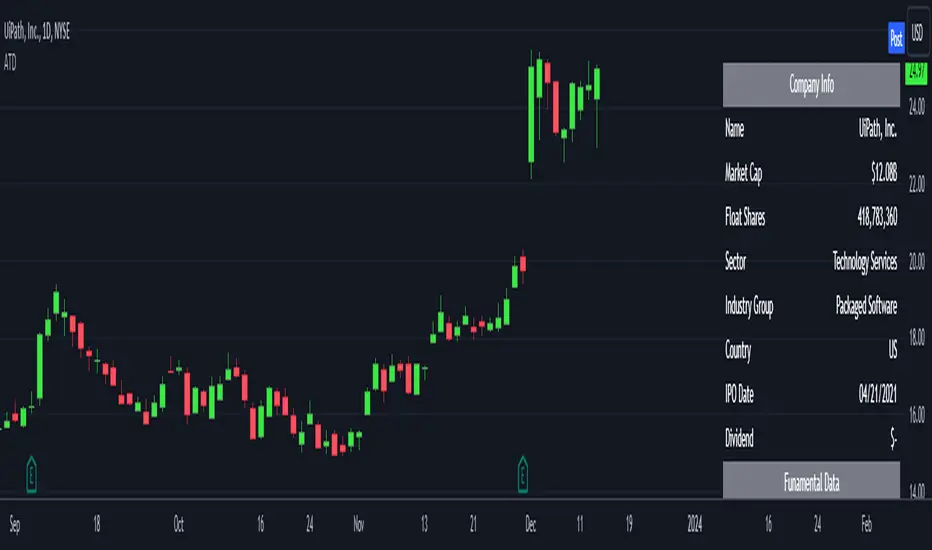
Analytics Trading DashboardThe Analytics Trading Dashboard is a tool designed to bring key information about a company into an easy-to-view dashboard. The indicator combines Company Info, Fundamental Data, Price & Volume Data, and Analyst Recommendations all into one table.
Let’s dive into the details by section:
Company Info:
Name – Company name.
Market Cap – Total dollar market value of the company’s outstanding shares of stock.
Float Shares / Shares Outstanding – Floating shares indicate the number of shares available for trading. Outstanding shares are any shares held by shareholders and company insiders.
Sector – The stock's sector.
Industry Group - The industry group the stock belongs to.
IPO Date – Date on which a security is first publicly traded.
Dividend – The latest dividend amount if the company pays one.
Fundamental Data:
EPS Due – The date the company is set to report earnings next.
EPS Est Next Qtr – The earnings per share estimate for the upcoming report.
EPS Est % Chg (Current Qtr) – The earnings growth as a percentage based on the reported earnings of the same quarter from the previous year.
EPS % Chg (Last Qtr) – The earnings growth of the last reported quarter as a percentage versus the same quarter from the previous year.
Last Qtr EPS Surprise – The amount reported earnings beat or missed estimates from the last reported quarter.
Last 3 Qtrs Avg. EPS Growth – The average percentage growth of the last 3 earnings reports.
# Qtrs of EPS Acceleration – The number of consecutive quarters that EPS has increased.
Last 3 Qtrs Avg. Rev Growth – The average percentage growth of the last 3 revenue numbers reported.
# Qtrs of Rev Acceleration – The number of consecutive quarters that revenue has increased.
Gross Margin – Measures gross profit compared to revenue as a percentage.
Debt/Equity Ratio – The ratio of debt to equity, or financial leverage.
Price and Volume Data:
52 Week High – The highest high of the last 52 weeks.
% Off 52 Week High – The percentage the current price has decreased from the 52-week high.
Price vs. Moving Average – The distance as a percentage that the current price is from the selected moving average.
Average Volume – The average number of shares traded based on the selected lookback period.
Average $ Volume – The average of the total value of shares traded based on the selected lookback period.
Pocket Pivots – The number of pocket pivots that have occurred in the selected lookback period.
Up/Down Volume Ratio - A 50-day ratio derived by dividing total volume on up days by the total volume on down days.
ATR – The average true range shown as a dollar value and percentage of current price.
ADR – The average daily range shown as a dollar value and percentage of current price.
Beta - Beta is a measure of its volatility relative to the overall market, indicating how much the stock's price is expected to fluctuate compared to the market average.
Analyst Ratings:
Strong Buy – The number of strong buy recommendations.
Buy – The number of buy recommendations.
Hold – The number of hold recommendations.
Sell – The number of sell recommendations.
Strong Sell – The number of strong sell recommendations.
The Analytics Trading Dashboard also comes with the flexibility to select your preferred moving average for price and volume analysis, as well as to choose the specific lookback period for calculating the Average True Range (ATR), Average Daily Range (ADR), and Pocket Pivots lookback period.
MarketSmith VolumesThe 'MarketSmith Volumes' is to be used with the 'MarketSmith Indicator' and 'EPS & Sales' in order to mimic fully MarketSmith Graphs with the maximum number of indicators allowed by a free Tradingview Plan: 3
This indicator is no more than a simple volume indicator where all parameters are already adjusted to resemble MarketSmith graphical volumes.
Also you will find integrated:
High Volumes Bars Peak :
They allow us to see peak volumes at a glance.
10-Week Average Volume :
When viewing a weekly chart, this line represents a 10-week moving average volume level. It allows you to see if the current Volume Bar of the week is above or under the average volume traded in the past 10 Weeks.
50-Day Average Volume :
When viewing a daily chart, this line represents a 50-day moving average volume level. Whether or not volume is above or below the average for a certain period could have a significant impact on your stock chart analysis.

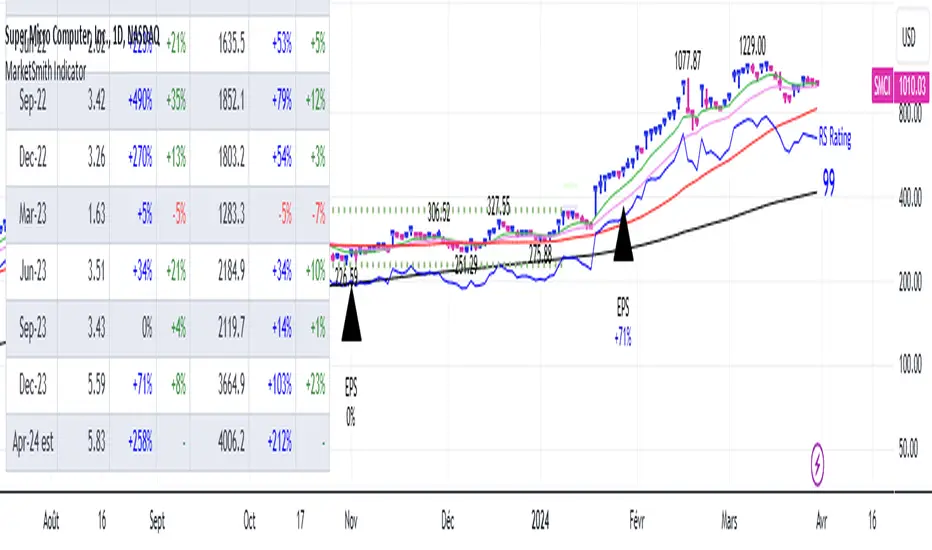
MarketSmith IndicatorThis script provides you with several indicators that will enable you to mimic MarketSmith charts, even with a free TradingView plan.
You can use this script with my ' EPS & Sales ' indicator.
MarketSmith-style bars
The script offers an original approach to managing candlesticks within the code, making them almost identical to those on MarketSmith.
For a perfect display, select ' Bars ' on your chart and set the opacity of your candles to 100% to display only the candles proposed by this indicator.
If you don't want them, you can simply disable them in the ' Style ' tab by unchecking 'MarketSmith Bars' and 'Chars'.
These candles are designed to be used with a fix chart. (No beautiful result with zooming in or out.)
Normally, the display will still be correct by right-clicking, and ' Reset Chart '.
Simple customizable moving averages
With automatic distinction of the weekly time unit. You can choose to display them or not, select the calculation method and modify their length via the panel.
The RS Rating indicator
I've integrated the RS Rating indicator into this script, as the RS Rating is a fundamental component of this layout.
High and valley points
These points are used by MarketSmith to detect bases, patterns, cup & handle.
Designed for US Market only you won't be able to screen correctly the India market for example.