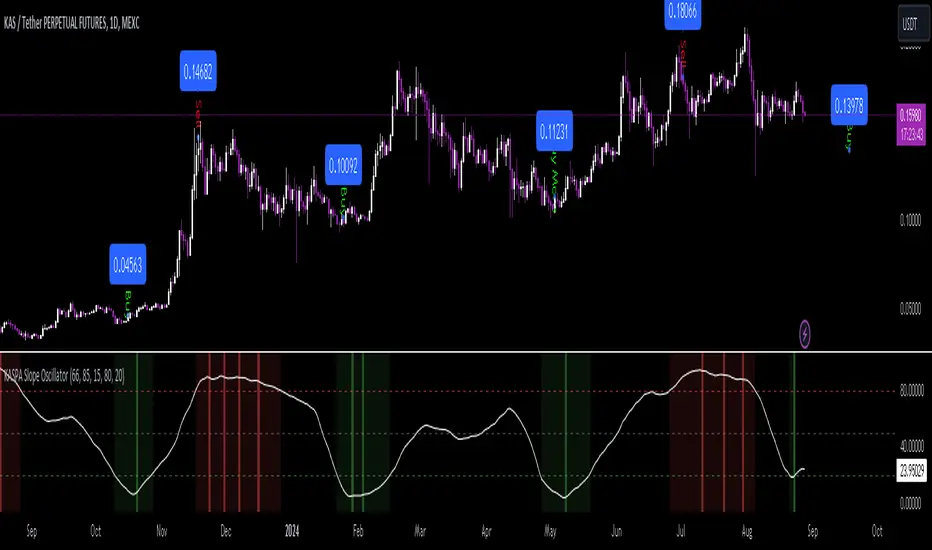
KASPA Slope OscillatorKASPA Slope Oscillator for analyzing KASPA on the 1D (daily) chart.
The indicator is plotted in a separate pane below the price chart and uses a mathematical approach to calculate and visualize the momentum or "slope" of KASPA's price movements.
Input Parameters:
Slope Window (days):
Defines the period (66 days by default) over which the slope is calculated.
Normalization Window (days):
The window size (85 days) for normalizing the slope values between 0 and 100.
Smoothing Period:
The number of days (15 days) over which the slope values are smoothed to reduce noise.
Overbought and Oversold Levels:
Threshold levels set at 80 (overbought) and 20 (oversold), respectively.
Calculation of the Slope:
Logarithmic Price Calculation:
Converts the close price of KASPA into a logarithmic scale to account for exponential growth or decay.
Rolling Slope:
Computes the rate of change in logarithmic prices over the defined slope window.
Normalization:
The slope is normalized between 0 and 100, allowing easier identification of extreme values.
Smoothing and Visualization:
Smoothing the Slope:
A Simple Moving Average (SMA) is applied to the normalized slope for the specified smoothing period.
Plotting the Oscillator:
The smoothed slope is plotted on the oscillator chart. Horizontal lines indicate overbought (80), oversold (20), and the mid-level (50).
Background Color Indications:
Background colors (red or green) indicate when the slope crosses above the overbought or below the oversold levels, respectively, signaling potential buy or sell conditions.
Detection of Local Maxima and Minima:
The code identifies local peaks (maxima) above the overbought level and troughs (minima) below the oversold level.
Vertical background lines are highlighted in red or green at these points, signaling potential reversals.
Short Summary:
The oscillator line fluctuates between 0 and 100, representing the normalized momentum of the price.
Red background areas indicate periods when the oscillator is above the overbought level (80), suggesting a potential overbought condition or a sell signal.
Green background areas indicate periods when the oscillator is below the oversold level (20), suggesting a potential oversold condition or a buy signal.
The vertical lines on the background mark local maxima and minima where price reversals may occur.
(I also want to thank @ForgoWork for optimizing visuality and cleaning up the source code)
Kaspa
Empirical Kaspa Power Law Full Model v3.1🔶 First we need to understand what Power Laws are.
Power laws are mathematical relationships where one quantity varies as a power of another. They are prevalent in both natural and social systems, describing phenomena such as earthquake magnitudes, word frequencies, and wealth distributions. In a power-law relationship, a change in one quantity results in a proportional change in another, typically following a consistent and predictable mathematical pattern.
🔶 Why Do Power Laws work for Bitcoin and Kaspa?
Power laws work for Bitcoin and Kaspa due to the underlying principles of network dynamics and growth patterns that these cryptocurrencies exhibit. Here's how:
1. Network Growth and User Adoption:
Both Bitcoin and Kaspa grow as more users join their networks. The value of these networks often increases in a manner consistent with Metcalfe’s Law, which states that the value of a network is proportional to the square of its number of users. This relationship is a form of a power law, where network effects lead to exponential growth as more users participate.
2. Mining and Hash Rate:
The mining difficulty and hash rate in cryptocurrencies like Bitcoin and Kaspa adjust based on network activity. As more miners join, the difficulty increases to maintain a stable rate of block production. This self-adjusting mechanism creates feedback loops that can be described by power laws, ensuring the stability and security of the network over time.
3. Price Behavior:
Astrophysicist Giovanni Santostasi discovered that Bitcoin’s price follows a power-law distribution over time. This means that despite short-term volatility, Bitcoin’s long-term price behavior is predictable and adheres to specific mathematical patterns. Santostasi's model provides a framework for understanding Bitcoin’s price movements and forecasting future trends. He also discovered that Kaspa might be following a power-law aswell but it might be to early to tell because Kaspa hasn't been around for too long(2years).
4. Resource Allocation and System Stability:
As the price of Bitcoin or Kaspa increases, more resources are allocated to mining, leading to more sophisticated mining operations. This iterative process of investment and technological advancement follows a power-law pattern, driving the growth and stability of the network.
In summary, the application of power laws to Bitcoin and Kaspa offers a structured framework for understanding their price movements, network growth, and overall stability. These principles provide valuable predictive tools for long-term forecasting, helping to explain the dynamic behavior of these cryptocurrencies.
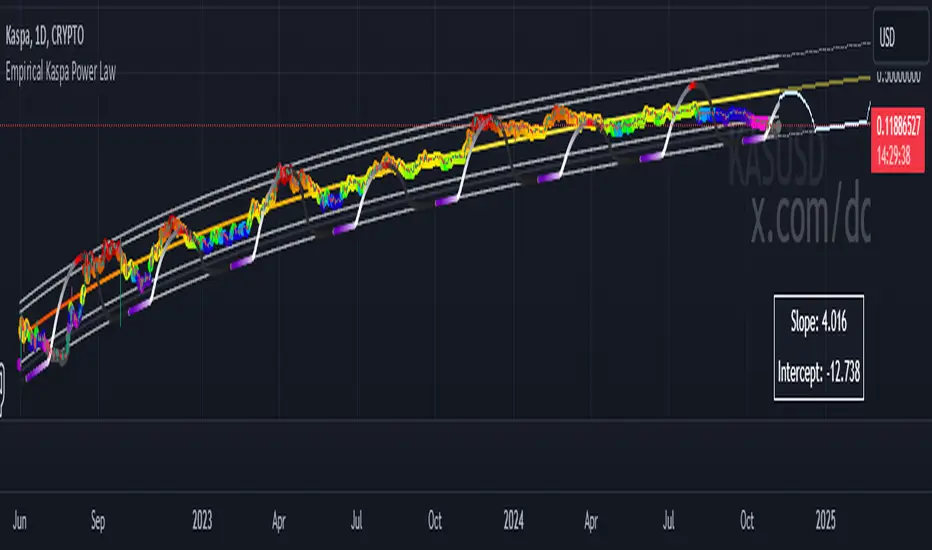
🔶 What does it look like on a chart?
Here is the Kaspa power law plotted on the KaspaUSD chart. Notice that the y-axis is in logarithmic scale. Unfortunately, TradingView does not allow the x-axis to be in logarithmic scale, which would otherwise make the power law appear as a straight line.
🔶 All the features of the Empirical Kaspa Power Law Full Model
This indicator includes a variety of scripts and tools, meticulously designed and developed to navigate the Kaspa market effectively.
🔹 Power Law & Deviation bands
The decision to use the lower two bands, marking an area between -40% to -50% below the power law, is based on historical analysis. Historically, this range has proven to be a great buying opportunity. In the case of Bitcoin, the bottom typically lies around -60% from the power law. However, for Kaspa, the bottom appears to be less distant from the power law. This discrepancy can be attributed to the differing supply dynamics of the two. Bitcoin undergoes a halving event approximately every four years, significantly reducing the rate at which new coins are introduced into circulation. This cyclical halving can lead to larger price fluctuations and a greater deviation from the power law. In contrast, Kaspa employs a more gradual reduction in its emission rate, with a 5% decrease each month. This consistent and incremental reduction helps Kaspa's price follow the power law more closely, resulting in less pronounced deviations. Consequently, the bottom for Kaspa tends to be closer to the power law, typically around -40% to -50%, rather than the -60% observed with Bitcoin.
The top two deviation bands are fitted to a few bubble data points, which are honestly not very reliable compared to the bottom bands that are based on a larger number of data points. When examining Bitcoin, we see that the bottoms are quite predictable due to the availability of thousands of data points, making it easier to identify patterns and trends.
However, predicting the tops is significantly more challenging because we lack a substantial amount of data for the peaks. This limited data makes it difficult to draw reliable conclusions about the upper deviation bands. As a result, while the bottom bands offer a robust framework for analysis, the top bands should be approached with caution due to their lesser reliability.
🔹 Alternating Sine wave
In observing the price behavior of Kaspa, an intriguing pattern emerges: it tends to follow a roughly four-month cycle. This cycle appears to alternate between smaller and larger waves. To capture this pattern, the sine wave in our indicator is designed to follow the power law, with both the top and bottom of the wave adjusting according to it.
Here's a simple explanation of how this works:
1. Four-Month Cycle: Empirically, Kaspa’s price seems to oscillate over approximately 120 days. This cycle includes periods of growth and decline, repeating every four months. Within these cycles, we observe alternating phases one smaller and one larger in amplitude.
2. Power Law Influence: The sine wave component of our indicator is not arbitrary; it follows a power law that predicts the general price trend of Kaspa. The power law essentially provides a baseline that reflects the longer-term price trajectory.
3. Diminishing Returns and Smoothing: To model diminishing returns, we adjust the amplitude of the sine wave over time, making it smaller as the cycle progresses. This helps to capture the natural tendency for price movements to become less volatile over longer periods. Additionally, the bottom of the sine wave adheres to the power law, ensuring it remains consistent with the overall trend.
🔹 Sine wave Cycle Start & End
Color transitions play a crucial role in visualizing different phases of the four-month cycle.
Based on empirical data, Kaspa experiences approximately 60 days of downward price action following each cycle peak, a period we refer to as the bear phase. This phase is followed by the bull phase, which also lasts around 60 days. To indicate the cycle peak, we have added a colored warning on the sine wave.
Cycle Start (Purple): The sine wave starts with a purple color, marking the beginning of a new cycle. This bull phase often represents a potential bottom or accumulation zone where prices are lower and stable, offering a strategic point for entering the market.
Cycle Top (Red): As the cycle progresses, the sine wave transitions through colors until it reaches red. This red phase indicates the top of the cycle, where the price is likely peaking. It's a critical area for investors to consider dollar-cost averaging (DCA) out of Kaspa, as it signifies a period of potential overvaluation and heightened risk.
These color transitions provide a visual guide to the market's cyclical nature, helping investors identify optimal entry and exit points. By following the sine wave's color changes, you can better time your investments, entering at the start of the cycle and considering exits as the cycle tops out.
🔹 Colored Deviation from the Power Law Bubbles
In trading, having a clear visual signal can significantly enhance decision-making, especially when dealing with complex models like power laws. This inspired the creation of the "deviation bubbles" in my indicator, which provides an intuitive, color-coded visual queue to help me, and other traders, better grasp market deviations and make timely trading decisions.
Here's a breakdown of how the deviation bubbles work:
1. Power Law Reference: The core of the indicator calculates a theoretical price level (the power law price) for Kaspa.
2. Deviation Calculation: For each day, the indicator computes the percentage deviation of the actual closing price from this power law price. This tells how much the market price diverges from the theoretically expected level.
3. Color-Coding Based on Deviation:
The deviation is categorized into various ranges (e.g., ≥ 100%, 90-100%, 80-90%, etc.).
Each range is assigned a distinct color, from red for extreme positive deviations to blue for extreme negative deviations.
This gradient helps in quickly identifying significant market deviations.
By integrating these bubbles into the chart, the indicator offers a simple yet powerful visual tool, aiding in recognizing critical market conditions without the need to delve into complex calculations manually. This approach not only enhances the ease of trading but also helps in overcoming the hesitation often faced when pulling the trigger on trades.
🔹 Projected Power Law Bands
Extends the current power law bands into the future using the same formula that defines the current power law.
Visual Representation: Dotted lines on the chart indicate the projected power law price and deviation bands.
Limitations: TradingView restricts how far these projections can extend, typically up to a reasonable future period.
These projected bands help anticipate future price movements, aiding in more informed trading decisions.
🔹 Projected Sine Wave
This projection continues to calculate the phase and amplitude, adjusting for diminishing returns and cycle transitions. It also estimates the future power law price, ensuring the projection reflects potential market dynamics.
Visual Representation: The projected sine wave is shown with dotted blue lines, providing a clear visual of the expected trend, aiding traders in their decision-making process.
Limitations: Again, TradingView restricts how far these projections can extend, typically up to a reasonable future period.
🔶 Why are all these different scripts made into one indicator?
As a trader and crypto analyst, I needed specific tools and customizations that no other indicator offered. Being a visual person, I rely heavily on visual triggers such as colors and patterns to make trading decisions. Initially, I developed this indicator for my personal use to enhance my market analysis with these visual cues. However, after sharing my insights, other traders expressed interest in using it. In response, I expanded the functionality and added various options to cater to a broader range of users.
This comprehensive indicator integrates multiple features into one tool, providing a powerful and flexible solution for analyzing market trends and making informed trading decisions. The use of colors and visual elements helps in quickly identifying key signals and market phases. The customizable options allow you to fine-tune the indicator to suit your specific needs, making it a versatile tool for both novice and experienced traders.
🔶 Usage & Settings:
This indicator is best used on the Daily chart for KASUSD - crypto because it uses a power law formula based on days.
🔹 Using the Indicator for 4-Month Cycles:
For traders interested in playing the 4-month cycles, this indicator provides a straightforward strategy. When the bubbles turn purple or the sine wave shows the purple start color, it signals a good time to dollar-cost average (DCA) into the market. Conversely, when the bubbles turn red or the cycle top is near, indicated by a red color, it’s time to DCA out of the Kaspa market. This visual approach helps traders make timely decisions based on color-coded signals, simplifying the trading process.
Historically, it was nearly impossible to accurately time all the 4-month cycle tops because they alternate each time. Without the combination of multiple scripts in this indicator, identifying these cyclical patterns and their respective peaks was extremely challenging. This integrated tool now provides a clear and reliable method for detecting these critical points, enhancing trading effectiveness.
🔹 Combining the visual queues for market extremes
The chart above illustrates the alignment of visual cues indicating market extremes. Notably, these visual cues—marked by red and purple boxes—historically pinpoint areas of extreme value or opportunities. When red aligns with red and purple aligns with purple, these zones have consistently indicated significant market extremes.
Understanding and recognizing these patterns provides a strategic advantage. By identifying these visual triggers, traders can plan and execute informed trades with greater confidence whenever similar scenarios unfold in the future.
Kaspa is perhaps one of the most cyclical and predictable cryptocurrencies in the market. Given its consistent behavior, traders might wonder why they would trade anything else. As long as there are no signs indicating a change in Kaspa's cyclical nature, there is no reason to make significant alterations to our predictions. This makes Kaspa an attractive option for traders seeking reliable and repeatable trading opportunities.
🔹 Settings & customization:
As a visually-oriented trader, it is essential to customize the appearance of indicators to effectively navigate the Kaspa market. The Indicator offers extensive customization options, allowing users to modify the colors of various elements to suit their preferences. For example, users can adjust the colors of the deviation bubbles, deviation bands, sine wave, and power law to enhance visual clarity and focus on specific data points. This level of personalization not only enhances the overall user experience but also ensures that the visual representation aligns with unique trading strategies, making it easier to interpret complex market data.
Additionally, users can change the power law inputs and other parameters as shown in the image. For instance, the Power Law Intercept and Power Law Slope can be manually adjusted, allowing traders to update these values. This flexibility is crucial as the future power law for Kaspa may evolve/change.
🔶 Limitations
Like any technical analysis tool, the Empirical Kaspa Power Law Full Model indicator has limitations. It's based on historical data, which may not always accurately predict future market movements.
🔶 Credits
I want to thank Dr. Giovanni Santostasi · Professor of physics and Mathematics.
He was one of the first who applied the concept of the power law to Bitcoin's price movements, which has been instrumental in providing insights into the long-term growth and potential future value of Bitcoin. Giovanni also offers coding classes on his Discord, which I attended. He personally taught me how to code specific things in Pine Editor and Python, sparking my interest in developing my own indicator.
Additionally, I would like to extend my gratitude to the following individuals for their invaluable contributions in terms of ideas, theories, formulas, testing, and guidance:
Forgowork, PlanC, Miko Genno, Chancellor, SavingFace, Kaspapero, JJ Venema.
Deviation in Euclidean Distance from the Kaspa Power Law v3.0🔶 First we need to understand what Power Laws are.
Power laws are mathematical relationships where one quantity varies as a power of another. They are prevalent in both natural and social systems, describing phenomena such as earthquake magnitudes, word frequencies, and wealth distributions. In a power-law relationship, a change in one quantity results in a proportional change in another, typically following a consistent and predictable mathematical pattern.
🔶 Why Do Power Laws work for Bitcoin and Kaspa?
Power laws work for Bitcoin and Kaspa due to the underlying principles of network dynamics and growth patterns that these cryptocurrencies exhibit. Here's how:
1. Network Growth and User Adoption:
Both Bitcoin and Kaspa grow as more users join their networks. The value of these networks often increases in a manner consistent with Metcalfe’s Law, which states that the value of a network is proportional to the square of its number of users. This relationship is a form of a power law, where network effects lead to exponential growth as more users participate.
2. Mining and Hash Rate:
The mining difficulty and hash rate in cryptocurrencies like Bitcoin and Kaspa adjust based on network activity. As more miners join, the difficulty increases to maintain a stable rate of block production. This self-adjusting mechanism creates feedback loops that can be described by power laws, ensuring the stability and security of the network over time.
3. Price Behavior:
Astrophysicist Giovanni Santostasi discovered that Bitcoin’s price follows a power-law distribution over time. This means that despite short-term volatility, Bitcoin’s long-term price behavior is predictable and adheres to specific mathematical patterns. Santostasi's model provides a framework for understanding Bitcoin’s price movements and forecasting future trends. He also discovered that Kaspa might be following a power-law aswell but it might be to early to tell because Kaspa hasn't been around for too long(2years).
4. Resource Allocation and System Stability:
As the price of Bitcoin or Kaspa increases, more resources are allocated to mining, leading to more sophisticated mining operations. This iterative process of investment and technological advancement follows a power-law pattern, driving the growth and stability of the network.
In summary, the application of power laws to Bitcoin and Kaspa offers a structured framework for understanding their price movements, network growth, and overall stability. These principles provide valuable predictive tools for long-term forecasting, helping to explain the dynamic behavior of these cryptocurrencies.
🔶 What does it look like on a chart?
Here is the Kaspa power law plotted on the KaspaUSD chart. Notice that the y-axis is in logarithmic scale. Unfortunately, TradingView does not allow the x-axis to be in logarithmic scale, which would otherwise make the power law appear as a straight line.
🔶 What is the deviation in Euclidean Distance from the Power Law?
Euclidean distance is a way to measure the straight-line distance between two points in a multi-dimensional space. When applied to a power law, it measures how far a data point is from the value predicted by the power-law formula.
🔶 Why are we measuring the Euclidean Distance from the Power Law & Discovery
On June 2, 2024, Plan C on Twitter announced a significant discovery: he and Dr. Giovanni Santostasi found that by examining the Euclidean distance from the Bitcoin power law, normalizing the data, and plotting it on an oscillator, it is possible to predict or time the market. In his post, Plan C hinted at the concept of "two-dimensional deviation," describing the result as the ultimate tool for navigating Bitcoin cycles. So, applying this technique to Kaspa, the only other cryptocurrency that might follow a power law might be a great idea!
This discovery leverages the power-law principles to create a sophisticated market timing tool, potentially offering insights into both Bitcoin and Kaspa's price movements.
🔶 Visual Representation of the Normalized Deviation in Euclidean Distance from the Kaspa Power Law
Steps Involved to visualize the indicator/oscillator:
1. Power Law Calculation:
The theoretical price is computed using the Power Law formula. This formula is based on the number of days since Kaspa's genesis block, simulating an ideal price growth trajectory.
2. Deviation Calculation:
For each day, the actual price is compared against the power law price for a range of days around the current date. The Euclidean Distance in days is the smallest number of days (either past or future) where this deviation is minimized.
3. Normalization:
The raw deviations over a fixed window are scaled to fit within a range of -100, 100. This normalized value is then smoothed using a simple moving average to produce a more readable oscillator.
4. Dynamic Coloring:
The oscillator's line color changes dynamically based on its value, providing an intuitive visual cue for traders.
🔶 Using the Oscillator
This indicator is best used on the Daily chart for KASUSD - crypto because it uses a power law formula based on days.
Identify Extremes:
When the oscillator shows high positive or negative values, it signals potential market extremes. This can help traders decide when to buy (when the market is oversold) or sell (when the market is overbought).
Values near -100 or 100 indicate significant deviation from the power law, highlighting potential market extremes.
🔶 Indicator Option's & Settings
Smooth Trends:
The smoothed line of the oscillator helps filter out market noise, allowing traders to focus on broader trends rather than short-term fluctuations.
Customize Your Analysis with Adjustable Price Sources:
One of the standout features of the Oscillator is its flexibility in using different price sources. You can customize the price source to better suit your trading style and analysis needs.
Price Source Selection:
The indicator allows you to choose the price source for its calculations. By default, it uses the average price of the daily candle (OHLC4), but you can adjust this to other price metrics such as the closing price, opening price, or any custom input.
Using Different Price Sources:
Using the daily candle average provides a balanced view of the day's trading activity, smoothing out intraday volatility.
Custom daily price sources:
Daily Highs:
Setting the price source to the daily high can help identify the maximum deviation when the market reaches its highest point during the day. This can be useful for spotting overbought conditions and potential resistance levels.
Daily Lows:
Conversely, using the daily low as the price source can highlight when the market hits its lowest point, indicating potential oversold conditions and support levels.
This flexibility ensures that the oscillator can be tailored to different trading strategies, allowing you to refine your analysis and make more informed decisions based on the price metrics most relevant to you.
By leveraging the Kaspa Power Law Deviation Oscillator, traders can gain a clearer perspective on market movements, making more informed decisions based on the deviation from a theoretically ideal price path. This tool adds another layer of insight to your trading strategy, helping you navigate the market with greater confidence.
🔶 LIMITATIONS
Like any technical analysis tool, the Deviation in Euclidean distance from the Kaspa Power law indicator has limitations. It's based on historical data, which may not always accurately predict future market movements.
