Liquidity & inducementsHi all!
This indicator will show liquidity and inducements.
I will continue to try to add different types of liquidity and inducements, at this moment it contains 6 kinds of liquidity/inducement, they are:
• Grabs
• Big grabs
• Sweeps
• Turtle soups
• Equal highs/lows (liquidity and inducement)
• BSL & SSL
And 1 type of inducement:
• Retracement
This description will contain indicator examples of each individual liquidity and inducement. They will all be with the default settings.
Settings
First you will find settings for the market structure (BOS/CHoCH/CHoCH+). Select left and right pivot lengths and if the pivots should have a label or not.
This is the base foundation of this indicator and is possible with my library 'PriceAction' ().
You will see solid lines for break of structures (BOS), change of characters (CHoCH) and change of character plus (CHoCH+).
The pivots found will be the core of this indicator and will show you when the closing price breaks it. When that happens a break of structure (BOS) or a change of character (CHoCH or CHoCH+) will be created. The latest 5 pivots found within the current trend will be kept to take action on.
A break of structure is removed if an earlier pivot within the same trend is broken and the pivot's high price for a bullish trend or low price for a bearish trend is more extreme than the BOS pivot's price.
You are able to show the pivots that are used. "HH" (higher high), "HL" (higher low), "LH" (lower high), "LL" (lower low) and "H"/"L" (for pivots (high/low) when the trend has changed) are the labels used.
In the next section ('Liquidity ($$$)') you can select which types of liquidity you want to see. Note that 'Equal highs/lows' can also show inducement (more on that later).
In the section afterwards ('Inducement (IDM)') you can select if you want retracement inducements to be visible or not. More information on what they are later on.
The section for each individual liquidity and/or inducement can first contain a line named 'Pivot', where you can set the pivot lengths (first left, then right). Then you can set the 'Lookback', which means that the 'Lookback' number of past pivots is to take action on. After that you set the 'Timeframe' for the pivots used. That means that all available liquidity/inducements will be from your desired timeframe. Lastly you set the color of the liquidity/inducement (either a single color or bullish followed by bearish colors).
Lastly in the settings you can select the font sizes for the market structure and liquidity/inducements and what style liquidity/inducements lines will have. The sizes defaults to 7 and has a dotted line look.
Grabs
Liquidity grabs and liquidity sweeps are very similar. It all depends on if the current bar closed above/below the liquidity pivot and on if its a continuation or reversal. In a liquidity grab the bar that's above or below the liquidity pivot was not closed above or below it. Like this:
Or
The visual feedback will be a dotted line between the liquidity pivot and liquidity grab bar and a linefill between the high of the liquidity grab bar and the liquidity pivot.
Indicator example:
Big grabs
This is another 'grabs' option. You can show an additional grab if you want to. I suggest having this grab from a higher timeframe or with larger pivot lengths than the other grab.
The default is with the chart timeframe and 10/10 as pivot lengths.
Indicator example:
Sweeps
A liquidity sweep is like a liquidity grab but with the difference that price closes above/below and has a continuation instead of a reversal. If the liquidity pivot was at the same bar as a BOS/CHoCH/CHoCH+ it will not be a liquidity grab but a structural break instead.
They can look like this:
Indicator example;
Turtle soups
If only one candle is beyond the pivot it could be a liquidity grab. It's a grab if price didn't close beyond the liquidity pivot, if so it's invaliditet. Turtle soups are basically false breakouts that takes liquidity (is a false breakout from a pivot with the lengths and timeframe from the settings).
The turtle soup can have a confirmation in the terms of a change of character (CHoCH). You can enable this in the settings section for 'Turtle soups' through the 'Confirmation' checkbox (enabled by default). The turtle soup strategy usually comes with some sort of confirmation, in this case a CHoCH, but it can also be a market structure shift (MSS) or a change in state of delivery (CISD).
The addition of turtle soups is possible through my script 'Turtle soup' ().
The drawing will be a dotted line between the liquidity pivot and the last bar of the false breakout and a box from the start of the false breakout to the end of it.
Indicator example:
Equal highs/lows
Equal highs/lows will always show liquidity, but might also show inducement. Inducement will be shown on equal lows if the trend is bullish and on equal highs if it's bearish, like this:
Or
Equal highs can only be created if the second pivot is lower than the first one. Equal lows can only be created if the second pivot is higher than the first one. If that is not the case it could be a liquidity grab.
When equal highs or equal lows are find that produces inducement (equal lows in a bullish trend and equal highs in a bearish trend), the indicator will first display inducement and will show liquidity once traders are induced to enter the security. Stop loss placement, for liquidity, is 0.1 * the average true range (ATR, of length 14). They will look like this:
Only inducement:
Inducement and liquidity:
Indicator example:
Equal highs/lows inducements can not be triggered after a BOS/CHoCH/CHoCH+. They are cleared upon a structural break.
BSL & SSL
Buyside liquidity (BSL) and sellside liquidity (SSL) will be shown. A pivot that's been mitigated (touched by price) can never be BSL or SSL. The BSL/SSL available will be dynamic while price moves (work in Replay and lower timeframes that moves fast) and pick the latest pivot/s (with left and right lengths from the 'Market structure' section). You can define how many BSL/SSL you want to see with a default value of 1, meaning only 1 BSL and 1 SSL can be shown. If there is no unmitigated high (BSL) or low (SSL), no BSL/SSL will be available to show. If there are BSL/SSL available they're very useful to use as targets for entering a trade.
The will look like this when available;
And without BSL available:
Or
And without SSL available:
Note that the examples without BSL/SSL available could have liquidity available from previous price legs.
This can be an example of a BSL/SSL sequence:
First both buyside and sellside liquidity is available:
Then a new low appears and new sellside liquidity is available:
Then buyside liquidity is mitigated, so only sellside liquidity is available:
A new high pivot appears and buyside liquidity is available again:
Lastly a bearish CHoCH happens and sellside liquidity is mitigated, only buyside liquidity is available:
Retracement
The first retracement after a BOS/CHoCH/CHoCH+ is considered an inducement with the mission to get traders into a trade prematurely to get stopped out. This level is shown and look like this:
Or
A retracement inducement is removed when a new BOS/CHoCH/CHoCH+ appears and it's not triggered.
---------------------------
As of now there aren't any alerts available. You cannot use the Pine Screener from Tradingview either to see new liquidity/inducement events. I have this planned for future updates though.
I hope that this long description makes sense, let me know otherwise! Also let me know if you experience any bugs or have a feature request or just want to share good settings to use.
Best of trading luck!
Inducement

SMC pro trend
The PSK FX Structure Indicator (also known as SMC pro trend) is a complete Smart Money Concepts (SMC) toolkit designed for professional structure traders.
It detects and visualizes key price structure elements such as BoS (Break of Structure), CHoCH (Change of Character), HH/HL/LH/LL, IDM zones, SCOB, sweeps, inside bars, and EMA confluence — all with precise non-repainting logic.
This indicator helps traders read price action like an institution — identifying liquidity shifts, order flow direction, and possible reversal or continuation zones.
⸻
⚙️ Core Features
🧭 Structure Detection
• Automatic detection of major structure points:
• HH – Higher High
• HL – Higher Low
• LH – Lower High
• LL – Lower Low
• Confirms BoS (Break of Structure) and CHoCH (Change of Character) events in both bullish and bearish markets.
• Marks each structure change with labels and connecting lines for clarity.
🔁 BoS / CHoCH Logic
• Solid line = BoS
• Dashed line = CHoCH
• Colored by direction:
• 🟩 Bullish = Green
• 🟥 Bearish = Red
• Option to show live BoS/CHoCH lines extending forward for real-time updates.
🧱 IDM (Internal Displacement Model) Zones
• Detects previous and live IDM zones (premium/discount zones).
• Highlights IDM candles that cause structural displacement.
• Labels each detected IDM level automatically.
⚡ Sweeps (Liquidity Grab Detection)
• Detects when price sweeps previous highs/lows.
• Marks these zones with dotted lines and optional “X” markers.
🧩 SCOB Pattern (Smart Candle Order Block)
• Detects and colors special SMC candle structures:
• Bullish SCOB → Aqua
• Bearish SCOB → Fuchsia
• Option to color all bars by trend direction or only highlight SCOB bars.
🧭 Internal Structure & Pivots
• Marks minor highs/lows (internal structure) for better IDM leg visualization.
• Helps identify early momentum shifts before major structure breaks.
🎯 1.618 Target Projection
• Projects 1.618 Fibonacci targets dynamically after BoS or CHoCH confirmation.
• Displays target price level with text label:
• Bullish → Green Target Line
• Bearish → Red Target Line
🧱 Inside Bar Zones
• Highlights inside bar formations (compression zones).
• Draws colored boxes between high/low of inside bar clusters.
• Marks the first and consecutive inside bars with custom bar colors.
📊 EMA Filter
• Includes a toggleable Exponential Moving Average (EMA) for confluence with trend direction.
• Customizable EMA length (default: 50).
🎨 Monochrome Mode
• Toggle between normal color mode and a clean monochrome theme for minimalistic charting setups.
⸻
🧠 How to Use
1. Identify Market Context:
Wait for a confirmed CHoCH to spot potential reversals or structure shifts.
2. Follow Order Flow:
Confirm trend direction via BoS lines and IDM zones.
3. Entry Planning:
Combine sweep detection, inside bar zones, and IDM levels for sniper entries.
4. Take Profit Zones:
Use the 1.618 target projection line to set high-probability TP levels.
5. Trend Filtering:
Use EMA direction to confirm whether to follow continuation or counter-trend setups.
⸻
🧩 Inputs & Settings
Category
Key Settings
Structure
Equal H/L toggle, HH/LL labeling, internal structure
BoS/CHoCH
Enable/disable labels, custom label size, bull/bear colors
IDM
Show previous/live IDM, label size, color options
Sweeps
Show sweep lines, X-markers, sweep line color
Bar Coloring / SCOB
Toggle bar coloring and SCOB pattern
Inside Bars
Highlight and box compression zones
1.618 Targets
Enable Fibonacci target projection
EMA
Toggle EMA and adjust length
Monochrome Mode
Apply single-color chart theme
⚠️ Notes
• This indicator is built for non-repainting structure confirmation.
• Use it on higher timeframes for swing structure or lower timeframes for IDM entry precision.
• Works best with clean price action charts (no cluttered oscillators or extra visuals).
⸻
💡 Recommended Use Cases
✅ SMC traders
✅ ICT/Order Block strategy users
✅ Liquidity and market structure traders
✅ Scalpers and swing traders using BoS/CHoCH logic
⸻
✍️ Author
Developed by PURNA SAMPATH KALUARACHCHI (PSK FX)
Smart Money Concepts researcher and price structure developer.
⸻

AriVestHub_SMCIntroduction to the AriVestHub_SMC Indicator
The AriVestHub_SMC indicator is designed and coded based on Smart Money Concepts (SMC). This tool has unique features that you won’t find in any other indicator built around SMC.
I’ve been active in the crypto market since 2019, and besides using the SMC strategy, I also apply several custom strategies in my trading. Personalized versions of these strategies will gradually be shared with you as well.
The main reason for developing this indicator was the gap in existing tools. Many times, setups like Valid Pullback or Inside Bar Candles appear on the chart but are not easily recognizable at first glance, and therefore they get ignored. This often leads to mistakes in Market Structure Mapping right from the beginning, which then causes errors in further analysis and predictions.
Since the SMC strategy is entirely built on market structure, any mistake in identifying its key components basically destroys the reliability of the analysis.
Unlike similar indicators that mostly just draw nice lines and zones on the chart for promotional purposes, AriVestHub_SMC aims to show the reality of the market, not beautify it. Price behavior is the result of trader psychology and the clash of different views—it doesn’t have to look neat and pretty all the time.
This indicator shows exactly what has happened in the market and the possible scenarios ahead. Once you use this tool and study this guide, you’ll clearly feel the difference compared to other common indicators. My main goal in creating AriVestHub_SMC was to give real help to traders—not just to sell or commercialize it.
The AriVestHub_SMC indicator is basically a Market Structure Mapping Engine (SMC Structure Mapping Engine), whose main task is to detect and accurately map market structure movements.
The market is full of exceptional conditions, and analyzing them without indicators and only by visual inspection is almost impossible. This often leads to errors, especially in strategies that are based on market structure.
One of the most important and valuable features of this indicator compared to similar ones is that, after extensively studying and manually analyzing various charts with indicators, I have coded almost all common scenarios as well as exceptional cases that occur under different market conditions.
________________________________________
Its key features include:
• BOS / CHoCH – Detecting
• breakouts and changes in market character
• IDM / Pullback – Confirming pivots and valid moves
• OF / OB – Marking key supply and demand zones
• SMT (Smart Money Trap) – Spotting invalid zones and smart money traps
• Liquidity Sweeps / Equal High-Low – Liquidity hunts and reversal setups
• Transfer Option – Automatically correcting structure in Single Leg scenarios
________________________________________
Basic Concepts in the AriVestHub_SMC Strategy
1. Inside Bar
An Inside Bar is a candle (or group of candles) whose price range falls between the High and Low of the previous candle.
In Smart Money and market structure analysis, these candles are usually ignored, and only the main candle is considered.
Simply put, an Inside Bar signals market pause and energy buildup—a place where both buyers and sellers are waiting for price to decide its next direction.
In the picture, you can see candles highlighted in a different color that fall within the main candle range. They should not be treated as independent candles, and all of them together should be considered as one.
________________________________________
2. Pullback
A pullback happens when price makes a temporary return after a main move. Even a single candle can cause it.
In Smart Money, a valid pullback is defined as:
• In an uptrend: if the Low of a candle breaks the Low of the previous candle which is not an Inside Bar, a valid pullback occurs.
• In a downtrend: if the High of a candle breaks the High of the previous candle which is not an Inside Bar, a valid pullback occurs.
Valid pullbacks are the points where the market gathers the energy needed to continue its move.
In the image below, both valid and invalid pullbacks are shown.
________________________________________
3. IDM – Inducement
Inducement is one of the most important concepts in AriVestHub_SMC. Without IDM, no structure in Smart Money can form.
Every valid pullback can be considered an IDM.
There are two types: Major IDM and Minor IDM.
Correctly identifying IDM is critical, because the entire market structure is mapped based on it.
After each BOS or CHoCH, a new HH or LL pivot is only confirmed if the price returns and touches the IDM.
• In an uptrend after BOS: the lowest price of the first valid pullback is the Major IDM, and the last pullback before reaching the Major IDM is the Minor IDM.
• In an uptrend after CHoCH: the highest price of the first valid pullback is the Major IDM, and the last pullback before reaching the Major IDM is the Minor IDM.
The same rules apply in reverse for downtrends.
In this strategy, Major IDM always takes priority.
The image shows different types of IDM, and the same applies for downtrends.
________________________________________
4. BOS – Break of Structure
A Break of Structure happens when price breaks its previous High or Low in the direction of the trend:
• In an uptrend: if the previous HH is broken, BOS occurs.
• In a downtrend: if the previous LL is broken, BOS occurs.
BOS confirms continuation of the current market trend.
________________________________________
5. CHoCH – Change of Character
Change of Character occurs when price moves against the previous trend:
• In an uptrend: if the previous LL is broken, CHoCH occurs.
• In a downtrend: if the previous HH is broken, CHoCH occurs.
CHoCH is usually a signal of a trend reversal or a deep market correction.
The image shows the overall market structure with BOS and CHoCH.
________________________________________
6. Order Flow
Order Flow zones are formed from valid pullbacks and are usually points where price reacts strongly.
They are defined as:
• In an uptrend: Last Selling Momentum Before pushing upside
• In a downtrend: Last Buying Momentum Before pushing dowside
Three main types of Order Flow used in this strategy:
• OF: Decisional (Dec) – The first valid OF after IDM, where the market makes its key decision.
• OF: Extreme (Ext) – The last valid OF after IDM, acting as the final defense of buyers or sellers.
• SMT – Smart Money Trap – All order zones before IDM, and those between Dec and Ext. These usually cause short-term, deceptive reactions and are not valid for trading.
In addition:
• Unmitigated Order Flow – A zone not yet touched, still a liquidity source.
• Mitigated Order Flow – A zone that has been touched, with reduced validity.
• Redefine Order Flow – Identifying internal OFs within a main unmitigated OF for more precise entries.
The image shows the different types of OF.
________________________________________
7. H/L Liquidity Sweep
A Liquidity Sweep happens when price breaks a previous High or Low with a wick, but the candle body fails to close beyond it.
• If the High is broken with a wick but the candle closes below it, a Liquidity Sweep occurs.
• If the Low is broken with a wick but the candle closes above it, a Liquidity Sweep occurs.
These setups are often signs of trapping traders and starting a move in the opposite direction. In fact, Liquidity Sweep points are among the best trading setups.
________________________________________
🔑 Final Note
All these concepts are like puzzle pieces: Inside Bar, Valid Pullback, IDM, BOS, CHoCH, Order Flow, and Liquidity Sweep.
When combined, they create a clear and accurate picture of the market’s real behavior.
________________________________________
Indicator Settings
1. Analyze From … To …
• Set the analysis time range.
• Another use: In ping-pong structures, you can add another copy of the indicator to the chart, set the starting point at the recent HH or LL, and map the internal structure for counter-trend trading.
________________________________________
2. Main
• Confirm CHoCH with wicks → If enabled, only the wick (not the body) is considered for BOS and CHoCH confirmation. Useful for spotting subtle liquidity-based breaks.
• Major / Minor IDM → Choose IDM type.
• Consider Inside Bar → Best kept enabled, so candles inside the previous candle are ignored.
________________________________________
3. Fib Ret
• Min pullback retracement % → Set the minimum retracement level.
• Helps identify valid pullbacks and gives more confidence in trend continuation.
• Meaning: if BOS happens, price must at least retrace by the minimum percentage before expecting the trend to continue.
________________________________________
4. BOS/CHoCH
• Display BOS and CHoCH on the chart with customizable color and style.
________________________________________
5. IDM
• Mark previous IDM : Show past IDMs.
• Mark live IDM : Show current active IDM.
• Customize IDM display options.
________________________________________
6. Pivots
• Display HH and LL pivots.
________________________________________
7. Transferring H/L IDM BOS/CHoCH
• Transfer in case of lack idmB or idmS → When the move is Single Leg and no valid IDM exists in the recent move, HH, LL, and IDM must be shifted and corrected. This adjusts the market structure.
• In case of transferring, remove all previous transferred Market Structure → If enabled, every time HH/LL and IDM need to be shifted, the transfer happens and the market structure is re-analyzed from scratch.
• Important: Often after one transfer, another Single Leg appears. This option keeps adjusting structure automatically, while doing it manually would be slow and error-prone.
________________________________________
8. Order Flow
• Display Decisional, Extreme, and Supply/Demand OFs.
________________________________________
9. H/L Sweeps
• Detect Liquidity Sweeps at Highs and Lows.
• These are very strong reversal setups.
________________________________________
10. Equal High/Low
• Show equal Highs and Lows where liquidity often accumulates.
________________________________________
11. Moving Average
• Add a moving average as a trend filter.
• Option to choose type (SMA/EMA) and length (e.g., 50 or 200).
• Usually:
o MA50 → For mid-term trends, quick confirmation.
o MA200 → For long-term trends, stronger confirmation.
________________________________________
12. Internal Structure (ZigZag)
• Show internal market structure as ZigZag.
________________________________________
13. Inside Bar Candles
• Display Inside Bars in color or with a box.

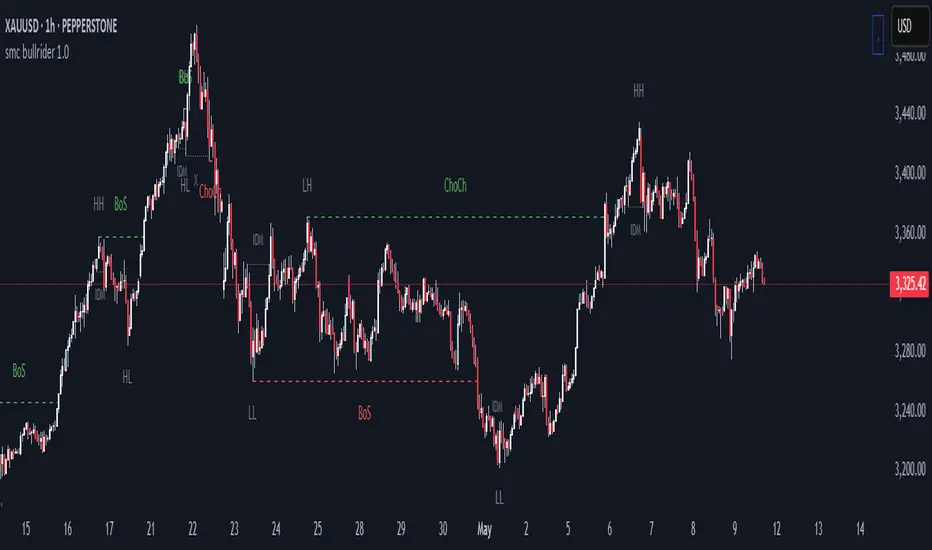
smc bullrider 1.0The smc bullrider 1.0 indicator is specifically crafted for mapping market structures. It excels in clearly recognizing type of Points Of Interest (SCOB) offering traders a straightforward and effective method to analyze market movements. It helps identify strategic entry points with precision.
🟠 Exploring Structure Mapping.
🔹This indicator presents a distinctive method for examining the market structure, emphasizing liquidity through the concept of 'Inducement'. Inducement plays a pivotal role in pinpointing essential structural indicators in the market, including Higher Highs (HH), Higher Lows (HL), Lower Lows (LL), and Lower Highs (LH).
🔹Consider Inducement as a strategically placed trap near supply or demand zones. It lures in eager buyers or sellers before the actual zone is reached, effectively creating liquidity. To validate an inducement, it must signify a legitimate pullback.
🔹A valid scenario arises when the price either sweeps or closes beyond the high or low of the preceding candle. In this context, the candle's color, whether bullish or bearish, holds no significance, and both situations are deemed valid. Inside bars are disregarded unless they meet this specific criterion. The indicator facilitates this process by automatically highlighting valid pullbacks with a distinctive gray round label.
🔹This feature serves not only as a visual guide but also as a vital tool for effortlessly comprehending market movements, offering a clear and visual representation of ongoing market trends
🟣 Understanding POI Functionality
🔹Single Candle Order Block (SCOB): Leveraging single-candle mitigation proves to be a powerful method for incorporating multiple entries into your successful trades.
🔵 How to Utilize the smc bullrider 1.0 Indicator:
🔹The smc bullrider 1.0 Indicator is crafted to elevate your trading strategy by pinpointing crucial order blocks and market signals. Below is a guide on how to make the most of the different components of the smc bullrider 1.0 Indicator:
🔹SCOB (Single Candle Order Block):
Application: SCOB is well-suited for scaling into a position. It is best utilized to increase positions when the market responds to OB or OB-EXT, signaling a potential reversal.
🟢Here's how to use it.
🔹Market Structure Drawing
This diagram depicts significant market indicators, such as instances of ascending prices (Higher Highs - HH) or descending prices (Lower Lows - LL). It serves as a valuable visual tool for comprehending the dynamics of market behavior
PICTURE (DIAGRAM)
Live Chart Example: Our indicator efficiently dissects market structure, showcasing the 'Inducement' concept with precision in real-time trends—highlighting HH, HL, LL, and LH
PICTURE (REAL CHART)
Valid Pullback ( IDM ):
Valid Pullback Example: This image illustrates a common situation where the price extends beyond the high or low of the preceding candle, signifying a valid pullback. Pay attention to the identifiable gray dotted line label marking the inducement point.
PICTURE (DRAW/REAL)
Single Candle Order Block (SCOB)
The provided chart showcases the SCOB in a real trading setting, highlighting its effectiveness in optimizing trades.
🟡 Summary
🔹smc bullrider 1.0 Indicator distinguishes itself in the realm of market analysis, with a distinct focus on structure mapping and high-probability Point of Interest (POI).
Furthermore, it provides a visual representation of three key areas for each market move: discount, premium, and the equilibrium area at 50%. Its innovative approach involves scrutinizing market structure using the 'Inducement' concept, a pivotal strategy for identifying vital structural markers and steering
Market Structure Inducements ICT [TradinFinder] CHoch BOS Sweeps🔵 Introduction
Market Structure is the foundation for identifying trends in the market, crucial in technical analysis and strategies like ICT and SMC. Understanding key concepts such as Break of Structure (BOS) and Change of Character (CHOCH) helps traders recognize critical shifts in the market. BOS, referring to a Market Structure Change (BMS), and CHOCH or Market Structure Shift (MSS) signal trend reversals in the market.
Additionally, the concept of Inducement, a vital tool in Smart Money strategies, allows traders to avoid price traps. Identifying valid pullback, valid inducement, POI, and Liquidity Grab helps traders find optimal entry and exit points and leverage Smart Money movements effectively.
Bullish Market Structure :
Bearish Market Structure :
🔵 How to Use
The Market Structure indicator is designed to help traders better understand market structure and detect price traps. By using this indicator, you can identify the right entry and exit points based on structural changes in the market and avoid unprofitable trades. Below, we explain the key concepts and how to apply them in trading.
🟣 Market Structure
Market Structure refers to the overall pattern of price movement in the market. Using this indicator, traders can identify uptrends and downtrends and make better trading decisions based on changes in market structure. The two key concepts here are Break of Structure (BOS) and Change of Character (CHOCH).
Change of Character (CHOCH) : CHOCH occurs when the market shifts from an uptrend to a downtrend or vice versa. These changes typically indicate a broader trend reversal, and the indicator assists you in identifying them accurately.
Break of Structure (BOS) : When the market breaks a key support or resistance level, it signals a change in market structure. This indicator helps you identify these breakouts in time and take advantage of trading opportunities.
🟣 Inducement
Inducement refers to price traps set by Smart Money to trick retail traders into making the wrong trades. This indicator helps you recognize these traps and avoid unprofitable trades.
Valid Inducement : Valid Inducement refers to deliberately created price traps by major market players to gather liquidity from retail traders. Once the market has collected sufficient liquidity, it makes the real move, and professional traders use this moment to enter.
🟣 Valid Pullback
A Valid Pullback refers to a temporary market retracement, indicating a price correction within the main trend. This concept is crucial in technical analysis as it helps traders enter trades at the right time and profit from the continuation of the trend. The Market Structure indicator can identify these valid retracements, allowing traders to enter trades with greater confidence.
🟣 Point of Interest (POI)
Another important concept in market analysis is the Point of Interest (POI), referring to key price areas on the chart. POI includes zones where significant price movements are likely to occur. The Market Structure indicator helps you locate these key points and use them as entry signals for trades.
🟣 Liquidity Grab
Liquidity Grab refers to a scenario where the market intentionally moves to areas where retail traders' stop losses are placed. The goal is to gather liquidity, allowing major players to execute trades at better prices. By using this indicator, you can spot these liquidity grabs and avoid falling into price traps.
🔵 Setting
ChoCh Detector Period : The period of identifying the major market levels that occur when they break ChoCh.
BoS & Liquidity Detector Period : The period of identifying minor levels, which are used to identify BoS and Liquidity levels.
Inducement Detector Period : The period of identification of Inducement levels.
Fast Trend Detector : This feature will help you update the major market structure levels sooner.
Inducement Type Detector : Two modes "Sweeps" and "Total" can be used to identify the levels of Inducement. In "Sweeps" mode only Levels detected by touch shadow. In "Total" mode, all Levels are detected.
🔵 Conclusion
In financial market analysis and forex trading, identifying Market Structure and Inducement is crucial. Market Structure helps you detect uptrends and downtrends, and understand Break of Structure (BOS) and Change of Character (CHOCH). The concept of Inducement also enables traders to spot Smart Money price traps and avoid unprofitable trades.
The Market Structure indicator is a powerful tool that, by analyzing the market structure and concepts like valid pullback and valid inducement, helps you make more precise trade entries. Additionally, by identifying POI and Liquidity Grab, the indicator gives you the ability to spot key market zones and use them to your advantage in trading.

LTF Inducement Levels [QuantVue]Inducement refers to a market manipulation tactic where large institutions or "smart money" create price movements that induce or lure retail traders into taking positions that are ultimately unfavorable. This concept is based on the idea that the market is moved by institutional traders who have the power and capital to manipulate prices to their advantage.
Within a dominant trend, there are frequently movements that go against the prevailing direction. These opposing moves are often driven by liquidity hunting on lower time frames. The price will experience a bounce or rejection, then aim for a previous short-term high or low before resuming its movement in alignment with the longer-term trend. Inducement involves specifically targeting these short-term highs or lows, which are potential zones where stop-loss orders may be located.
The LTF Inducement Levels indicator is designed to identify and display potential lower time frame (LTF) inducement levels on your chart. This indicator helps traders recognize price points where market manipulation might occur without needing multiple charts open.
Once a lower time frame pivot has been crossed, the level is removed from the current chart.
Multi-Timeframe Analysis:
The indicator uses a lower timeframe (LTF) to identify pivot highs and pivot lows, providing a granular view of potential inducement levels.
Configurable Parameters:
Lower Timeframe (LTF): The user can select the lower timeframe for analysis.
Pivot Length: The length used for identifying pivots.
Number of Pivots to Show: Limits the number of pivots displayed on the chart to avoid clutter.
Dynamic Pivot Management:
The indicator dynamically manages the pivots, adding new ones and removing old ones based on the configured maximum number of pivots to show.
It creates lines and labels for each pivot, which are updated as new pivots are formed or crossed.
Inducement Levels:
Pivot Highs: Marked with red lines and labeled with the price value.
Pivot Lows: Marked with green lines and labeled with the price value.
Cross Detection:
The indicator checks if the current price has crossed any of the identified pivots.
Once a pivot is crossed, the corresponding line and label are deleted.
Give this indicator a BOOST and COMMENT your thoughts below!
We hope you enjoy.
Cheers!

Structure_TradingHubThe smart money concept suggests that institutional traders have a greater understanding of the market and often have access to more information than retail traders. Therefore, by analyzing market structure, retail traders can align themselves with the actions of smart money and potentially profit from their moves.
This indicator considerably simplifies the process of identification of market structure for traders based on the TradingHUB-3 technical method. Therefore, it is quite different from the existing market structure or trend detection tools, even the other smart-money-based indicators.
How it works:
The indicator starts candlestick analysis from the given start point detecting followings items.
1) Identify valid pullbacks (minor Zigzag):
Uptrend: In the upward trend, each candle that hits a higher high (HH), acts as our checking candle, and if the next candle hits its low, a valid pullback is formed, and we marked the checking candle as the end of a minor leg. Note that we do not take inside bars into account. If the highest point of the leg hit, the lowest point is marked as the end of pullback leg. On the other hand, if the lowest point of the upward leg is hit, the pullback checking procedure is restarted as a downtrend. Note that the downward checking is restarted from the highest point (previous checking candle).
Downtrend: The pullback detection for downtrend follows the reverse procedure of uptrend.
2) Identify inducements (IDM)
The last pullback point (on the minor zigzag) considers as the inducement level. In the uptrend, if the price hit the IDM, the highest point on the major leg is accepted as a major higher high. Note, if the IDM point is equal to a major HL and hit by price, the highest point is accepted as a new HH and the previous HH and LL are deleted (i.e. the HH is transferred).
In the downtrend, it acts conversely.
3) Identify valid break of structures (BOS)
In the uptrend, if the price closed above the highest point between the previous accepted HH to the current candle, a BOS is accrued, and the lowest point in this time interval is accepted as a higher low (HL). In the downtrend, it acts contrariwise.
4) Identify valid change of characters (Choch)
In the uptrend, if the price closed below the lowest point between the previous accepted HL to the current candle, a Choch is accrued, and the major trend changes from uptrend to downtrend, and a new reverse IDM will be detected. In the downtrend, it acts inversely.
5) Identify major HH/HL/LL/LH points
By following the above steps, the major higher highs, higher lows, lower highs, and lower lows, as well as the major trend are detected. The major high and lows on the major trend can be displayed by zigzag style or bullet points with corresponding up/down color.
How to use it:
This indicator works in any chart timeframe, and it does not need much tunning for use. Although, two parameters can be modified:
1- Starting Point:
Mode 1: Go back a certain number of candles in the past to find the starting point.
Mode 2: Use the last major swing that is higher/lower point between X candles right and left.
2- Choch/BOS min ticks' confirmation: The user can set an extra pipettes value that price should close higher/lower than the major H/L for more confirmation.
A trader can use this indicator for trading through the following steps (Of course, the trader is not restricted in these steps and can act according to its trading strategy):
1- Recognize the trend direction by seeing the H/L or zigzag color.
2- Identify the unmitigated IDM, which is marked by "X". When the inducement hit, the level is marked by "IDM", and a major H/L is confirmed.
3- Identify an order block to trade on it. We recommend users to add "OrderBlock_TradingHub " indicator to identify valid order blocks easily according to this technical method.
4- Go to the lower timeframe to find a trigger.
Indicator Options:
1) Set the starting point based on a certain number of candles or a major swing.
2) Show/Hide Pullbacks zigzag
3) Show/Hide Inducements (IDM)
4) Show/Hide Change of Characters (CHoCHs)
5) Show/Hide Break of Structures (BOS)
6) Draw up/down Trend
7) Draw H/L Points (by major Zigzag or Bullets)
8) Set CHoCH/BOS min pipettes for confirmation
9) Change the color and style of elements on the chart

Buyside/Sellside Liquidity [Real-Time] (Expo)█ Overview
Buyside/Sellside Liquidity (Expo) is an indicator that identifies buy-side and sell-side liquidity in real time. Buy-side liquidity represents a level on the chart where short sellers will have their stops positioned. Sell-side liquidity represents a level on the chart where long-buyers will place their stops. These levels are found in areas where traders are "proven wrong" and, therefore, want to get out of their trades. Smart money will accumulate or distribute positions near these levels where many stops are placed and absorb all provided liquidity.
█ What is Buy-side and Sell-side liquidity?
Liquidity is the ability of a market to absorb large orders without significantly affecting the asset's price. Buy-side liquidity refers to the ability of buyers to buy large amounts of contracts without significantly affecting the price. Sell-side liquidity refers to the ability of sellers to sell large amounts of contracts without significantly affecting the price. This type of liquidity is important for large institutional investors, such as hedge funds and investment banks, who need to buy/sell large amounts of contracts without significantly affecting the price.
█ How to use
The price will always seek liquidity to either reverse or continue in the current move.
Reversals
Reversals are common around these levels since many traders are forced to close their positions, pushing the price in the other direction. Look for price actions that confirm a reversal around those levels.
Continuations
Liquidity is also a must for a trend to continue. If the price pushes through the liquidity levels and the current order flow structure is intact, traders should look for a continuation setup.
Inducement
Inducement is the act where smart money manipulates the price to access liquidity. Buy-side and Sell-side liquidity levels can be used to identify potential areas of inducement.
-----------------
Disclaimer
The information contained in my Scripts/Indicators/Ideas/Algos/Systems does not constitute financial advice or a solicitation to buy or sell any securities of any type. I will not accept liability for any loss or damage, including without limitation any loss of profit, which may arise directly or indirectly from the use of or reliance on such information.
All investments involve risk, and the past performance of a security, industry, sector, market, financial product, trading strategy, backtest, or individual's trading does not guarantee future results or returns. Investors are fully responsible for any investment decisions they make. Such decisions should be based solely on an evaluation of their financial circumstances, investment objectives, risk tolerance, and liquidity needs.
My Scripts/Indicators/Ideas/Algos/Systems are only for educational purposes!

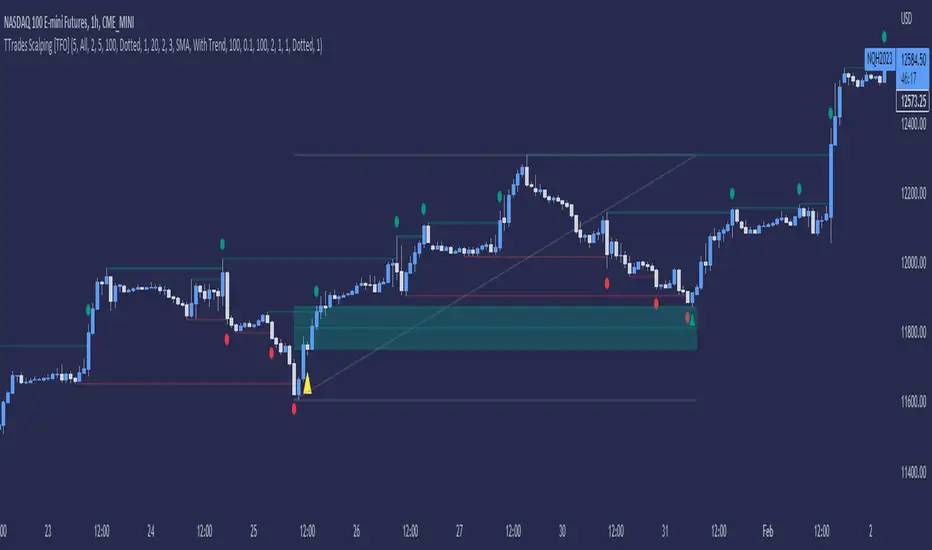
TTrades Scalping Indicator [TFO]Specialized for the scalping strategy of TTrades, this indicator focuses on inducement / stop hunt setups, utilizing additional factors such as volume spikes and trend bias to filter out setups that don’t fit the user-defined criteria.
The idea is that price is always seeking liquidity by reaching for trivial pivots where traders may put their stop loss orders. When price seeks these levels and stops these traders out, we may observe an influx of volume due to the large number of shares/contracts being exchanged given the large number of traders that have similar orders.
If price quickly comes back into the original range, we may determine this to be a stop hunt or a fakeout, only for price to proceed in the opposing direction. If it continues running and creates a displacement leg, we look to capitalize on that movement by tracking the Optimal Trade Entry (62 - 79% retracement), anchored to the swing pivot created as a result of the stop hunt.
Aside from volume, we can also use existing technical indicators like VWAP and SMA’s to ensure we’re only taking trades with the current trend (or against it). Simple criteria like this can help keep us out of low probability market environments.
Inducement / Stop Hunt [TFO]This indicator shows inducement / stop hunts accompanied by volume spikes. The idea is inspired by ICT (Inner Circle Trader) concepts where price is always seeking "liquidity" by reaching for trivial pivots where the average retail trader would put their stop loss. When price seeks these levels and stops out these traders, you might expect an influx of volume due to the high number of shares/contracts being exchanged. And when there is an above-average spike in volume at these prices, it's possible to assume "smart money" may be buying retail's sell stops and vice versa. This is just my interpretation - I'm aware that ICT doesn't use volume as part of his analysis, and often advocates against using volume altogether, however I personally find it to be a great analytical tool in this context.
In my opinion this works best on 1m and smaller timeframes. Volume gets very diluted on timeframes greater than 1-3 minutes. It's easier to find volume spikes on very small timeframes like the 15s.

Liquidity Levels MTF - SonarlabThis indicator uses Pivot Points to identify Liquidity Levels in the market. Liquidity Levels are levels in the market where you would expect price to be pulled towards.
Liquidity Levels by Sonarlab also has an option to show Higher Timeframe Liquidity Levels.
Below are the indicators settings:
Liquidity Mitigation Options
The Indicator has options for you to choose what happens to the Liquidity line/boxes once it has been mitigated. Either Keep them on the chart, or remove them.
Display Styles
Choose how the levels are displayed, either with Lines or Boxes.
Set the your Extension options, by keeping the lines/boxes "short" or extend to current price, or maximum to the right
Colors and Styles
Set colors and styles for all lines and boxes

Volume SpikesShows volume spikes over a certain threshold, using a symbol's volume moving average as the baseline. Offers a few different filters regarding candle shapes and types, in an attempt to catch quick moves on extremely low timeframes (sub-1m).
Ultimately I would like to integrate this logic into an indicator that contains automated stop raid/inducement detection.
