Enhanced VolumeEnhanced Volume allows you to show multiple highlights on your volume:
HVE - Highest Volume Ever
HV1 - Highest Volume in 1 Year
Volume Average Moving Average
Projected Volume - Shows the projected volume based on the time of the bar left
2x and 3x volume bars. Shows to bars of where the volume needs to hit to be 2 or 3x above average
Color coding of low volume bars and high volume bars
Up/Down Volume
% Change
HVE

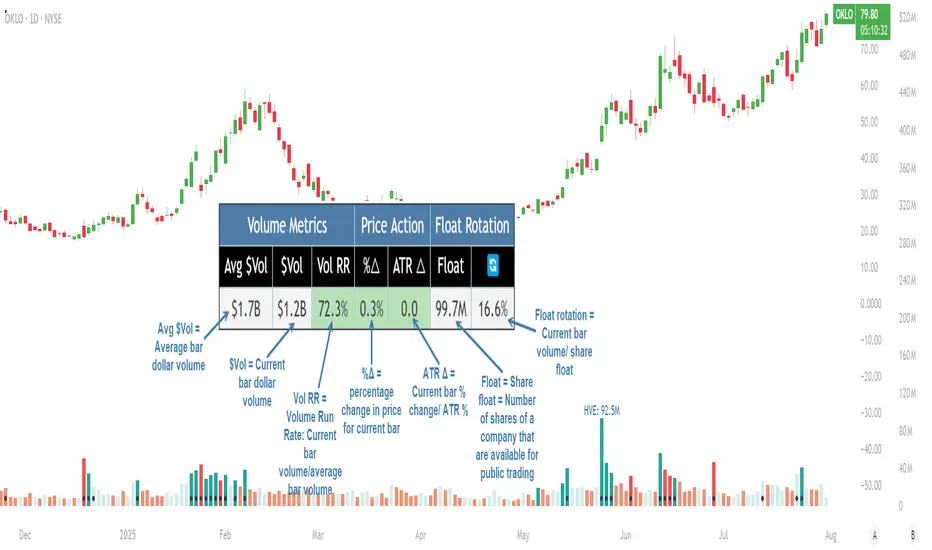
Pristine Volume AnalysisThe Pristine Volume Analysis indicator organizes volume, liquidity, and share structure data, allowing users to quickly gauge the relative volume a security is trading on, and whether it is liquid enough to trade🏆
Volume is an important metric to track when trading, because abnormally high volume tends to occur when a new trend is kicking off, or when an established trend is hitting a climax.
Track only the most important metrics, reducing mental clutter and noise:
▪ Volume run rate - Candle volume/ Avg candle volume
▪ Security liquidity - Average volume and average dollar volume
▪ Float rotation - Candle volume/ Float
This script automatically detects and flags the following conditions on volume bars:
▪ High volume run rate buying/selling based on user-defined thresholds
▪ HVE (highest volume ever) & HVY (highest volume in a year)
▪ High float rotation based on user-defined thresholds
Settings and Preferences
Customize this script based by setting preferred colors and thresholds:
Custom Alerts on HVE and HVY
Set custom alerts on a single equity or an entire watchlist to receive notifications when volume hits HVE or HVY.
Screen for HVE or HVY
Using the Pine Screener, scan watchlists for equities that have reached HVE or HVY.
Note: The Pine Screener is limited to calculations on the last 500 bars. If a symbol has less than 500 bars and has reached HVE, it will be included in the screener results. All symbols with more than 500 historical bars will not be included in the scan.
Volume Analysis Use Case : Confirming a breakout (1/3)
A high volume run rate as a stock breaks out to new highs can confirm a change of character and increase the odds of success on long setups. SMCI put in an HVE candle in January '24, sparking a super-performance run.
1-Month follow-through +137%
SMCI had plenty of gas left in the tank after putting in it's first HVE candle. The rest is history!
Volume Analysis Use Case : Gauging sentiment (2/3)
When a stock advances on repeated high run rate volume and an increasing angle of ascent (parabolic) , it can be a good indication that sentiment is overheated and it is time to reduce exposure to the stock.
Note:25% is the default float rotation threshold. This value can be customized based on your own trading style and preferences.
Following the parabolic ascent on high volume run rate and float rotation, HIMS topped, falling ~67% over the next two months!
Volume Analysis Use Case : Passing on a meme stock (3/3)
High float rotation often goes hand-in-hand with high stock volatility. One might opt out of trading a stock if it is outside their risk tolerance.
Volume ScoreVolume Score Indicator (VSCR)
The Volume Score Indicator (VSCR) is a powerful tool designed to enhance your trading analysis by evaluating volume activity relative to historical levels. This indicator provides valuable insights into volume trends, highlighting significant volume spikes and their implications for price movements.
Key Features:
1. Volume Analysis:
a.) Volume (RVol): Calculates the relative volume based on the 50-day simple
moving average.
b.) High Volume Conditions: Identifies conditions where volume is significantly higher
than historical levels, including:
b1.) Highest Volume in 1 Year (HV1Y): Volume exceeds the highest volume of
the year.
b2.) Highest Volume in 3 Months (HVQ): Volume exceeds the highest volume of
the past 3 months.
c.) Pocket Pivot Volume (PPV):
c1.) High Relative Volume: Volume is at least twice the 50-day moving average
volume.
c2.) Pocket Pivot Volume: Latest bar volume is higher than the highest down
volume bar of the last 10 days.
2.Volume Score Calculation:
a.) Computes a cumulative volume score (VSCR) based on the frequency and magnitude
of identified high-volume conditions over a user-defined look-back period (default:
90 days).
b.) Adds points to the volume score based on relative volume (RVol). For example, if
the current day's relative volume is 500% of the 50-day average volume, 5 points
will be added to the volume score.
Formula: Volume Score = Volume Score + (RVol / 100)
3. Customizable Plotting:
a.) High Volume Plotting (HV): Option to plot circles above bars when HV1Y or HVQ
conditions are met.
b.) Pocket Pivot Volume Plotting (PPV): Option to plot circles above bars when any of
the Pocket Pivot Volume conditions are met.
4.Interactive Table Display:
a.) Configurable table to display key volume metrics and scores.
b.) Customizable table layout (horizontal or vertical) and positioning (top, middle,
bottom; left, center, right).
c.) Dynamic Background Coloring: The table cells are color-coded to highlight
significant volume levels and scores:
c1.) Blue: Indicates a very high volume score or count, signaling exceptionally
strong volume activity (e.g., count >= 15, score >= 50).
c2.) Green: Represents a high but not extreme volume level, suggesting notable
volume activity (e.g., 10 <= count < 15, 40 <= score < 50).
c3.) Orange: Marks moderate volume activity, which is still above average but
less pronounced (e.g., 7 <= count < 10, 25 <= score < 40).
c4.) Red: Signifies relatively low volume activity, potentially indicating less
significant volume changes (e.g., count < 7, score < 25).
5.How to Use:
a.) Input Parameters:
a1.) Plot HV: Toggle to plot high volume i.e. HV1Y and HVQ conditions on the
chart. When enabled green plot will appear above the price bars on the
chart.
a2.) Plot PPV: Toggle to plot pocket pivot volume conditions on the chart. When
enabled orange plot will appear above the price bars on the chart.
a3.) Look Back Period: Define the period for looking back to calculate volume
conditions and scores (default: 90 days).
b.) Table Display:
b1.) Panel Options: Customize the table's position, layout, text size, and colors
to suit your preferences.
b2.) Volume Metrics: The table displays counts of high-volume events (HV1Y,
HVQ & PPV) and the cumulative volume score, color-coded based on
thresholds for easy interpretation.
c.) Practical Applications:
c1.) Volume Spike Detection: Quickly identify significant volume spikes that
may indicate institutional buying.
c2.) Historical Volume Context: Understand current volume activity in the
context of historical volume patterns.
c3.) Enhanced Decision Making: Use volume insights to make informed trading
decisions, particularly around areas of significant volume changes.
This indicator is an essential tool for traders looking to incorporate volume analysis into their trading strategy, providing clear and actionable insights into volume dynamics.
***Note***
Candlestick Exclusion: The indicator ignores any candles where the closing price is less than the opening price. All calculations and analysis are based on candles where the closing price is higher than the opening price.
