Adaptive Bandpass Filter [ChuckBanger]An band-pass filtered Oscillator that has adaptive buy and sell thresholds. You buy or sell when the blue line is under or over the pink line. The histogram is there to show how big the momentum is on a potential pump or dump.
Histogram

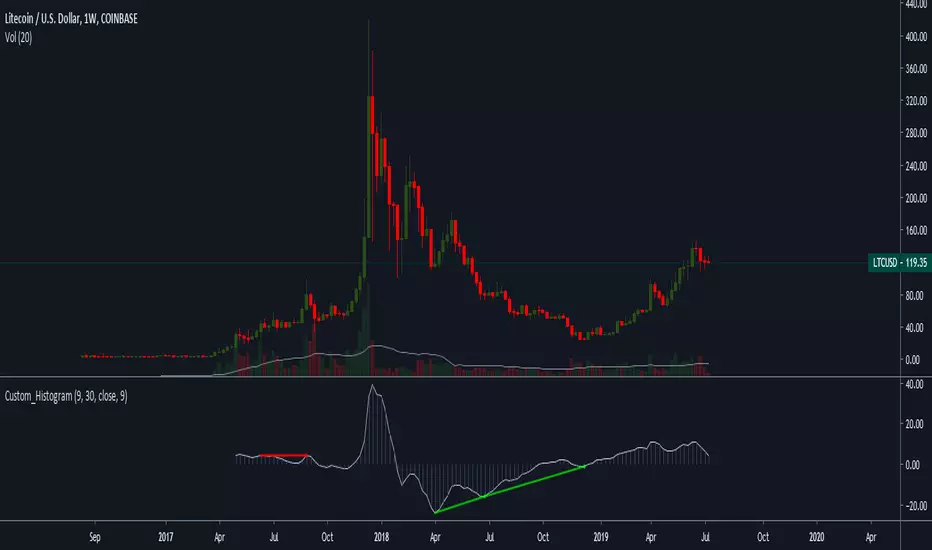
BTC Power Law HistogramBased on "Bitcoin’s natural long-term power-law corridor of growth" by Harold Christopher Burger

Schaff Trend Cycle w/ MACD HistogramWhat Is Schaff Trend Cycle? (Reference from Investopedia)
The Schaff Trend Cycle (STC) is a charting indicator that is commonly used to identify market trends and provide buy and sell signals to traders. Developed in 1999 by noted currency trader Doug Schaff, STC is a type of oscillator and is based on the assumption that, regardless of time frame, currency trends accelerate and decelerate in cyclical patterns.
How STC Works
Many traders are familiar with moving average convergence/divergence (MACD) charting tool, which is an indicator that is used to forecast price action and is notorious for lagging due to its slow responsive signal line . By contrast, STC’s signal line enables it to detect trends sooner. In fact, it typically identifies up and downtrends long before MACD indicator.
While STC is computed using the same exponential moving averages as MACD, it adds a novel cycle component to improve accuracy and reliability. While MACD is simply computed using a series of moving average, the cycle aspect of STC is based on time (e.g. number of days).
It should also be noted that, although STC was developed primarily for fast currency markets, it may be effectively employed across all markets, just like MACD. It can be applied to intraday charts, such as five minutes or one hour charts, as well as daily, weekly, or monthly time frames.
What's included the indicator?
Zero MACD lag algorithm (can be enabled/disabled)
MACD Histogram (has a different calculation to show the trend clearly. Can revert to original algo but will not truly reflect the current trend.)
Histogram peaks
STC pivots
How to use this indicator?
Use the STC overbought/oversold to determine trend strength.
Use the MACD zeroline crossover to determine the trend if bull/bear
For risky trades:
Long or cover when STC shows a bullish pivot. Exit or short on STC bear pivots
For conservative trades:
Long when MACD histogram crosses above midline. Exit or short on STC bear pivots
Settings:
Default is Fast - 5, Slow - 20. You can turn it up to Fast - 10, Slow - 30.
You can enable or disable certain features if you dont like to see them.

Aroon Histogram + CMO Multiple Time Frames [ChuckBanger]This script is based on my Aroon Histogram + CMO:
But it has the option to use it multiple time frames to automatically check for bull and bear crossover on CMO and it has the ability for the trader to set alert on crossovers

Buying and Selling Smoothed with HistogramBuying and Selling Smoothed with Histogram
Smoothed version with version with a red line representing the selling pressure and a green line which represents the Buying pressure.
If the green line is above the red line it would mean that the Buying pressure is more and vice versa.
The difference between the two is plotted as a Histogram. This is a cumulative value of the buying and selling pressure and provides a easy visual presentation of the dominating pressure.

MACD and RSI divergence by Rexio v2Hi everyone!
I wrote this indicator for intraday trading and it cannot be use only by itself you need to at least draw some S/R lines to make it useful. It is based at MACD histogram and gives signal when it sees divergence on MACD/RSI/MACD's Histogram (or all at once - settings) when macd's histogram switchs trend. Im using it to playing with a trend most of the time looking for hidden divergence at higher time frame and after that looking for regular divergence at lower time frame.
Im not a computer programist nor professional trader so it is only for educational purposes only.

MACD histogram divergence by Rexio v1Hi everyone!
I wrote this indicator for intraday trading and it cannot be use only by itself you need to at least draw some S/R lines to make it useful. It is based at MACD histogram and gives signal when it sees divergence on MACD's Histogram when macd's histogram switchs trend. Im using it to playing with a trend most of the time looking. It highlights candles which can give good singnals to play with a trend (its based on ema200 and RSI overbought and oversold zones).
Im not a computer programist nor professional trader so it is only for educational purposes only.
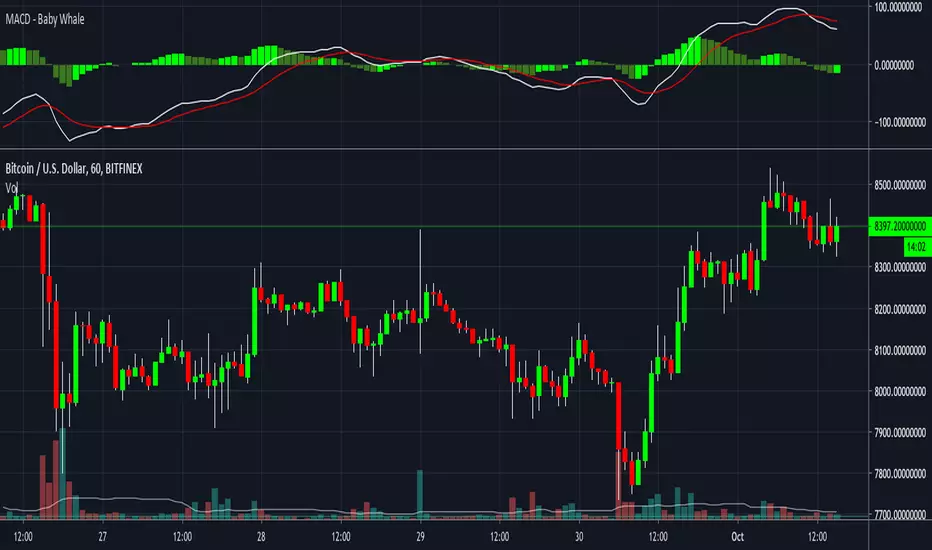
MACD - Baby WhaleI spiced the standard MACD indicator up a bit to make it more visible.
When using the MACD:
1. Never go short when the MACD lines are in the negative.
2. Never go long when the MACD lines are in the positive.
3. Always wait for an uptick / downtick on the histogram before you start your trade.
The MACD Histogram can also show you Divergence.
When the price goes up but the Histogram can't make new highs, it might be a good time to think about shorting.
If you want access, just send a message please.
Much love from Baby Whale!!
🙏❤️🐳

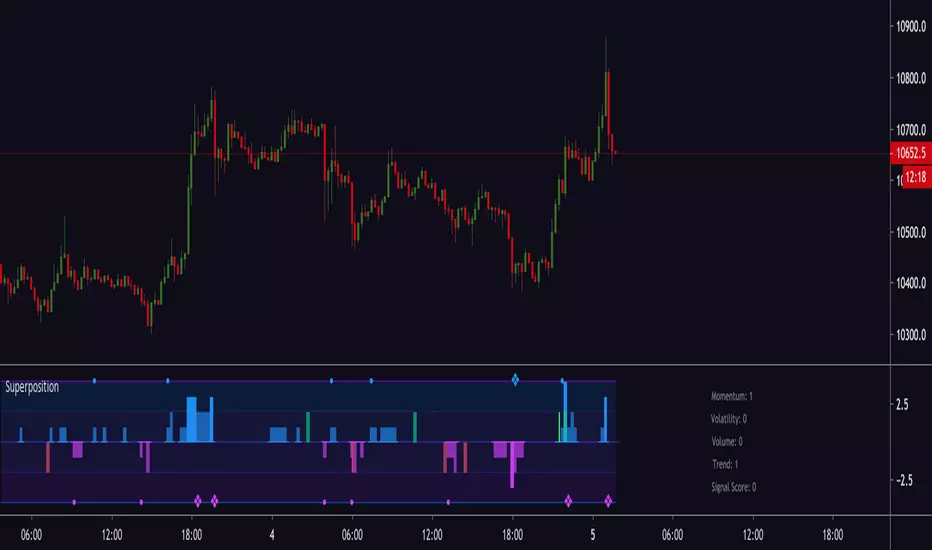
Magick SuperpositionExperimental histogram based on multi indicator signals.
Generates a score based on:
Trend
Volatility
Momentum
Price and volume changes
Candlestick patterns
and many more.
Can be used to detect top and bottoms, reversals, trend, best moments to enter a trade and more.
Invite-only.
Trial available.
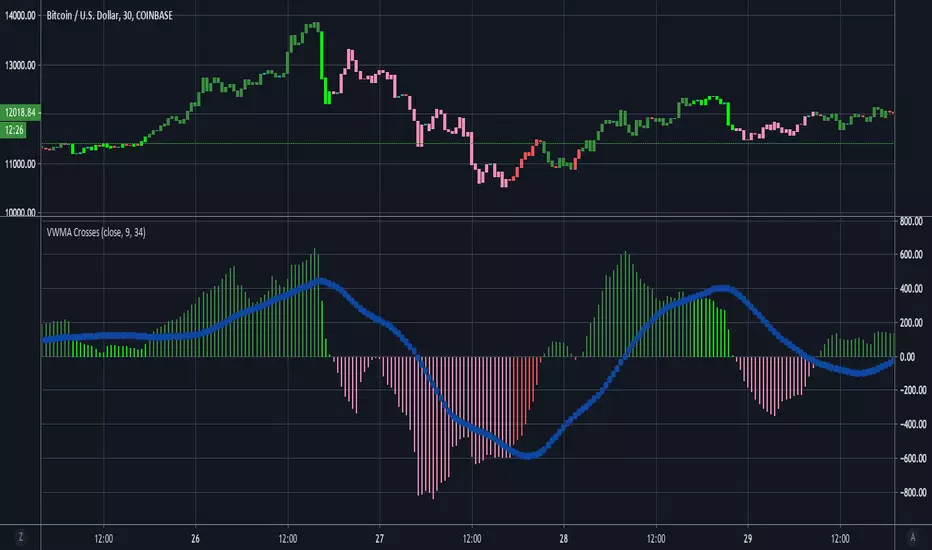
VWMA CrossesThis is a simple tool that gives traders a simple visual representation of Volume-Weighted Moving Average ( VWMA ) crossovers that is pretty similar to the MACD . We don't typically trade solely based on the VWMA , but it is definitely one of our go-to tools when combining multiple indicators.
When trading with VWMA's, it is common to enter a position when the fast VWMA crosses over the slow VWMA . In other words, the fast VWMA was previously less than the slow VWMA and is now greater in value than the slow VWMA . Conversely, traders often exit their positions when the fast VWMA crosses under the slow VWMA .
This tool plots the absolute value of the difference between the fast and slow VWMA's as a histogram. When the difference between the fast and slow VWMA's is greater than zero (meaning fast > slow), then the bars are green. The bars then turn red when the fast VWMA is less than the slow VWMA . The blue circle-line is a Simple Moving Average of the difference between the two lines.
Here's a quick guide to interpreting the chart:
if (fast VWMA > slow VWMA ) and (difference < sma of differences)
then color = lime green
if (fast VWMA > slow VWMA ) and (difference > sma of differences)
then color = dark green
if (fast VWMA < slow VWMA ) and (difference < sma of differences)
then color = light red
if (fast VWMA < slow VWMA ) and (difference > sma of differences)
then color = dark red
~Happy Trading~
Volume Momentum‴ | Volume Momentum Colored HistogramVolume Momentum‴ is a Volume Pressure indicator that allows you to have a better understanding and interpretation of its behavior once you are able to see it through an histrogram.
Notice that is histogram has intern bars that allows you to understand the forces of the pressure (positive or negative forces).
This indicator allows you to see the end of the highest price tick which allows you to sell right before price drop.
What is the best is that you can use it with any kind of graphic that it will always considere the real open, close, high and low trading values.
To have access to this indicator, please contact me at: contato @ moneywise . com . br
Believe me, this indicator will make your life much easier!

BOSS Smooth Stochastic RSI Histogram Oscillator With Alerts THE BEST FOREX, BINARY OPTIONS, AND CRYPTO INDICATORS FOR TRADINGVIEW.COM
Our smooth stochastic rsi in column form with buy and sell alerts.

Combo Strategy 123 Reversal & (H-L)/C Histogram This is combo strategies for get
a cumulative signal. Result signal will return 1 if two strategies
is long, -1 if all strategies is short and 0 if signals of strategies is not equal.
First strategy
This System was created from the Book "How I Tripled My Money In The
Futures Market" by Ulf Jensen, Page 183. This is reverse type of strategies.
The strategy buys at market, if close price is higher than the previous close
during 2 days and the meaning of 9-days Stochastic Slow Oscillator is lower than 50.
The strategy sells at market, if close price is lower than the previous close price
during 2 days and the meaning of 9-days Stochastic Fast Oscillator is higher than 50.
Second strategy
This histogram displays (high-low)/close
Can be applied to any time frame.
WARNING:
- For purpose educate only
- This script to change bars colors.

4H MACD Histogram on 1HIndicator is designed for 1 hour time-frame and it shows the value of 4 hour MACD histogram

Absolute Strength HistogramThe Absolute Strength Histogram
Absolute Strength Histogram is composed of two separate signals - Bulls and Bears. Both signals are plotted on the same graph. By doing so we can see the strength of the buyers and sellers in comparison to one another. When the Bulls Signal is above the Bears Signal, the histogram is blue and the market tends to be trending up (go long). When the Bears Signal is above the Bulls Signal, the Histogram turns red and the market tends to be trending down (go short).
There are two methods for calculation, the RSI and the Stochastic, and both have their merits.
There are also several smoothing algorithms added that you can select from the drop-down. Note that higher smoothing will notify you of trend changes later. Lower smoothing will give you quicker signals at the cost of more errors (false signals or noise).
Happy Trading :)

MACD - Baby WhaleI spiced the standard MACD indicator up a bit to make it more visible.
When using the MACD:
1. Never go short when the MACD lines are in the negative.
2. Never go long when the MACD lines are in the positive.
3. Always wait for an uptick / downtick on the histogram before you start your trade.
The MACD Histogram can also show you Divergence.
When the price goes up but the Histogram can't make new highs, it might be a good time to think about shorting.
If you want access, just send a message please.
Much love from Baby Whale!!
🙏❤️🐳

Top 10 Forex Swing Screener V 1.0
Top 10 Forex Swing Screener
Options:
Left-bars and Right-bars look back to find Top | Bottom point.
Set Alarm: After add script on your chart, click on add alarm and select the scrip name below your chart symbol, then select alarm you need and add.
Guide for colors and shapes:
Green: Price Cross Over high swing.
Red: Price Cross Under low swing.
Orange: Price Cross Over low swing or Price Cross Under high swing.
Green Triangle Up: pivot High in symbol.
Red Triangle Down: pivot Low in symbol.
Note: The script operates independently of the chart you in. for use this script, you can favorite it and then apply to any chart.

DiNapoli MACD (DEMA)DiNapoli MACD (DEMA) is a custom indicator used in the context of identifying the position of strong hands.
This version of the indicator includes the following features :
Show/Hide the Oscillation Lines
Highlight Cross with Signal Line
Show Zero Line
Show Divergences (experimental)
For convenience it also includes Custom Alerts . Now it is possible to get alerts on:
Alert on MACD Cycle Shift
Bullish MACD Signal
Bearish MACD Signal
Possible Regular Divergence
Possible Regular Bullish Divergence
Possible Regular Bearish Divergence
This indicator is meant to be used by professional traders.
If you would like to subscribe , please send me a private message.

Rainbow OscillatorRainbow Oscillator script.
This indicator was developed and described by Dr. Mel Widner (Stocks & Commodities V.15:7: Rainbow Charts).
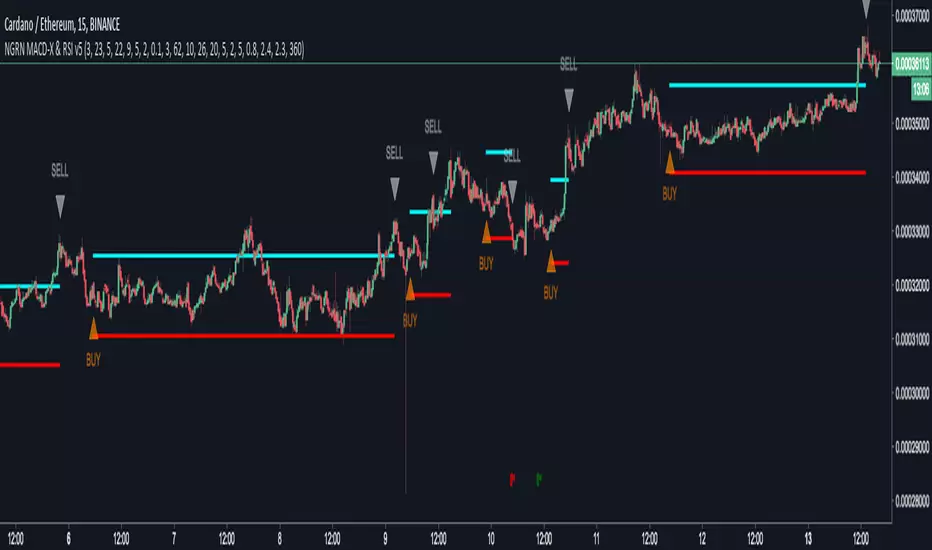
NGRN MACD-X & RSI v5MACD-X, RSI & Volume Indicator & Alerts Study - Version 5
Overview
This study and it's associated strategy were modeled after the famous Philakone described algorithms on his now defunct instructional video series.
This indicator allows for full customisation of parameters and interaction between three indicators that allow users to shape their trading methods to their desired goals.
This associated strategy also allows users to backtest the study alerts script and find the best settings towards that end.
MACD + RSI + VOLUME - are of the most powerful and widely usded indicators, MACD/Histogram crosses, coupled with RSI & Volume increases/decreases will detects areas of deeply oversold / overbought and buys/sells on the reversal
Features
Full customisation - All parameters are open for customising to allow the trader to build their own strategy and adapt from market to market.
Clean/Simple UI - Facilitating ease of use.
Enable Buying OR Selling, - or have them both active at the same time.
Toggle off and on ALTERNATING Buy and Sell feature (pyramiding) - to allow for consecutive DCA style buys or SCALING out of an entry (partial sell).
Customizable Stop-Loss plot - to enable users to create a STOP-LOSS alert option or other alert(s) based on the plot location. See settings screenshot.
Toggle Auto Stop-Loss sell option - to enable users choose whether or not to automatically issue a sell signal when close crosses stop loss plot, or choose to toggle off if not profitable.
Customizable Take-Profit plot - to enable users to create a TAKE-PROFIT alert option or other alert(s) based on the plot location.
Study and associated Strategy - to use the TradingView ‘Strategy Tester’ back-testing features to find the best alert settings for specific coins in bear, bull and sideways markets.
Changes Version 5
Added STOP-LOSS time-out period where users may specify a duration of trading pause time after a stop-loss has been triggered. A value of zero disables the feature. Time out start is indicated by a red flag icon and resumption is indicated with a green flag.
Settings
SCREENSHOT LINKS:
BUY SETTINGS: prntscr.com
SELL SETTINGS: prntscr.com
Access
For a 4 DAYS TRAIL, sign up as an Explorer subscriber @ Patreon page: www.patreon.com
Full Access is 0.25 ETH , one time fee for LIFETIME access to the STUDY indicator, STRATEGY and future updates as well as support and SETTINGS for various markets on the Binance Exchange.
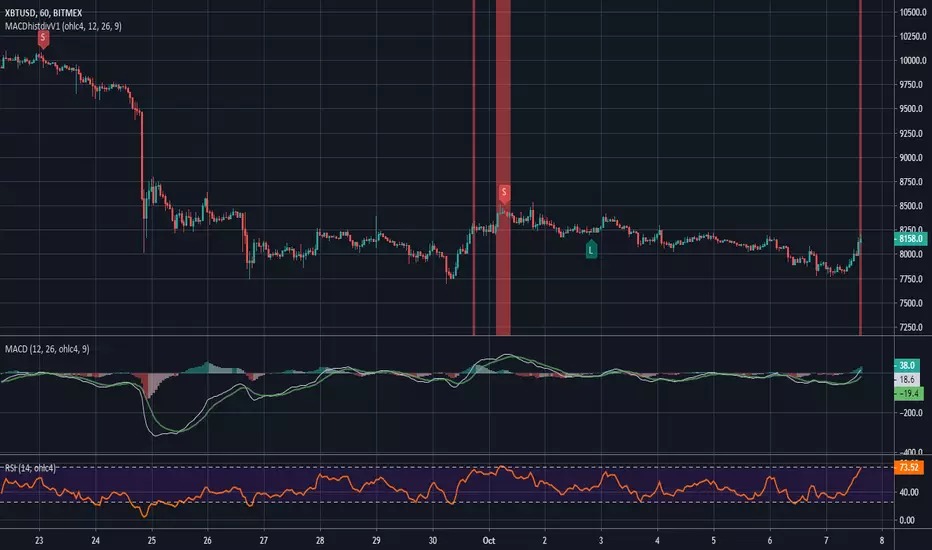
Moving Average Convergence/Divergence LineMACD Line instead of MACD histogram or area. This gives more opportunities to catch divergences.
I showed regular MACD Histogram on top and then this indicator on bottom and showed with the red and green lines where you could catch multiple bearish and bullish divergences using this indicator vs a regular MACD histogram.
Send me a private message to join my trading group.
Thank you.
