Auto Harmonic Pattern - Screener [Trendoscope]At Trendoscope, we take pride in offering a wide range of indicators on Harmonic Patterns, including both free and premium options. While we have successfully developed various advanced tools, we recognize that creating a Harmonic Pattern screener is an audacious endeavor that few have ventured into.
Creating a harmonic pattern screener presents a formidable challenge. The intricate nature of the algorithm, coupled with the limitations of cloud-based processing and platform memory, makes it exceedingly difficult to implement the screener functionality without encountering runtime errors.
Today marks a historic achievement as we overcome numerous challenges to unveil our groundbreaking harmonic pattern-based screener. This significant leap signifies our commitment to innovation in the field.
Without further delay, let's dive right into the new Auto Harmonic Pattern - Screener algorithm
🎲 Features Overview
🎯 Primary Functionality
We prefer not to categorize this as a traditional indicator, as it goes beyond that scope. Instead, it's a unique amalgamation of both a screener and an indicator, designed to achieve primarily two essential functions.
Firstly, it efficiently scans multiple tickers, up to 20, for harmonic pattern formations and presents them on a user-friendly dashboard
Secondly, it provides harmonic pattern drawings on the chart, but only if the current chart ticker is part of the screener and exhibits a harmonic pattern formation.
🎯 Secondary Features
In addition to its primary functionalities, our revolutionary algorithm offers an array of secondary features that cater to traders' diverse needs
Users have the privilege of accessing enhanced settings, providing limitless customization options for the zigzag and pattern detection algorithm
The platform empowers traders to effortlessly customize stop entry target ratios, facilitating automatic calculations and display of suggestions
The freedom to personalize the visualization and display of patterns and dashboard ensures a seamless and intuitive user experience
And finally, the algorithm leaves no stone unturned, keeping traders well-informed through timely alerts on every bar, highlighting tickers exhibiting Harmonic Pattern formations.
🎯 Limitations
Our innovative screener harnesses the power of the recursive zigzag algorithm to deliver efficient and accurate harmonic pattern detections. While the deep search algorithm, present in our other Harmonic Pattern algorithms, offers unparalleled precision, its resource-intensive nature makes it unsuitable for simultaneous scanning of 20 tickers. By focusing on the recursive zigzag approach, we strike the perfect balance between performance and functionality, ensuring seamless scanning across multiple tickers without compromising on accuracy. This strategic decision allows us to deliver a powerful and reliable screener that meets the diverse needs of traders and empowers them with real-time harmonic pattern insights.
🎲 Chart Components
Upon loading the indicator and configuring your tickers, our user-friendly interface offers two key components seamlessly integrated into the chart:
A color-coded screener dashboard : The dashboard presents a clear visualization of tickers with bullish and bearish harmonic patterns. This intuitive display allows you to quickly identify potential trading opportunities based on pattern formations.
Dynamic pattern display : As you interact with the chart, our algorithm dynamically highlights possible harmonic patterns based on the latest zigzag pivots. Please note that patterns may not always be visible on the chart, especially in cases where higher-level zigzags take time to form pivots. However, rest assured that our sophisticated algorithm ensures real-time updates, providing you with accurate and timely harmonic pattern insights.
🎯 Screener Dashboard
In our screener dashboard, you will find a wealth of information at your fingertips:
Bullish patterns : Tickers exhibiting bullish harmonic patterns are prominently highlighted with a refreshing green background
Bearish patterns : Similarly, tickers featuring bearish harmonic patterns stand out with a striking red background
Dual patterns : Tickers displaying both bullish and bearish patterns are cleverly highlighted in a captivating purple background, providing a comprehensive view of the harmonic pattern landscape.
Tickers without current patterns : Tickers lacking any current patterns are elegantly displayed with a silver background. These tickers do not trigger tooltips, streamlining your focus on actionable pattern-related data.
🎲 Settings in Detail
🎯 Tickers
Our platform currently allows users to select up to 20 tickers for the harmonic pattern screener. We understand the importance of flexibility and scalability, and while we are excited to accommodate more tickers in the future, our present focus is to ensure optimal performance within the CPU and memory limitations. Rest assured, we are continuously working on enhancing our capabilities to provide you with an even more comprehensive experience. Stay tuned for updates as we strive to meet your evolving needs.
🎯 Zigzag and Harmonic Pattern
In this section, we present a range of essential settings that play a pivotal role in the calculation of the zigzag and the scanning of patterns. These parameters share similarities with other premium indicators associated with Harmonic patterns. These settings serve as building blocks for our advanced algorithms' suite.
This include
Zigzag length and depth settings for calculation of the multi level recursive zigzag
Pattern scanning settings to filter patterns based on preferences of category, pattern name, accuracy of calculation, and other considerations.
User preference of pattern trading ratios that are used for calculating entry, stop and target prices.
🎯 Screener Dashboard and Alerts
In this section, we introduce the parameters that define the format and content of alerts and the screener dashboard, offering you maximum flexibility in customizing their display. These settings encompass the following key aspects:
Screener dashboard position, layout and size that influence the display of screener dashboard.
List of parameters that can be shown on dashboard tooltips as well as on alerts.
Format of alert and tooltip data
🎯 Pattern Display
These are the settings related to pattern display on the chart and to limit calculation to last n bars
Will soon make video tutorials on this soon.
Harmonicscanner

DEMO - FxCanli Harmonic SniperEN - TradingView FxCanli HARMONIC SNIPER indicator can draw 9 different patterns on your charts and also give alerts when any pattern triggered, hit Stop and TP levels.
DEMO VERSION of Harmonic Sniper works on only GBPNZD and XRPUSDT charts
TR - TradingView FxCanlı HARMONIC SNIPER İndikatörü , grafiklerinizde 9 ayrı formasyonu çizer ve Formasyon aktif olduğunda ve Hedef / Stop seviyelerine ulaştığında alarm verir.
Harmonic Sniper DEMO VERSİYONU sadece GBPNZD ve XRPUSDT grafiklerinde çalışır
PATTERNS / FORMASYONLAR
* Gartley
* Bat
* Butterfly
* Crab
* Cypher
* AB=CD
* Libra
* PRJ
* 2618
FEATURES & EXAMPLES / ÖZELLİKLER & ÖRNEKLER
**************************************************************
Multi Language / Çok Dil
EN - You can get alerts in English or Turkish language
TR - Alarmları İngilizce veya Türkçe olarak alabilirsiniz.
Wave Type / Dalga Tipi
EN - You can choose the wave types, Small or Medium or Small+Medium
TR- Dalga tipini seçebilirsiniz. Small veya Medium veya Small+Medium
Pattern Number / Formasyon Sayısı
EN - As a default it shows one Bullish and one Bearish pattern , you can set it 2 or more and also you may just want it to show just Bullish or Bearish Patterns
TR - Varsayılan olarak bir Boğa ve bir Ayı formasyonu gösterir, 2 veya daha fazla olarak da ayarlayabilirsiniz ve ayrıca sadece Boğa veya Ayı Formasyonu göstermesini isteyebilirsiniz.
Pattern and Trade Levels Settings / Formasyon ve İşlem Seviyeleri Ayarları
EN - You can set size, color, line type of any trade levels. Also you can choose to show the name and price of the patterns and trade levels.
TR - Herhangi bir işlem seviyesinin boyutunu, rengini, çizgi türünü belirleyebilirsiniz. Ayrıca Formasyonların ve işlem seviyelerinin adını ve fiyatını göstermeyi seçebilirsiniz.
Backtest / Geriye Dönük Test
EN - You can make backtest of any pattern
TR - Herhangi bir formasyonun geriye dönük testini yapabilirsiniz
Gartley Pattern/Formasyonu
Bat Pattern/Formasyonu
Butterfly Pattern/Formasyonu
Cypher Pattern/Formasyonu
Crab Pattern/Formasyonu
AB=CD Pattern/Formasyonu
PRJ Pattern/Formasyonu
2618 Pattern/Formasyonu
Libra Pattern/Formasyonu

FxCanli Harmonic SniperEN - TradingView FxCanli HARMONIC SNIPER indicator can draw 9 different patterns on your charts and also give alerts when any pattern triggered, hit Stop and TP levels.
TR - TradingView FxCanlı HARMONIC SNIPER İndikatörü , grafiklerinizde 9 ayrı formasyonu çizer ve Formasyon aktif olduğunda ve Hedef / Stop seviyelerine ulaştığında alarm verir.
PATTERNS / FORMASYONLAR
* Gartley
* Bat
* Butterfly
* Crab
* Cypher
* AB=CD
* Libra
* PRJ
* 2618
FEATURES & EXAMPLES / ÖZELLİKLER & ÖRNEKLER
**************************************************************
Multi Language / Çok Dil
EN - You can get alerts in English or Turkish language
TR - Alarmları İngilizce veya Türkçe olarak alabilirsiniz.
Wave Type / Dalga Tipi
EN - You can choose the wave types, Small or Medium or Small+Medium
TR- Dalga tipini seçebilirsiniz. Small veya Medium veya Small+Medium
Pattern Number / Formasyon Sayısı
EN - As a default it shows one Bullish and one Bearish pattern, you can set it 2 or more and also you may just want it to show just Bullish or Bearish Patterns
TR - Varsayılan olarak bir Boğa ve bir Ayı formasyonu gösterir, 2 veya daha fazla olarak da ayarlayabilirsiniz ve ayrıca sadece Boğa veya Ayı Formasyonu göstermesini isteyebilirsiniz.
Pattern and Trade Levels Settings / Formasyon ve İşlem Seviyeleri Ayarları
EN - You can set size, color, line type of any trade levels. Also you can choose to show the name and price of the patterns and trade levels.
TR - Herhangi bir işlem seviyesinin boyutunu, rengini, çizgi türünü belirleyebilirsiniz. Ayrıca Formasyonların ve işlem seviyelerinin adını ve fiyatını göstermeyi seçebilirsiniz.
Backtest / Geriye Dönük Test
EN - You can make backtest of any pattern
TR - Herhangi bir formasyonun geriye dönük testini yapabilirsiniz

Auto Harmonic Pattern Projections (MTF)Hello traders, I am excited to introduce to you the Auto Harmonic Pattern Projections indicator!
How does it work?
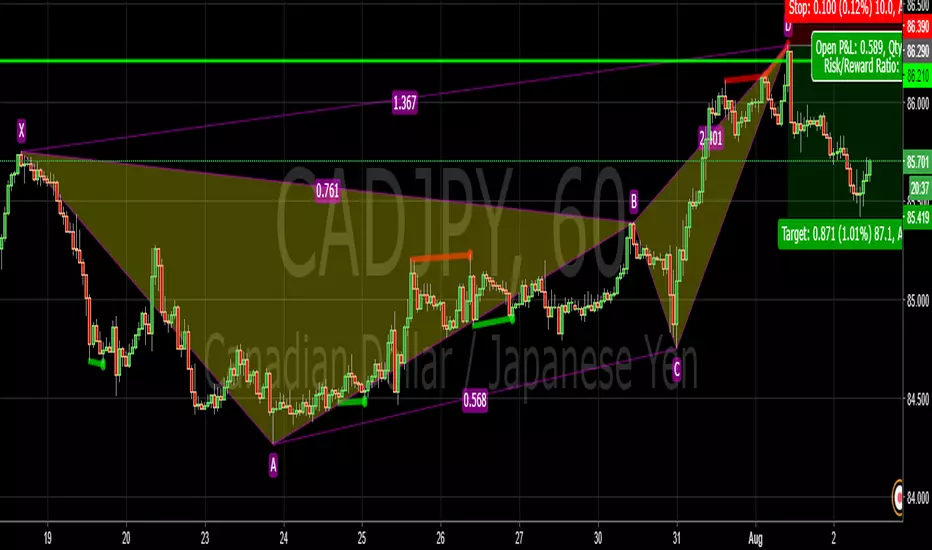
This indicator identifies harmonic patterns by analyzing Zigzag pivot points on the chart and checking if the XABC points form the required Fibonacci retracements/extensions for each particular pattern type.
If the values are within their acceptable ranges after the C point is formed, then the indicator automatically projects the D point which is based on the required XA retracement/extension of that pattern and verifies it is also within the acceptable BC projection range.
Features:
Automatically identifies and draws potential harmonic patterns in real time as soon as price breaks the B point of the pattern.
- This early projection of a harmonic pattern gives you more time to analyze the chart before the price reaches the pattern’s completion point (D), to help you determine the probability of that pattern succeeding or failing.
Multi-time frame (MTF) functionality lets you modify the Zigzag time frame to display patterns across multiple time frames without needing to change the chart time frame.
Alerts can be added for each type of pattern which will trigger upon price breaking the B point.
Individually select which types of harmonic patterns you would like displayed on the chart.
Customizable options for each pattern (see below)
List of supported harmonic patterns:
Bat Pattern
Alt Bat Pattern
Crab Pattern
Deep Crab Pattern
Butterfly Pattern
Gartley Pattern
Shark Pattern
More will be added in the future! Check for updates below
Pattern options:
Manually change the allowable ranges for each leg of the pattern, with tooltips for each pattern that provides users with the rules and criteria.
Adjust stop loss level for each pattern.
Change the color of the pattern’s lines, fills, and labels.
Display the BC Projection level which is automatically determined based on the Fibonacci extension closest to the projected D point.
Display the AB=CD level, 1.272AB=CD Extension, and/or 1.618 AB=CD Extension.
Display the Stop Loss Level and Take Profit Levels
Example of a Butterfly Harmonic found, with the 1.272AB=CD level enabled
Preview of the indicator’s settings:
How to Set Up Alerts
Select which patterns you would like to receive alerts on, by checking them off in indicator settings.
Once you have made selections, click OK then save your chart.
Right click on a harmonic pattern on the chart or click the ellipsis (3 dots) next to indicator name at top of chart then click “Add alert on MTF Auto Harmonic Pattern Projection”
You may remove the default Alert Name if you’d like, as the alert message is already built in which informs user of the type of pattern found on a particular symbol.
If you change any settings after alert has been created, you will have to remove the existing alert then re-add it following the steps above.
To gain access to this indicator, please send me a direct message for details
Harmonic Patterns ProHello All,
We need to make things better & better to solve the puzzle and I try to do my best on this way for the community. now I am here with my Harmonic Patterns Pro script.
Harmonic Pattern recognition is the basic and primary ability any trader develops in technical analysis. Harmonic pattern recognition takes extensive practice and repetitive exposure. in general chart patterns are categorized into “continuous” and “reversal” patterns. Harmonic patterns construct geometric pattern structures using Fibonacci sequences. These harmonic structures identified as specified harmonic patterns provide unique opportunities for traders, such as potential price movements and key turning or trend reversal points. This script is developed to find following patterns by using the options you set. I have to say that this is not a strategy and you should not use this script blindly, instead, I strongly recommend you to create your own strategy using this script with other tools/indicators, such moving averages, Support/Resistance levels, volume indicators, sentiment indicators etc.
- Following Harmonic Patterns are available in this version:
-->Gartley
-->Butterfly
-->Bat
-->Crab
-->Shark
-->Cypher
-->Alternate Bat
-->Deep Crab
-->5-0
-->3-Drive
-->AB=CD
-->Descending Triangle
-->Ascending Triangle
-->Symmetrical Triangle
-->Double Top
-->Double Bottom
How the script works and finds harmonic patterns:
- It uses zigzag like other harmonic pattern script but there is a difference. this scripts searches up to 200 bars, finds/creates up to 200 XABCD using zigzag waves and searches predefined harmonic patterns
- It can find multiple harmonic patterns on a candles with different sizes and lengths
- Each pattern is shown using its own color (you can set 8 different colors)
- it shows Entry, Target1, Target2 and Stop-loss levels for each found Patterns
- It shows pattern validation zones for each found pattern
- it has all-in-one alerts. you set the alerts you want in the indicator options and you create only 1 alert for each symbol.
- it has prediction future and it can show many predicted patterns at the same time, each predicted patterns validations zones are shown separately
- While on real-time bar it searches and shows patterns for the visible area
it has followng alerts: . these in all-in-one alerts. it means that you choose the alerts in the options and enables any of them and then create only one for each symbol. and you get eany alert you choose. (" Any alert() function call "). in this version "Any alert() function call" alert is only alert you can use, if I get some requests I can try to other alerts as well.
New Pattern Found
Pattern Updated
Entered Position
Reached Target
Stop-loss
Validation zone is calculated using XABC points any pattern by using Y-Axis error rate. so if you increase Y-Axis error rate then the script can find much more Harmonic patterns.
X-Axis Error Rate is used for a few pattern such AB=CD for the distance of AB wave and CD wave.
The script can show Recommended Entry, Target 1, Target 2 and stop-loss levels for each active patterns. of course you can use these levels or you can set your own levels. you can see the screenshot below.
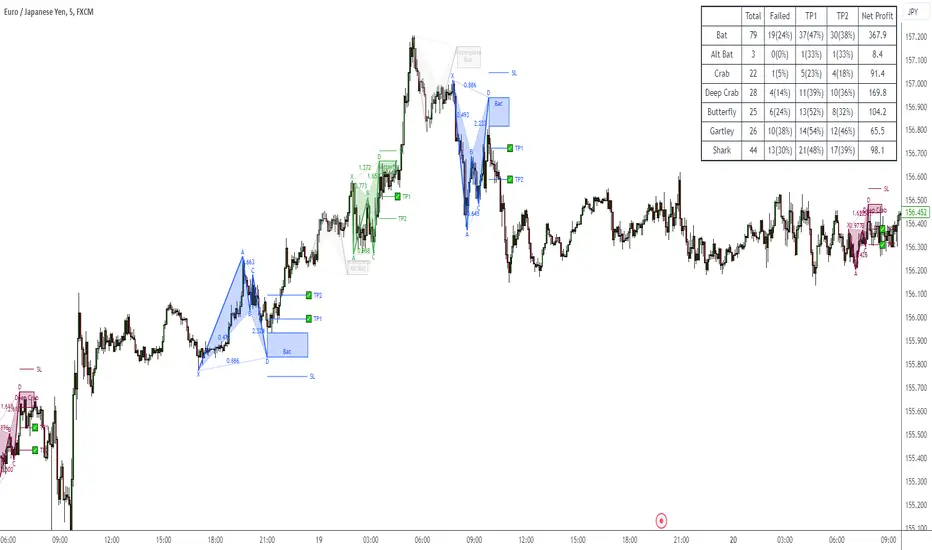
The script can show statistics panel. when statistic panel is enabled then no pattern is shown on the chart, the script shows ONLY statistics panel. This was done because of complexity of the script.
If you enables Prediction then pattern checks all possible XABC formations in the last 200 bars and finds/shows predicted patterns if there is any.
if you "replaying" then the script searches patterns only for last bar (if any update on zigzag on last bar), not for historical ones. you should take care while you use "Replay" feature of Tradingview
Now lets see the options:
Minimum ZigZag Period: this is minimum Zigzag Period to create new Zigzag wave. default value is 10 and minimum value is 4
Y-Axis Error Rate %: this is the error rate to create validation zones for each pattern, there is almost no perfect pattern, so we try to create a zone using error rate
X-Axis Error Rate % : this is used for a few pattern (such AB=CD) to check wave lengths on time basis
Minimum Pattern Length: This is Minimum Length for the Patterns to be searched. in Number of Bars
Maximum Pattern Length : This is Maximum Lengths for the Patterns to be searched. in Number of Bars
Max Number of XABCD to search: Maximum Number of ABCD to search pattern on each move, there are many possible XABCDs on the chart, this limitation is the number for how many of them will be searched
Find Patterns for: is the option about taking position. there are three options: "Long and Short", "Only Long", "Only Short"
Max Patterns on Each Bar: Maximum Number of Patterns that can be found on each bar, by default it's 3
Keep Pattern Until: you have two option "Target1" and "Target2". when a pattern found and if it reach any of these targets it is accepted as it's reached target and removed. this is also used inthe statictics panel!
Show Recommended Entries & Targets: if enabled then the script can show "Recommended" Entry, target1, target2 and stop-loss leves. you can use these levels or you can use your own calculation for each pattern
Entry = % of Target 2 : Entry Level for each pattern is calculated using the distance between D positon of the pattern and target 2. by default it's 16%, you can set it as you wish
Entry&Target Line Style: you can set line style for entry/target/stop-loss levels
Show Pattern Validation Zones: as explained above, for each pattern validation zone is created using error rate (Y-axis error rate). you can see it for each pattern
Source for Invalidation: this source is used for validation zones. there is two options: Close or High/Low. this source is used while invalidated the pattern. by default it used "close" price as source
Line Style: this is line style for validation zones, solid, dashed or dotted
Pattern Prediction/Possible Patterns: if you enable this option then the script calculates/searches possbile patterns and shows their levels in a label if there is one or more
Show Label & Zone: this is about how you want to see predictions, there are two choices: "Show Only Label", "Show Label & Zone"
Show Statistics Panel : if you enable this option then the script starts searching all harmonic patterns from the first bar for the last bar and keeps statistics for all of them and the shows in a table. you can see screenshot below
Panel Position: you can set panel location of statistics panel using this option
Show Rates Between Waves: if you enable this option then rate between the waves are shown. by default it's enabled
Keep Last Pattern on the Chart : if you enable this option then even if pattern is invalidated/reach target/stop-loss it stays on the chart until new pattern is found. by default it's enabled
Line Style : line style for the last pattern on the chart
Patterns to Search: you have options to enable/disable the patterns listed above to find&show, you can enable/disable any pattern in the list. by default all patterns are enabled except AB=CD pattern
in the ALERTS menu you have many options to enable/disable the alerts you want. Alerts contain Symbol name, Pattern name, Direction as Long/Short, Recommended Entry, Targets, SL levels.
- New Pattern Found
- Pattern Updated
- Entered Position
- Reached Target
- Stop-loss
Show Zig Zag: if you want to see Zig Zag then you should enable this option, and you can set the colors for the Zig zag. by default it's disabled.
and some other options for coloring and line styles of the patterns..
This is how XABCD points found using zigzag waves, I tried to explain it in the video below:
Validation zones and Entry, Target1, Target2 and Stop-loss levels:
Each pattern has its own color, you can see which levels, letters, lines etc belongs to which pattern:
Pattern prediction: you can enable it and change its background color:
How Statistics panel looks like. if there is active pattern then it's shown in different color in the table
This screenshot shows how the script finds and shows multiple patterns on a candle:
And some examples for triangles and Double top/bottom patterns:
Symmetrical triangle:
Ascending triangle:
Double bottom
and many others..
While using different time frames the script can find same patterns, in the following screenshots you can see how same patterns found on 5 and 10 min chart. of course this depends on the Zigzag Period
in this video, the idea and the indicator options is explained:
I can say that this is very complex script and it takes very long time to develop. I used my all programming ability and Pine ability to develop it. I hope you like it and make a lot of profit.
DISCLAIMER: No sharing, copying, reselling, modifying, or any other forms of use are authorized for the documents, script / strategy, and the information published with them. This informational planning script / strategy is strictly for individual use and educational purposes only. This is not financial or investment advice. Investments are always made at your own risk and are based on your personal judgement. I am not responsible for any losses you may incur. Please invest wisely.
Enjoy!

Harmonic PatternsHello Traders,
This is Harmonic Pattern script . I made this script long time ago and now pubished it for the community. it can find & show following patterns:
- Gartley
- Butterfly
- Bat
- Alternate Bat
- Crab
- Deep Crab
- Shark
- Cypher
- Double Top
- Double Bottom
- ABCD
only ABCD patterns is not enabled by default, you can enable if you want.
The script has many features in it, so you have many options. lets see them
ZigZag Period : is the period for zig zag that is used to find harmonic patterns.
Error Rate % : the patterns may not be perfect and we need to use a threshold. with this option you can set error rate
Deep Search: if you enable this option then the script check combination with old zigzag points. an example is under the explanation part
Pattern Prediction : if you set this option then while price is moving the script checks the possible next patterns that can be possible (shows first possible one). an example is under the explanation part
Show ZigZag: you have option to see zigzag
Show Pattern Names: you have option to see Pattern names
Remove Old Pattern Names : old found patterns can stay on the chart or you have option to delete from the chart by this option
Show Harmonics: you have option to show patterns
Show Targets: you have option to see the target and stop-loss level by each harmonic
Show Statistics: you can see the statictics about harmonic patterns on current chart
Show Full Statistics: you can see the statictics about harmonic patterns on current chart in details
"Stop-loss ATR Len" and "Stop-loss ATR Mult" is used to calculate stop-loss levels
and many options for visualization and alerts...
The scripts works dynamically in real time, it means it may find different patterns on each candles. if it finds a new one in same direction then old one becomes invalid, you should check the last one.
Lets see some examples:
it changes the colors if price reached the target or stop-loss. blue => reached target, black => stop-loss, and if color was not changed it means it found another harmonic pattern.
if it finds a harmonic pattern then it show entrty level, cancelation level of the pattern, target 1 and target 2
and if price reaches entrty level then it shows targets and stop-loss levels
as written above, t has ability to predict patterns if you enable this option:
Deep search is used to find patterns by some old zigzag levels as seen in following screenshot:
it can show full statistics if you enable it in the options:
The source code is hidden but it's free script. so like it/favorite this script, apply it to your chart and start using it ;)
Special thanks to my friend @gornidah who helped while developing the script!
Enjoy!

Ultimate Pattern ScannerThis is a automatic scanner for well know patterns like Head and Shoulder to get started. I'm planning to add more patterns in the near future. It works as follows:
1. Is going to plot the pattern on the chart, lines in blue
2. Is going to show you the long entry or short entry bar, red or green triangles
3. It is possible to get an alert when there is a potential long or short entry depending on the pattern
For example: is going to give a possible entry when the price has broken the trend line of the two shoulders if we take the Head and Shoulder pattern as an example.
Please let me know in the comments if you would like to have more patterns.
======================================================
I have planned the release of a pro version with all the well know patterns for invite only users. Patterns like:
- All the harmonic patterns
- Triangles
- Elliot Waves impulses
- Double Top and Bottom
- Triple top and bottom
- Rising and Falling Wedge
- The cup and the handle, etc
- ABCD pattern
Let me know in the comments if you would be interested in something like this please. I'll appreciate your feedback.
thanks!
XABCD ScannerXABCD Scanner for TradingView
These bullish and bearish 5-point patterns are based on various Fibonacci retracement levels and signify potential reversal zones (PRZ).
As they become 80% complete, the dashed-line pattern will appear, displaying the PRZ and giving you time to prepare for a reversal.
Different combinations of specific fib retracements and extensions result in different patterns, and each is named for identification.
Bullish patterns signify a potential turn to the upside are colored green.
Bearish patterns signify a potential turn to the downside are colored red.
9 popular patterns are currently recognized.
XABCDs can be applied to all markets: crypto, forex, commodities, indices, etc.
For access, please visit the link in our Signature below, or shoot us a PM.

SIMPLE DIVERGENCESimple Divergence Indicator built specifically for the Quick-Fire Strategy, but can be used to compliment any strategy and/or timeframe. Please learn what divergence is and how to chart on your own before using. Thank you.