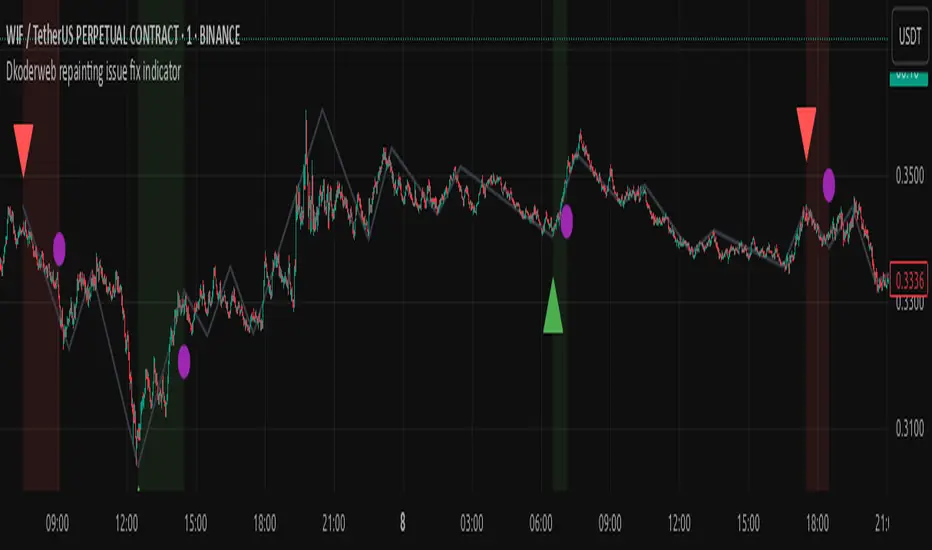
Dkoderweb repainting issue fix indicator# Harmonic Pattern Trading Indicator for TradingView
This indicator, called "Dkoderweb repainting issue fix indicator," is designed to identify and trade harmonic chart patterns in financial markets. It uses Fibonacci relationships between price points to detect various patterns like Bat, Butterfly, Gartley, Crab, Shark, and others.
## Key Features:
- **Pattern Recognition**: Automatically identifies over a dozen harmonic patterns including standard and anti-patterns
- **Customizable Settings**: Options to use Heikin Ashi candles and alternate timeframes
- **Fibonacci Levels**: Configurable display of key Fibonacci retracement levels
- **Entry and Exit Signals**: Clear buy/sell signals with visual triangles above/below bars
- **Trade Management**: Automatic take-profit and stop-loss levels based on Fibonacci relationships
- **Visual Aids**: Color-coded backgrounds to highlight active trade zones
- **Alert System**: Customizable alert messages for trade entries and exits
## How It Works:
The indicator uses a zigzag function to identify significant price pivots, then analyzes the relationships between these pivots to detect specific harmonic patterns. When a valid pattern forms and price reaches the entry zone (defined by a Fibonacci level), the indicator generates a trade signal.
Each pattern has specific Fibonacci ratio requirements between its points, and the indicator continuously scans for these relationships. Trade management is handled automatically with predefined take-profit and stop-loss levels.
This version specifically addresses repainting issues that are common in pattern-detection indicators, making it more reliable for both backtesting and live trading.
Patrones armónicos
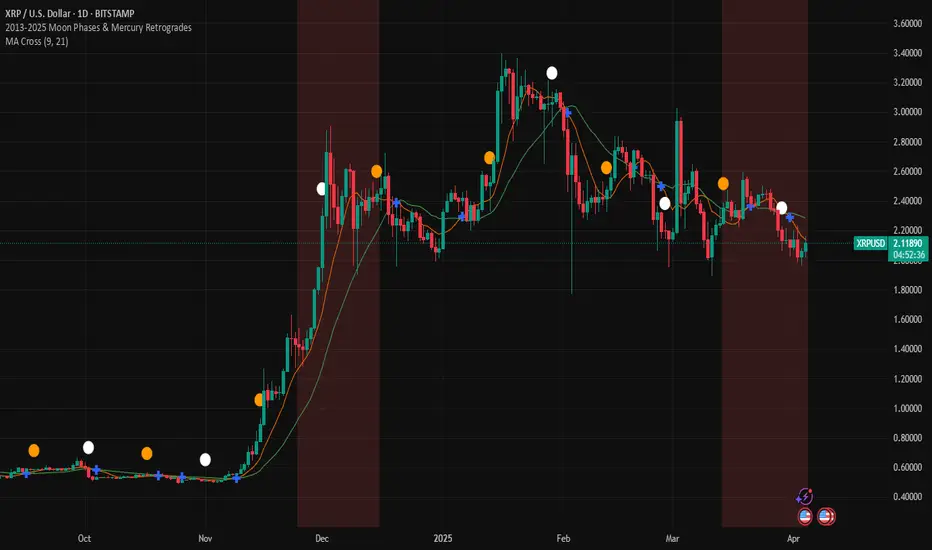
2013-2025 Moon Phases & Mercury RetrogradesIndicator Description: 2013-2025 Moon Phases & Mercury Retrogrades
This Pine Script (version 5) indicator overlays key astrological events on a TradingView chart, specifically tracking full moons, new moons, and Mercury retrograde periods from 2013 to 2025. It is designed to help traders and astrology enthusiasts visualize these celestial events alongside price action, potentially identifying correlations or patterns.
Features:
New Moons:
Visualization: Plotted as small white circles above the price bars.
Data: Includes 156 specific new moon dates from January 11, 2013, to December 20, 2025.
Purpose: Marks the start of the lunar cycle, often associated with new beginnings or shifts in energy.
Full Moons:
Visualization: Plotted as small orange circles above the price bars.
Data: Includes 157 specific full moon dates from January 27, 2013, to December 15, 2025.
Purpose: Highlights the peak of the lunar cycle, often linked to heightened emotions or market volatility in astrological analysis.
Mercury Retrogrades:
Visualization: Displayed as a light red background highlight across the chart.
Data: Covers 39 Mercury retrograde periods, with precise start and end timestamps from February 23, 2013, to November 29, 2025.
Purpose: Indicates periods traditionally associated with communication issues, delays, or reversals, which some traders monitor for potential market impacts.
Technical Details:
Overlay: The indicator is set to overlay=true, meaning it displays directly on the price chart rather than in a separate pane.
Date Matching: Uses a helper function is_date(y, m, d) to check if the current chart date matches any of the predefined event dates, leveraging TradingView's year, month, and dayofmonth variables.
Visualization Methods:
plotshape: Used for new moons (white circles) and full moons (orange circles), positioned above bars for clear visibility.
bgcolor: Used for Mercury retrograde periods, applying a semi-transparent red highlight (transparency level 85) to the background during active retrograde periods.
Time Range: Spans from January 2013 to December 2025, providing a comprehensive 13-year view of these astrological events.
Usage:
Add the script to your TradingView chart to see new moons, full moons, and Mercury retrograde periods overlaid on your chosen symbol and timeframe.
The white and orange circles appear on specific dates, while the red background highlights extend across the duration of each Mercury retrograde period.
Useful for traders incorporating astrology into their analysis or anyone interested in tracking these celestial events alongside financial data.
Notes:
The script assumes accurate date data as provided; users should verify dates against astronomical sources if precision is critical.
The transparency of the Mercury retrograde background can be adjusted by modifying the value in color.new(color.red, 85) (0 = fully opaque, 100 = fully transparent).
Best viewed on daily or higher timeframes for clarity, though it works on any timeframe supported by TradingView.
This indicator provides a visual tool to explore the potential influence of lunar phases and Mercury retrograde periods on market behavior, blending astrology with technical analysis in a clear, customizable format.
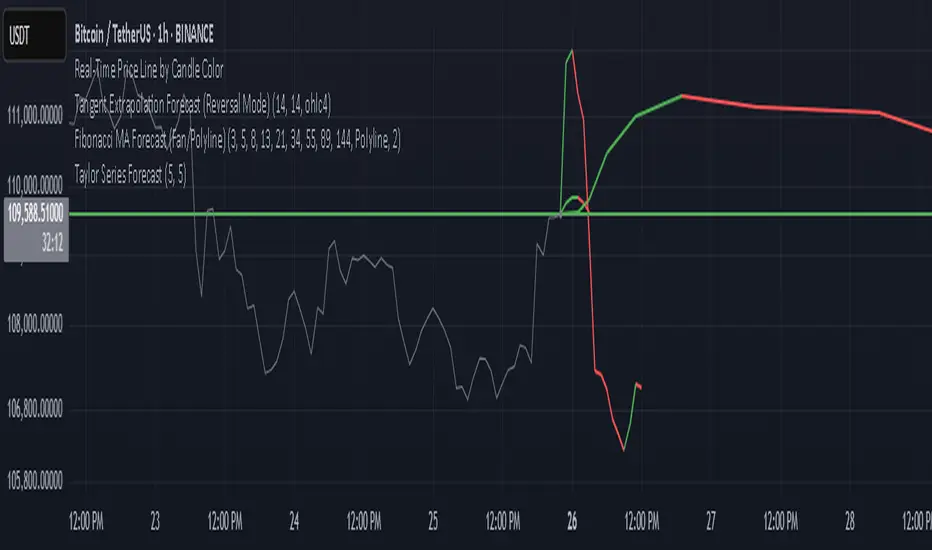
Fibonacci Forecast IndicatorThis indicator projects potential price movements into the future based on user-defined Fibonacci-period moving averages. By default, it calculates Simple Moving Averages (SMAs) for the 3, 5, 8, 13, and 21 bars (though you can customize these values). For each SMA, it measures the distance between the current closing price and that SMA, then extends the price forward by the same distance.
Key Features
1. Fibonacci MAs:
- Uses Fibonacci numbers (3, 5, 8, 13, 21) for SMA calculations by default.
- Fully customizable periods to fit different trading styles.
2. Forecast Projection:
- If the current price is above a given SMA, the forecast line extends higher (bullish bias).
- If the current price is below the SMA, the forecast line extends lower (bearish bias).
- Forecast lines are anchored at the current bar and project forward according to the same Fibonacci intervals.
3. Clean Visualization:
- Draws a series of connected line segments from the current bar’s close to each forecast point.
- This approach offers a clear, at-a-glance visual of potential future price paths.
How to Use
1. Add to Chart:
- Simply apply the indicator to any chart and timeframe.
- Adjust the Fibonacci periods and styling under the indicator settings.
2. Interpretation:
- Each forecast line shows where price could potentially head if the current momentum (distance from the SMA) continues.
- When multiple lines are consistently above (or below) the current price, it may reinforce a bullish (or bearish) outlook.
3. Customization:
- You can modify the number of forecast lines, their color, and line width in the inputs.
- Change or add your own Fibonacci periods to experiment with different intervals.
Notes and Best Practices
- Confirmation Tool: This indicator is best used alongside other forms of technical or fundamental analysis. It provides a “what-if” scenario based on current momentum, not a guaranteed prediction.
- Not Financial Advice: Past performance doesn’t guarantee future results. Always practice proper risk management and consider multiple indicators or market factors before making trading decisions.
Give it a try, and see if these Fibonacci-based projections help visualize where price may be headed in your trading strategy!
[iQ]PRO Master iQWave SystemWelcome to the PRO Master iQWave System, an exclusive, ndicator crafted for TradingView. This cutting-edge tool harnesses sophisticated mathematical models to deliver precise buy and sell signals, empowering traders with a comprehensive view of market dynamics.
Key Features
Advanced Analytical Framework: Seamlessly integrates state-of-the-art techniques in signal processing, statistical analysis, and market profiling to uncover high-probability trading opportunities.
Holistic Market Insight: Combines proprietary methods for data transformation, frequency-based cycle detection, adaptive trend and seasonality extraction, and moment-driven anomaly identification—offering a multi-dimensional approach to price analysis.
Customizable Precision: With a wide range of user inputs, traders can tailor the system to their unique strategies and adapt it to diverse market conditions, ensuring flexibility across asset classes and timeframes.
Intuitive Visual Feedback: Displays critical insights directly on your chart, including adaptive fits, statistical boundaries, market profile levels, and a clear, actionable signal label—making complex analysis accessible at a glance.
Why Choose PRO Master iQWave System?
Designed for experienced traders, this indicator stands out by blending advanced analytics with practical usability. Whether you're identifying reversals, filtering noise, or gauging market structure, the PRO Master iQWave System equips you with a robust, all-in-one solution. Its proprietary algorithms distill intricate market data into actionable signals, helping you stay ahead of the curve.
Elevate Your Trading
Experience the power of next-level technical analysis. The PRO Master iQWave System is more than an indicator—it's a strategic edge, reserved for those ready to unlock its potential. Take your trading to new heights with this exclusive tool, available only by invitation.
ADvM, of MMiQ

HTF Anchored FanSimilar to an Anchored VWAP, this lets you click a bar on an Daily, Weekly, or Monthly chart to add an "Anchored Fan" which displays lines at up to 6 levels above and below the chosen Anchor Point. Useful to measure the retracement during swing moves.
You can reposition the fan by either hovering over the anchor or by clicking the name of the study to "activate" it, and then dragging. You can also change the Anchor Point in Settings.
By default the anchor uses the bar Close, but you can change this manually in settings OR you can use the fancy "Auto high/low" mode which is handy if you are mainly dropping the fan on local swing highs and lows.
The default line measures were chosen for ES (Futures) but the study should be usable with nearly anything as long as you adjust the settings to something appropriate for the ticker. If you want to use this on NQ, for example, it would be reasonable to multiple each of these settings by 3.5 or so.
NOTE: If the fan is way off the left side of the chart it's generally easiest to use Settings to move it back to close to "now".

NoSweep CandlesNoSweep Candles – Identify Candles Without Liquidity Sweeps
The NoSweep Candles indicator highlights candles that do not break the high or low of the previous candle. This helps traders easily spot areas of consolidation, potential reversals, or moments of market indecision.
Key Features:
✅ White candle coloring when neither the high nor low of the previous candle is breached.
✅ Keeps default colors for other candles, maintaining a clean chart.
✅ Perfect for Smart Money Concept (SMC) traders, helping identify liquidity stability.
✅ No unnecessary signals or distractions, just pure price action analysis.
Use NoSweep Candles to refine your trading strategy and better understand market structure! 🚀
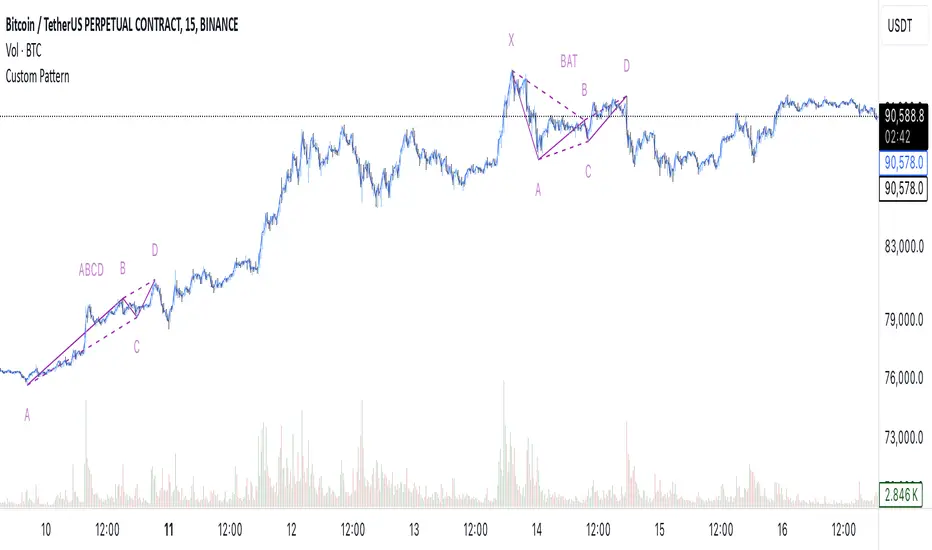
Waves and Harmonic Patterns by BULL┃NETThe B | N WAHA (Waves and Harmonic Patterns by BULL | NET)
indicator provides traders using CFD brokers with the most significant price and time events from the stock exchange of the underlying original index or security. For example traders are able to easily identify the price at the Daily Open and Close time of up to three additional stock exchanges. Traders can choose from a huge list of options including the values from the current and previous Day, Week, Month and Year. In addition traders can enable the display of the Expected Move by either implied or historical volatility. The indicator can show Open Gaps (gap between close and open of two trading sessions) also which traders would usually see only on the original chart of an index or security.
The B | N WAHA indicator can help traders to make better entry decisions based on the real market sessions.
█ ⚠️ DISCLAIMER – READ BEFORE YOU USE ⚠️
█ FEATURES
— PATTERN OPTIONS
● Deviation for ratio calculation
Any pattern has a unique set of ratios for different retracements. In a perfect world each ratio would be hit exactly. But the stock market is far from perfect and especially in volatile markets ratios have to be adjusted. The default is 5%. The maximum is 10%
● (Name of pattern)
The list of patters recognized will grow with new versions of the indicator. The settings for each pattern are the same.
Each available pattern will be recognized and drawn by default. If you disable the checkbox in front of the pattern name the indicator will ignore this pattern completely no matter if another checkbox for this pattern is active.
● Developing
As soon as a new possible pattern is recognized, the indicator will draw a label at the starting point (0, A or X) of the pattern. For the indicator “possible” means there is only the last point missing, which is D in case of ABCD and XABCD patterns. Once the last point has reached the completion price range, the indicator will draw the pattern. If you enable this checkbox the indicator will draw a zickzack line between the already existing points.
● Projection
If there is a new possible pattern the indicator will draw a projection box to indicate the price range where the final point has to be located for completion of the pattern. Don’t confuse this with a buy or sell signal! The appearance of the box doesn’t tell anything about the chance of a pattern to get completed. It simply tells you that the price has to reach the box and to retrace within the box to form a valid pattern. This allows you to prepare a strategy if the price hits the box. If you disable the checkbox no box will be drawn.
● History
For backtesting or learning purpose you can display all historical occurrences of a pattern. Best practice is to disable all other patterns and enable the history checkbox only together with the checkbox of the patten name.
— PIVOPOINT OPTIONS
To identify patterns you need pivot points. True high and lows in the chart. If you use B | N GABO or B | N DESC you already know about this concept. The indicator is using three different levels of pivot points in parallel for better detection of patterns.
● Level 1
This is the fast running pivot level. You can choose from 2 to 4. Default is 3.
● Level 2
This is the pivot level with medium pace. Selectable levels are 5 to 9. Default is 5.
● Level 3
This is the slow running pivot level. The minimum level is 10, the maximum is 20. The default is 15.
● Pivotpoints
By default pivot points are not displayed on the chart because this ads a lot of noise. For backtesting and learning purposes you can enable this option.
● Label
● Text
● Size
This three settings define the appearance of the pivot points.
— HARMONIC PATTERN OPTIONS
The settings in this section control how the zickzack line of a pattern gets drawn on the chart. The settings for bullish and bearish pattern are identical.
● Show bullish/bearish pattern
By default both types of patterns are drawn on the chart. For backtesting or learning purpose you can disable it.
● Line
The color of the zickzack lines.
● ABC
The line style to connect points A, B and C.
● CD
The line style to connect points C and D.
● (Line Width)
The width of lines ABC and CD.
● Label
The color of the label for a completed pattern. This label marks starting point.
● Developing
The color of the label while a pattern is developing.
● Text
The color of the text in the label.
● (Text size)
The size of the text.
— HARMONIC PATTERN LABEL OPTIONS
The label which marks the start of a pattern can contain multiple information. To reduce noise on the chart you can disable each information separately. If you disable them all, the label will display the designation of the pattern starting point, e.g. “A” for an ABCD or “X” for an XABCD.
● Title
The title identifies the type of pattern. E.g. a possibly developing ABCD pattern will display ABC at the beginning to denote the point A, B and C have been detected. If this pattern completes the title would change to ABCD in case of a standard ABCD pattern or to AB=CD if the pattern matches all criteria needed for this ‘perfect’ type of ABCD.
● Number
Each pattern carries a unique number needed to identify the projection and targets in case there are multiple patterns in parallel.
● Ratio
First this is the retracement level of point C from point B toward point A. It is the decimal value of the percentage. In a perfect world this would be 0.618 (61.8%). In volatile markets this can be as low as 0.382 and as high as 0.786. If Ratio is enabled BD ratio will get displayed as well once point D is about to complete a ABCD pattern.
● Tooltip
Enabled by default the tooltip shows all the information and more if you hover the mouse pointer over the label.
● Perfect
If the pattern is formed “perfect” it will change its color to denote a possibly strong trend reversal. E.g. a perfect AB=CD is formed if the time and price difference between A and B is equal to the time and price difference between C and D. The calculation contains a 5% deviation to reflect usual market conditions.
— PROJECTION OPTIONS
If the “Projection” checkbox of a pattern is enabled (See PATTERN OPTIONS) the indicator will display the price range where the final point must sit to form a valid pattern. You can customize the box that marks this price range or disable it at all.
● Bull / Bear
The color of the box border.
● (Style)
The line style of the box border.
● Background
The background color of the box.
● Text
The color of the text in the box.
● (Text size)
The size of the text.
— PROJECTION DESCRIPTION OPTIONS
The box which marks the possible landing zone for pattern completion can contain multiple information. To reduce noise on the chart you can disable each information separately.
● Price Range
To complete a pattern successfully point D needs to be located within the minimum and maximum price of the range. For bullish pattern the price range is increasing (e.g. 100 – 120) and for bearish pattern it is decreasing (e.g. 100 – 80).
● Title
The title identifies the type of pattern. E.g. a possibly developing ABCD pattern will display ABC at the beginning to denote the point A, B and C have been detected. If this pattern completes the title would change to ABCD in case of a standard ABCD pattern or to AB=CD if the pattern matches all criteria needed for this ‘perfect’ type of ABCD.
● Number
Each pattern carries a unique number needed to identify the projection and targets in case there are multiple patterns in parallel.
— TARGET OPTIONS
● Display ABCD Targets
Once a pattern is completed the indicator will display multiple price lines for targets or other important price levels. This is enabled by default.
The cosmetic setting are separated for bullish and bearish pattern targets. However they are identical.
● Bull / Bear Line
The color of the target lines.
● (Line style)
The style of the target lines.
● Label
The color of the label which contains information about the target.
● Text
The color of the text in the label.
● (Text size)
The size of the text.
— TARGET LABEL OPTIONS
The target label can contain multiple information. To reduce noise on the chart you can disable each information separately. If you disable all information a blank label will be displayed necessary to hold the tooltip.
● Price
The target price.
● Number
The unique number of the pattern.
● Title
The target identifier.
● Direction
New traders often get confused with bullish and bearish pattern. A small arrow facing down or up will tell them the expected price move to reach the targets.
● Tooltip
If enabled the tooltip shows all the information and more if you hover the mouse pointer over the label.
● Remove if hit
By default target lines and labels will get removed one bar after the price has hit the target. If you disable this option target lines will stay together with the pattern until it gets invalidated.
— DISPLAY OPTIONS
● 2 Decimals
To streamline the appearance of prices they are set to display two decimals only. Numbers get rounded! However, trading currency pairs or crypto assets might need to display the full amount of decimals. In this case simply disable the setting “2 Decimals”.
— ALERT OPTIONS
Bevor you can use alerts in TradingView you have to activate them.
1. Click on the alert button
2. From the first drop down in conditions select B | N WAHA
3. From the third drop down (the one below the first one) select Any alert() function call
4. Skip the expiration if you want the alerts to be active for ever
5. Give The Alert a name or keep the default
6. Click on create
You have to repeat this procedure in every timeframe you use. This is not a limitation of the indicator. This is how TradingView alerts work.
Now you can select the events in the alert options of B | N WAHA you want to get noticed about. Alerts get fired when a bar gets confirmed which is the last close of a bar.
-------------------------------------------------------
Disclaimer BullNet: The information provided in this document is for educational and informational purposes only and does not constitute financial, investment, or trading advice. Any use of the content is at your own risk. No liability is assumed for any losses or damages resulting from reliance on this information. Trading financial instruments involves significant risks, including the potential loss of all invested capital. There is no guarantee of profits or specific outcomes. Please conduct your own research and consult a professional financial advisor if needed.
Disclaimer TradingView: According to the www.tradingview.com
Copyright: 2025-BULLNET - All rights reserved.
Roadmap:
Version 1.0 03.03.2025

AlgoCados x Gann Toolkit AnalysisAlgoCados x Gann Toolkit Analysis
The "AlgoCados x Gann Toolkit Analysis" is an advanced TradingView indicator combining the principles of W.D. Gann’s methodologies with the power of custom anchor points and time cycles. Tailored for traders seeking precision in market timing and price-level analysis, this toolkit integrates the Anchored Square of 9, customizable Gann Fans, and Time cycles. It offers unparalleled flexibility, allowing users to apply Gann’s techniques across different market assets and timeframes by squaring the chart, providing insights into support, resistance, and potential trend reversals.
CME_MINI:NQH2025
# Core Functionalities
# Gann’s Square of 9 Price Projections
This indicator applies Gann’s Square of 9 principles, allowing traders to anchor price projections at significant highs, lows, opens, or closes. By following the Gann Wheel methodology, it calculates critical support and resistance levels through angular shifts, providing accurate projections based on the chosen anchor point. Traders can adjust the anchor to align with various market conditions, refining their analysis according to their preferred starting price.
# Gann’s Cycles Time Projection
Incorporating Gann’s natural cycles of 144 and 360, this indicator utilizes bar index logic to project time cycles, best suited for unit-based timeframes (e.g., 1 minute, 1 hour, 1 day). These time projections are plotted dynamically, adapting in real time to new data and offering a structured view of Gann’s cyclical approach to market timing.
# Customizable Gann Fans
The toolkit includes a flexible Gann Fan module that lets traders scale ratios around a user-defined “1x1” ratio, making it adaptable across different assets and timeframes. With seven standard fan lines (1x1, 2x1, 4x1, 8x1, 1x2, 1x4, 1x8), each line is drawn dynamically based on the selected anchor point, providing insights into price action direction and potential support/resistance zones. These fans can be positioned for both bullish and bearish setups.
# Square of 4 Projections
By dividing Gann’s 360° cycles into four 90° segments, the indicator generates additional projections for more granular analysis. These divisions highlight key support/resistance levels, allowing traders to observe market responses at each 90° increment and identify potential reversal points. By default users will view larger cycles, up to 5760°, to capture significant long-term trends.
# Dynamic Labeling and Visualization
The indicator features customizable line styles (solid, dotted, dashed) and labeling options (Levels, Prices, Levels + Prices). This flexibility allows traders to create clear, structured chart visuals that reflect their analytical needs. Dynamic labels display degrees and prices for each projection, helping traders understand price movements at a glance.
CME_MINI:NQH2025
# Mathematical Foundation and Indicator Logic
# Anchor Point Calculation
The selected anchor (High, Low, Open, or Close) serves as the baseline for Gann calculations, determining all subsequent projections. Users can control the anchor time and adjust for offsets to optimize alignment with key market events.
# Angular Shifts and Square Root Scaling
Projections are calculated by applying angular shifts to the square root of the anchor price, with the toolkit generating both positive and negative deviations. This method reveals potential price levels by mapping out a series of support and resistance points based on Gann’s cyclic philosophy.
# Time Cycle Analysis_ 144 & 360 Cycles
Utilizing the bar index logic, the indicator plots time projections aligned with Gann’s 144 and 360 cycles, which apply best to unit-based timeframes like 1 minute, 1 hour, 1 day, etc. Time cycles are labeled and extended dynamically, ensuring the chart reflects real-time market shifts as new bars are added.
# Key Features and Customization Options
# Adjustable Angular Shifts and Cycles
Angular shifts from 360° to 5760° are available, offering detail from intraday to long-term trends. The Square of 4 cycles enhance analysis by dividing the 360° Gann Wheel into four equal parts, revealing critical resistance/support points within each cycle.
# Fully Customizable Projection Lines
Projection lines are customizable by style (solid, dotted, dashed) and color, ensuring a clear distinction between equilibrium, support, and resistance levels. The toolkit also includes separate settings for upper and lower deviations, allowing traders to focus on specific market directions.
# Flexible Input Settings for Time and Price
Users can set anchor points, time cycles, line styles, and labels with precision, tailoring the indicator to any asset, timeframe, or market condition.
# Dynamic Labeling and Offsets
Each projection line displays dynamic labels that show angular shifts and associated prices, enhancing readability and ease of analysis. Labels can be offset to avoid chart clutter, creating a clean and user-friendly chart.
CME_MINI:NQH2025
# Recommended Usage
# Time Cycles for Key Market Events
Anchor points should align with major highs or lows to reflect accurate time cycles. The toolkit’s flexibility in time cycle selection (1x1, 144, or 360 cycles) ensures precision in market timing analysis. Ideal for unit-based timeframes such as 1 minute, 1 hour, 1 day, 1 week, or 1 month.
# Price Levels with Gann Fans
Set anchor points on significant highs or lows to apply the Gann Fan tool effectively, projecting key price levels across multiple timeframes; the default fan is set on 1x1 (one price unit for one time unit), the ratio can be manually changed based on the chart specifics.
# Square of 4 Analysis
Dividing Gann Wheels into 90° segments allows traders to identify critical support and resistance levels within each 360° cycle. This feature is ideal for pinpointing intraday reversals or aligning with long-term trend cycles.
# Technical Overview
Indicator Name : AlgoCados x Gann Toolkit Analysis
Platform Compatibility : TradingView
Version : Pine Script v6
License: Mozilla Public License 2.0
Author : AlgoCados, © 2025
Overlay : True (overlays directly on price chart)
Core Functions : Anchored Square of 9, Customizable Gann Fans, and Time-Cycles projections
Customizable Settings : Anchor time/point, Angular shifts, Time cycles, Fan ratios, Label styles
Maximize Gann Analysis Precision with AlgoCados; Healthy with Your Trading!

ChaosPulse Fractal Dimension IndicatorOverview:
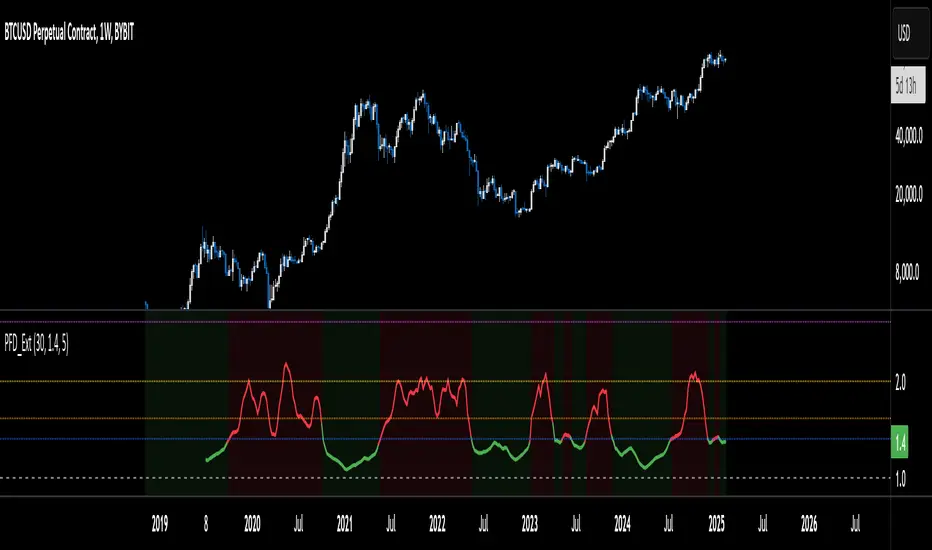
The ChaosPulse Fractal Dimension Indicator is designed to measure the "complexity" or "chaos" of price movements over time. By calculating the fractal dimension of the price series, the indicator provides insights into whether the market is trending smoothly or exhibiting turbulent, potentially unpredictable behavior.
How It Works:
Fractal Dimension Calculation:
The indicator uses a fixed lookback window (default: 30 bars) to compute the fractal dimension. It does this by:
Summing the absolute differences between consecutive closing prices (the “path length”) within the window.
Measuring the direct distance between the current closing price and the closing price at the beginning of the window.
Calculating the fractal dimension using the formula:
FD
=
1
+
ln
(
sumDistances
/
𝑑
)
ln
(
window
−
1
)
FD=1+
ln(window−1)
ln(sumDistances/d)
This produces a value that indicates the degree of complexity in the price path.
Smoothing:
To filter out noise, the computed fractal dimension is smoothed using a simple moving average (SMA) over a configurable number of bars (default: 5).
Visual Cues:
The primary plot displays the smoothed fractal dimension. Its color changes based on whether the value is above or below a set threshold (default: 1.4), which is commonly interpreted as the point where market behavior transitions from smooth (closer to 1) to increasingly chaotic (approaching 2).
The indicator also draws several horizontal reference lines at key levels:
0.618
1.4 (default chaos threshold)
1.618 (the Golden Ratio)
2.0
2.618
These levels provide additional visual context. For instance, values near 1.618 might hint at a natural balance point, while higher values (closer to 2 or 2.618) suggest significant market turbulence.
The background color shifts (green for lower complexity, red for higher complexity) based on whether the smoothed fractal dimension exceeds the default threshold.
Interpreting the Values:
Fractal Dimension ≈ 1:
Indicates a smooth, nearly linear price movement—a trending or stable market.
Fractal Dimension Around 1.4:
Often used as a threshold, this level may signal the beginning of increased price complexity. When the indicator rises above 1.4, it might warn that the market is entering a more volatile, “chaotic” phase.
Fractal Dimension Near 1.618, 2.0, or 2.618:
These higher values suggest a significantly more complex, turbulent market. Such conditions could precede sharp price movements, reversals, or breakouts.
Fractal Dimension Around 0.618:
Represents extremely low complexity—suggesting a very calm market, potentially with little opportunity for dramatic changes.
Usage:
The ChaosPulse Fractal Dimension Indicator is not a standalone forecasting tool but rather a means to assess the “texture” of market movements. Traders can use it alongside other technical indicators to:
Identify periods of stability versus high volatility.
Gain additional insight into potential trend changes.
Adjust risk management strategies when the market enters a phase of increased complexity.
This description should help users understand both the theory behind the indicator and its practical application. The additional horizontal lines provide multiple reference points (including the intriguing 1.618 level, inspired by the Golden Ratio) to enhance the visual and analytical appeal of the tool.
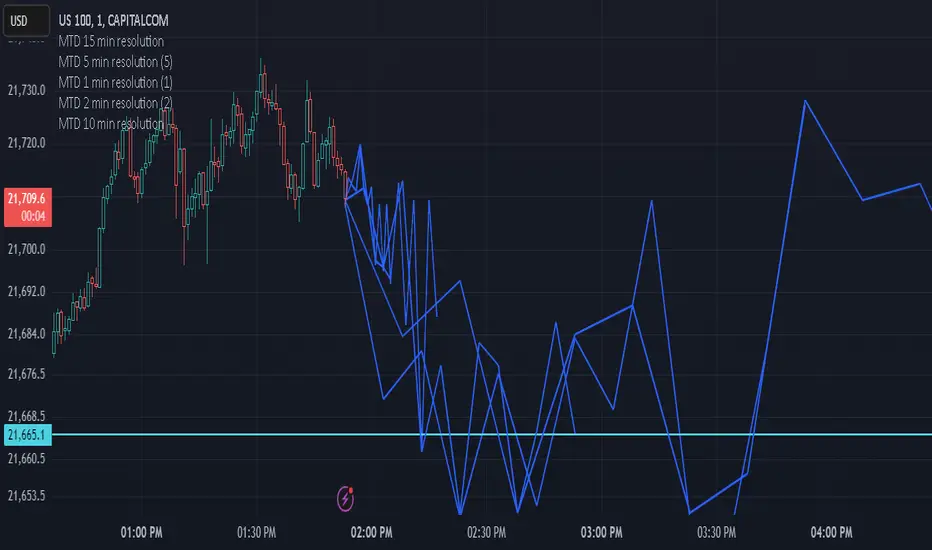
Multi-timeframe Difference Forecast (MTD)Description:
The Multi-timeframe Difference Forecast indicator projects potential future price levels by comparing open prices across multiple timeframe pairs. It uses 12 predefined timeframe pairs where each pair consists of a lower and a higher timeframe. For each pair, the indicator calculates a forecast value by adding the difference between the lower timeframe’s open and the higher timeframe’s open to the current bar’s close. These forecast values are then plotted as points into the future and connected by blue line segments, forming a continuous projection line on your chart.
How It Works:
Timeframe Pairs:
The indicator defines 12 pairs. For example:
Pair 1: Lower timeframe = 15 minutes; Higher timeframe = 150 minutes
Pair 2: Lower timeframe = 30 minutes; Higher timeframe = 165 minutes
⋮
Pair 12: Lower timeframe = 180 minutes; Higher timeframe = 720 minutes
Forecast Calculation:
For each pair, the forecast is computed as:
forecast = close + (lower timeframe open - higher timeframe open)
This produces a series of forecast values that are then plotted on the chart.
Time Offset:
Each forecast point is offset into the future by a number of bars calculated as the ratio between the lower timeframe’s duration (in seconds) and the current chart’s timeframe (in seconds). This adjustment helps align the forecast points correctly on the time axis.
Visualization:
The indicator draws blue lines (width = 2) connecting the current price to each forecast point sequentially, forming a polyline that visually represents the projected price trajectory.
How to Use:
Overlay on Chart:
Apply this indicator to any chart, and it will automatically overlay the forecast line on your current price chart.
Timeframe Flexibility:
The calculations adjust to the chart’s timeframe, so you can use it on various timeframes without needing to change the code.
Interpretation:
The forecast line is intended to provide a visual estimate of potential future price movement based on historical open price differences. It is meant to serve as an additional analytical tool rather than a standalone trading signal.
Disclaimer:
This script is provided for educational and informational purposes only and should not be construed as financial or trading advice. Trading involves significant risk, and past performance is not indicative of future results. You should perform your own analysis and consult with a qualified professional before making any trading decisions. Use this indicator at your own risk.
Dragon Harmonic Pattern [TradingFinder] Dragon Detector🔵 Introduction
The Dragon Harmonic Pattern is one of the technical analysis tools that assists traders in identifying Potential Reversal Zones (PRZ). Resembling an "M" or "W" shape, this pattern is recognized in financial markets as a method for predicting bullish and bearish trends. By leveraging precise Fibonacci ratios and measuring price movements, traders can use this pattern to forecast market trends with high accuracy.
The Dragon Harmonic Pattern is built on the XABCD structure, where each point plays a significant role in shaping and forecasting price movements. Point X marks the beginning of the trend, representing the initial price movement. Point A indicates the first retracement, usually falling within the 0.380 to 0.620 range of the XA wave.
Next, point B signals the second retracement, which lies within 0.200 to 0.400 of the AB wave. Point C, acting as the hump of the pattern, is generally located within 0.800 to 1.100 of the XA wave. Finally, point D represents the endpoint of the pattern and the Potential Reversal Zone (PRZ), where the primary price reversal occurs.
In bullish scenarios, the Dragon Pattern indicates a reversal from a downtrend to an uptrend, where prices move upward from point D. Conversely, in bearish scenarios, prices decline after reaching point D. Accurate identification of this pattern through Fibonacci ratio analysis and PRZ examination can significantly increase the success rate of trades, enabling traders to adjust their strategies based on key market levels such as 0.618 or 1.100.
Due to its high accuracy in identifying Potential Reversal Zones (PRZ) and its alignment with Fibonacci ratios, the Dragon Harmonic Pattern is considered one of the most popular tools in technical analysis. Traders can use this pattern to pinpoint entry and exit points with greater confidence while minimizing trading risks.
Bullish :
Bearish :
🔵 How to Use
The Dragon Harmonic Pattern indicator helps traders identify bullish and bearish patterns in the market, allowing them to capitalize on available trading opportunities. By analyzing Fibonacci ratios and the XABCD structure, the indicator highlights Potential Reversal Zones (PRZ).
🟣 Bullish Dragon Pattern
In the Bullish Dragon Pattern, the price transitions from a downtrend to an uptrend after reaching point D. At this stage, points X, A, B, C, and D must be carefully identified.
Fibonacci ratios for these points are as follows: Point A should fall within 0.380 to 0.620 of the XA wave, point B within 0.200 to 0.400 of the AB wave, and point C within 0.800 to 1.100 of the XA wave.
When the price reaches point D, traders should look for bullish signals such as reversal candlesticks or increased trading volume to enter a buy position. The take-profit level can be set near the previous price high or based on the 1.272 Fibonacci ratio of the XA wave, while the stop-loss should be placed slightly below point D.
🟣 Bearish Dragon Pattern
In the Bearish Dragon Pattern, the price shifts from an uptrend to a downtrend after reaching point D. In this pattern, points X, A, B, C, and D must also be identified. Fibonacci ratios for these points are as follows: Point A should fall within 0.380 to 0.620 of the XA wave, point B within 0.200 to 0.400 of the AB wave, and point C within 0.800 to 1.100 of the XA wave.
Upon reaching point D, bearish signals such as reversal candlesticks or decreasing trading volume indicate the opportunity to enter a sell position. The take-profit level can be set near the previous price low or based on the 1.272 Fibonacci ratio of the XA wave, while the stop-loss should be placed slightly above point D.
By combining the Dragon Harmonic Pattern indicator with precise Fibonacci ratio analysis, traders can identify key opportunities while minimizing risks and improving their decision-making in both bullish and bearish market conditions.
🔵 Setting
🟣 Logical Setting
ZigZag Pivot Period : You can adjust the period so that the harmonic patterns are adjusted according to the pivot period you want. This factor is the most important parameter in pattern recognition.
Show Valid Forma t: If this parameter is on "On" mode, only patterns will be displayed that they have exact format and no noise can be seen in them. If "Off" is, the patterns displayed that maybe are noisy and do not exactly correspond to the original pattern.
Show Formation Last Pivot Confirm : if Turned on, you can see this ability of patterns when their last pivot is formed. If this feature is off, it will see the patterns as soon as they are formed. The advantage of this option being clear is less formation of fielded patterns, and it is accompanied by the latest pattern seeing and a sharp reduction in reward to risk.
Period of Formation Last Pivot : Using this parameter you can determine that the last pivot is based on Pivot period.
🟣 Genaral Setting
Show : Enter "On" to display the template and "Off" to not display the template.
Color : Enter the desired color to draw the pattern in this parameter.
LineWidth : You can enter the number 1 or numbers higher than one to adjust the thickness of the drawing lines. This number must be an integer and increases with increasing thickness.
LabelSize : You can adjust the size of the labels by using the "size.auto", "size.tiny", "size.smal", "size.normal", "size.large" or "size.huge" entries.
🟣 Alert Setting
Alert : On / Off
Message Frequency : This string parameter defines the announcement frequency. Choices include: "All" (activates the alert every time the function is called), "Once Per Bar" (activates the alert only on the first call within the bar), and "Once Per Bar Close" (the alert is activated only by a call at the last script execution of the real-time bar upon closing). The default setting is "Once per Bar".
Show Alert Time by Time Zone : The date, hour, and minute you receive in alert messages can be based on any time zone you choose. For example, if you want New York time, you should enter "UTC-4". This input is set to the time zone "UTC" by default.
🔵 Conclusion
The Dragon Harmonic Pattern is an advanced and practical technical analysis tool that aids traders in accurately predicting bullish and bearish trends by identifying Potential Reversal Zones (PRZ) and utilizing Fibonacci ratios. Built on the XABCD structure, this pattern stands out for its flexibility and precision in identifying price movements, making it a valuable resource among technical analysts. One of its key advantages is its compatibility with other technical tools such as trendlines, support and resistance levels, and Fibonacci retracements.
By using the Dragon Harmonic Pattern indicator, traders can accurately determine entry and exit points for their trades. The indicator analyzes key Fibonacci ratios—0.380 to 0.620, 0.200 to 0.400, and 0.800 to 1.100—to identify critical levels such as price highs and lows, offering precise trading strategies. In bullish scenarios, traders can profit from rising prices, while in bearish scenarios, they can capitalize on price declines.
In conclusion, the Dragon Harmonic Pattern is a highly reliable tool for identifying trading opportunities with exceptional accuracy. However, for optimal results, it is recommended to combine this pattern with other analytical tools and thoroughly assess market conditions. By utilizing this indicator, traders can reduce their trading risks while achieving higher profitability and confidence in their trading strategies.

Nen Star Harmonic Pattern [TradingFinder] NenStar Reversal Auto🔵 Introduction
The Nen-Star Harmonic Pattern is an advanced reversal pattern in technical analysis, designed to identify market trend changes and predict key price reversal points. This pattern is defined by a combination of Fibonacci ratios and critical concepts such as Potential Reversal Zones (PRZ), market structure, and corrective waves.
The key points of this pattern include X, A, B, C, and D, and it appears in both bullish and bearish forms. In its bullish form, the pattern resembles the letter M, while in its bearish form, it takes the shape of W. The critical Fibonacci ratios for this pattern are 0.382 to 0.786 for the XA wave, 1.13 to 1.414 for the AB wave, and 1.272 to 2.618 for the BC wave.
The Nen-Star Harmonic Pattern is one of the most precise tools for identifying market reversals and executing reversal trades. Traders can use it to pinpoint optimal entry and exit points and benefit from high risk-to-reward ratios.
By emphasizing Fibonacci retracement levels, XABCD waves, the formation of bullish and bearish patterns, and precise trade entry points, this pattern has become a practical tool in advanced technical analysis.
Bullish Nen-Star Pattern :
Bearish Nen-Star Pattern :
🔵 How to Use
The Nen-Star Harmonic Pattern indicator allows traders to automatically identify the bullish and bearish structures of this pattern and locate optimal entry and exit points. By accurately analyzing Fibonacci ratios and determining points X, A, B, C, and D, the indicator highlights Potential Reversal Zones (PRZ) on the chart. Traders can rely on the generated signals to manage their trades with greater precision.
🟣 Bullish Nen-Star Pattern
The bullish Nen-Star pattern begins with a price increase from point X to point A, followed by a retracement to point B, which lies between 0.382 and 0.786 of the XA wave.
After this retracement, the price moves to point C, located between 1.13 and 1.414 of the AB wave. The final movement is a price decline to point D, which is between 1.272 and 2.618 of the BC wave and 1.13 to 1.272 of the XA wave.
Point D : Serves as the key Potential Reversal Zone (PRZ).
Entry : A buy trade is initiated at point D, signaling the end of the corrective movement and the beginning of a price increase.
Price Targets :
61.8% retracement of the CD wave
Point A
Point C
1.272 and 1.618 extensions of the CD wave if resistance at point C is broken
Stop Loss : Placed slightly below point D.
🟣 Bearish Nen-Star Pattern
The bearish Nen-Star pattern starts with a price decrease from point X to point A, followed by a retracement to point B, which lies between 0.382 and 0.786 of the XA wave.
After this retracement, the price moves to point C, located between 1.13 and 1.414 of the AB wave. The final movement is a price increase to point D, which is between 1.272 and 2.618 of the BC wave and 1.13 to 1.272 of the XA wave.
Point D : Serves as the key Potential Reversal Zone (PRZ).
Entry : A sell trade is initiated at point D, signaling the end of the corrective movement and the beginning of a price decline.
Price Targets :
61.8% retracement of the CD wave
Point A
Point C
1.272 and 1.618 extensions of the CD wave if support at point C is broken
Stop Loss : Placed slightly above point D.
🔵 Setting
🟣 Logical Setting
ZigZag Pivot Period : You can adjust the period so that the harmonic patterns are adjusted according to the pivot period you want. This factor is the most important parameter in pattern recognition.
Show Valid Forma t: If this parameter is on "On" mode, only patterns will be displayed that they have exact format and no noise can be seen in them. If "Off" is, the patterns displayed that maybe are noisy and do not exactly correspond to the original pattern.
Show Formation Last Pivot Confirm : if Turned on, you can see this ability of patterns when their last pivot is formed. If this feature is off, it will see the patterns as soon as they are formed. The advantage of this option being clear is less formation of fielded patterns, and it is accompanied by the latest pattern seeing and a sharp reduction in reward to risk.
Period of Formation Last Pivot : Using this parameter you can determine that the last pivot is based on Pivot period.
🟣 Genaral Setting
Show : Enter "On" to display the template and "Off" to not display the template.
Color : Enter the desired color to draw the pattern in this parameter.
LineWidth : You can enter the number 1 or numbers higher than one to adjust the thickness of the drawing lines. This number must be an integer and increases with increasing thickness.
LabelSize : You can adjust the size of the labels by using the "size.auto", "size.tiny", "size.smal", "size.normal", "size.large" or "size.huge" entries.
🟣 Alert Setting
Alert : On / Off
Message Frequency : This string parameter defines the announcement frequency. Choices include: "All" (activates the alert every time the function is called), "Once Per Bar" (activates the alert only on the first call within the bar), and "Once Per Bar Close" (the alert is activated only by a call at the last script execution of the real-time bar upon closing). The default setting is "Once per Bar".
Show Alert Time by Time Zone : The date, hour, and minute you receive in alert messages can be based on any time zone you choose. For example, if you want New York time, you should enter "UTC-4". This input is set to the time zone "UTC" by default.
🔵 Conclusion
The Nen-Star Harmonic Pattern is a highly effective analytical tool in global financial markets, playing a crucial role in identifying reversal points and market trend changes. By leveraging Fibonacci principles and price structure, this pattern enables precise analysis across various assets, including stocks, cryptocurrencies, forex, and commodities.
Traders operating in global markets can use this pattern to identify high risk-to-reward trading opportunities. Its clear entry and exit points, defined Potential Reversal Zones (PRZ), and accurate price targets make it an excellent tool for risk management and profitability enhancement.
In the global context, the Nen-Star pattern is widely used by professional analysts in both advanced and emerging markets due to its versatility in analyzing long-term and short-term charts. Beyond trend prediction, it enhances trading strategies and optimizes investment decisions.
Combining this pattern with complementary tools such as volume analysis, technical indicators, and macroeconomic conditions can provide traders with deeper market insights, helping them capitalize on global opportunities.

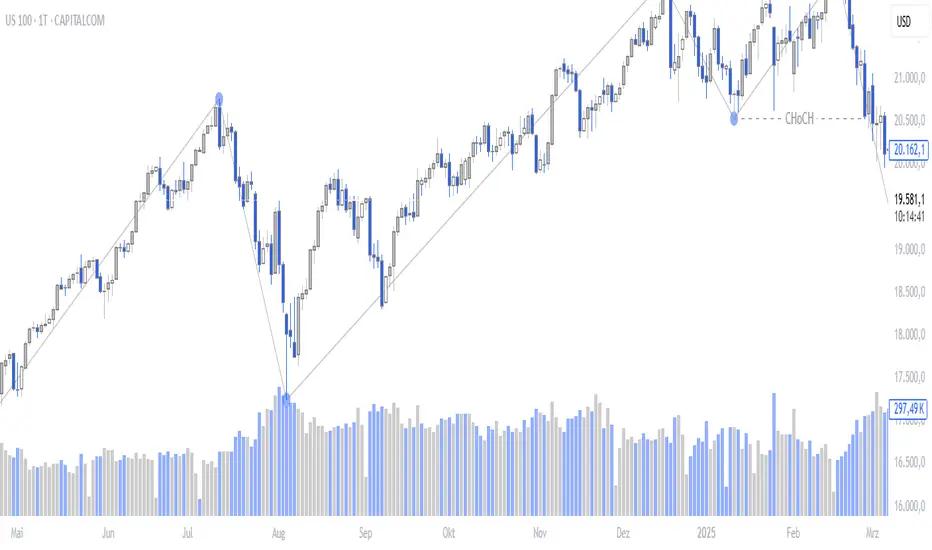
Smart Money Breakouts [iskess 01-02 11:05]This is an big update to the excellent Smart Money Breakout Script published in Oct 2023 by ChartPrime who, to my knowledge, was the original author.
FULL CREDIT GOES TO CHARTPRIME FOR THIS ORIGINAL WORK.
Per the moderator's rules, you will find below a meaningful, detailed self-contained description that does not rely on delegation to the open source code or links to other content. You will find in the description details on what the script does, how it does that, how to use it, and how it is original.
The "Smart Money Breakouts" indicator is designed to identify breakouts based on changes in character (CHOCH) or breaks of structure (BOS) patterns, facilitating automated trading with user-defined Take Profit (TP) level.
The indicator incorporates essential elements such as volume analysis and a data table to assist traders in optimizing their strategies.
🔸Breakout Detection:
The indicator scans price movements for "Change in Character" (CHOCH) and "Break of Structure" (BOS) patterns, signaling potential breakout opportunities in the market.
🔸User-Defined TP/SL :
Traders can customize the Take Profit (TP) and Stop Loss (SL) through the indicator settings, with these levels dynamically calculated based on the Average True Range (ATR). This allows for precise risk management and profit targets that adapt to market volatility. Traders can also select the lookback period for the TP/SL calculations.
🔸Volume Analysis and Trade Direction Specific Analysis:
The indicator includes a volume checker that provides valuable insights into the strength of the breakout, taking into account trade direction.
🔸If the volume label is red and the trade is long, it suggests a higher likelihood of hitting the Stop Loss (SL).
🔸If the volume label is green and the trade is long, it indicates a higher probability of hitting the Take Profit (TP).
🔸For short trades, a red volume label suggests a higher likelihood of hitting TP, while a green label suggests a higher likelihood of hitting SL.
🔸A yellow volume label suggests that the volume is inconclusive, neither favoring bullish nor bearish movements.
🔸Data Table:
The indicator features a data table that keeps track of the number of winning and losing trades for specific timeframes or configurations. It also shows the percentage of profits vs losses, and the overall profit/loss for the selected lookback period.
This table serves as a valuable tool for traders to analyze performance and discover optimal settings and timeframes.
The "Smart Money Breakouts" indicator provides traders with a comprehensive solution for breakout trading, combining technical analysis of changes in character and breaks of structure, volume insights, and performance tracking while dynamically adjusting TP and SL levels based on market volatility through the ATR.
This version of the script is a "significant improvement" from Chart Prime's original work in the following ways:
- A selectable range of candles for the profit/loss calculations to look back on.
- An updated table that includes the percentage of wins/losses, and and overall P&L during the selected lookback range.
- The user can now select only Long trades, Short trades, or both.
- The percentage gain/loss is now indicated for every trade on the chart.
- The user can now select a different multiplier for Stop Loss or Take Profit thresholds.

Support and Resistance Non-Repainting [AlgoAlpha]Elevate your technical analysis with the Non-Repainting Support and Resistance indicator from AlgoAlpha. Designed for traders who value precision, this tool highlights key support and resistance zones without repainting, ensuring reliable signals for better market decisions.
Key Features
🔍 Concise Zones: Identifies critical levels in real-time without repainting.
🖍 Customizable Appearance: Choose your preferred colors for bullish and bearish zones.
📏 Pivot Sensitivity Settings: Adjust the lookback period to fit different market conditions.
🔔 Visual Alerts: Highlights zones on your chart with clear, dynamic boxes and lines.
How to Use
Add the Indicator : Add it to your favorites chart by clicking the star icon. Adjust the lookback period, max zone duration, and colors to match your strategy.
Analyze the Chart : Look for zones where prices frequently react, indicating strong support or resistance.
Set Alerts : Enable notifications for new zone formations and zone invalidations, ensuring you never miss critical market moves.
How It Works
The indicator detects pivot highs and lows using a specified lookback period. When a pivot is confirmed, it draws corresponding support or resistance zones using TradingView’s built-in drawing tools. These zones extend until price breaks through them or they expire based on a maximum allowed duration. The indicator continuously checks if price interacts with any active zones and adjusts accordingly, ensuring accurate and real-time visualization.

Alternate Bat Harmonic Pattern [TradingFinder] ALT Bat Indicator🔵 Introduction
The Alternate Bat harmonic pattern is one of the most precise and practical tools in technical analysis, introduced by Scott Carney in 2003. This pattern focuses on specific Fibonacci ratios, such as 0.382 at point B and 1.13XA at point D, to identify Potential Reversal Zones (PRZ) where price is likely to reverse.
The Alternative Bat pattern emerged as a result of repeated failures observed in the standard Bat pattern. Traders entering trades near the 0.886XA level of the standard Bat often encountered losses. In the Alternate Bat, point D extends beyond 0.886XA, typically reversing at 1.13XA, offering a more accurate identification of the reversal zone.
A key characteristic of this pattern is its M- or W-shaped structure, where the midpoint B retraces 0.382XA or less. Additionally, the CD leg requires an extension of 2.0 to 3.618 to complete the pattern. Due to its accuracy and the predictable behavior of price near the PRZ, the Alternate Bat pattern is recognized as a powerful tool for forecasting price reversals.
In the bullish Alternative Bat pattern, an M-shaped structure forms. After an initial upward movement (XA), price undergoes a short correction at point B (0.382XA) and then declines toward point D (1.13XA and an extension of 2.0 to 3.618BC), where a potential upward reversal is expected.
In the bearish Alternate Bat pattern, a W-shaped structure forms. After an initial downward movement (XA), price retraces slightly at point B (0.382XA) and then rises toward point D (1.13XA and an extension of 2.0 to 3.618BC), where a potential downward reversal is anticipated.
🔵 How to Use
The Alternate Bat harmonic pattern is a key tool for identifying potential reversal zones (PRZ) in the market. By leveraging the 0.382 retracement at point B and the 1.13XA extension at point D, along with symmetrical price structures, this pattern offers precise reversal opportunities in both bullish and bearish market conditions.
🟣 Bullish Alternate Bat Pattern
The bullish Alternate Bat pattern forms during a downtrend, signaling a potential reversal to the upside. This pattern consists of three downward movements with two corrective waves, ultimately reaching point D, which marks the PRZ.
At the PRZ, the convergence of Fibonacci levels—1.13XA and extensions ranging from 2.0 to 3.618BC—creates a strong support zone where price is likely to reverse upward.
🟣 Bearish Alternative Bat Pattern
The bearish Alternate Bat pattern develops during an uptrend, indicating a potential reversal to the downside. This pattern features three upward price movements with two retracements, ending at point D, where the PRZ forms.
Point D is defined by the 1.13XA extension and the 2.0 to 3.618BC projection, creating a strong resistance zone where price is expected to reverse downward.
🔵 Setting
🟣 Logical Setting
ZigZag Pivot Period : You can adjust the period so that the harmonic patterns are adjusted according to the pivot period you want. This factor is the most important parameter in pattern recognition.
Show Valid Format : If this parameter is on "On" mode, only patterns will be displayed that they have exact format and no noise can be seen in them. If "Off" is, the patterns displayed that maybe are noisy and do not exactly correspond to the original pattern.
Show Formation Last Pivot Confirm : if Turned on, you can see this ability of patterns when their last pivot is formed. If this feature is off, it will see the patterns as soon as they are formed. The advantage of this option being clear is less formation of fielded patterns, and it is accompanied by the latest pattern seeing and a sharp reduction in reward to risk.
Period of Formation Last Pivot : Using this parameter you can determine that the last pivot is based on Pivot period.
🟣 Genaral Setting
Show : Enter "On" to display the template and "Off" to not display the template.
Color : Enter the desired color to draw the pattern in this parameter.
LineWidth : You can enter the number 1 or numbers higher than one to adjust the thickness of the drawing lines. This number must be an integer and increases with increasing thickness.
LabelSize : You can adjust the size of the labels by using the "size.auto", "size.tiny", "size.smal", "size.normal", "size.large" or "size.huge" entries.
🟣 Alert Setting
Alert : On / Off
Message Frequency : This string parameter defines the announcement frequency. Choices include: "All" (activates the alert every time the function is called), "Once Per Bar" (activates the alert only on the first call within the bar), and "Once Per Bar Close" (the alert is activated only by a call at the last script execution of the real-time bar upon closing). The default setting is "Once per Bar".
Show Alert Time by Time Zone : The date, hour, and minute you receive in alert messages can be based on any time zone you choose. For example, if you want New York time, you should enter "UTC-4". This input is set to the time zone "UTC" by default.
🔵 Conclusion
The Alternate Bat harmonic pattern, with its precise Fibonacci ratios like 0.382 and 1.13XA, is a reliable tool for identifying Potential Reversal Zones (PRZ) in financial markets. By recognizing symmetrical price structures and focusing on both bullish and bearish scenarios, traders can identify optimal entry and exit points with high accuracy.
The key strength of this pattern lies in its ability to define strong support and resistance zones near the PRZ, increasing the probability of price reversals. Combining the pattern with candlestick confirmations and volume analysis enhances its effectiveness.
Ultimately, incorporating the Alternative Bat pattern with proper risk management and Fibonacci-based targets allows traders to enter the market confidently and capitalize on potential price reversals.

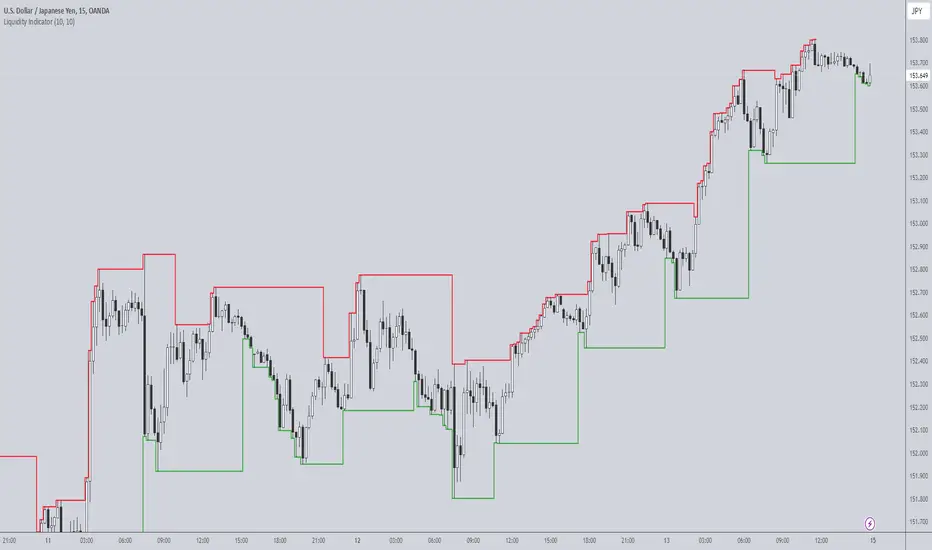
Liquidity IndicatorThe Liquidity Indicator helps identify key price levels where liquidity may be concentrated by highlighting local highs and local lows on the chart. These levels are calculated using a lookback period to determine the highest and lowest points in the recent price action.
Local Highs: Displayed as red lines, these indicate recent peaks where price has experienced rejection or a possible reversal point.
Local Lows: Displayed as green lines, these represent recent troughs where price may find support or experience a bounce.
This indicator is useful for spotting potential areas of interest for price reversal or continuation, as high liquidity zones may lead to more significant price movements.
Key Features:
Adjustable lookback period to define the scope for identifying local highs and lows.
Continuous plotting without any time restrictions, providing real-time insights into liquidity conditions.
Alerts available for when a local high or local low is detected, enabling timely market analysis.
Use Case:
This indicator can be used in conjunction with other technical analysis tools or strategies to help identify significant price levels where liquidity could impact price action. It is suitable for both intraday and swing traders looking for key price zones where potential reversals or continuations might occur.
PDH & PDL Indicator: Previous Day's High/Low with AlertsThe PDH & PDL Indicator plots the Previous Day's High (PDH) and Previous Day's Low (PDL) directly on the chart, providing a clear visual reference for key price levels. These levels are often used by traders to identify potential breakout or breakdown zones and to gauge market strength or weakness.
Features:
PDH (Green Line) : Represents the high of the previous trading day.
PDL (Red Line): Represents the low of the previous trading day.
Alerts:
Get notified when the price crosses above PDH or below PDL.
Custom alert messages to keep you informed in real-time.
Use Cases:
Identify key breakout and breakdown points for potential trade entries or exits.
Confirm the strength of a trend by monitoring price action relative to PDH and PDL.
Useful for intraday, swing, and positional traders who rely on historical price levels for strategy development.

Harmonic Pattern Detector (75 patterns)Harmonic Pattern Detector offers a record amount of "Harmonic Patterns" in one script, with 75 different patterns detected, together with up to 99 different swing lengths.
🔶 USAGE
Harmonic Patterns are detected from several different ZigZag lines, derived from Swings with different lengths (shorter - longer term)
Depending on the settings ' Minimum/Maximum Swing Length ', the user will see more or less patterns from shorter and/or longer-term swing points.
🔹 Fibonacci Ratio
Certain patterns have only one ratio for a specific retrace/extension instead of one upper and one lower limit. In this case, we add a ' Tolerance ', which adds a percentage tolerance below/above the ratio, creating two limits.
A higher number may show more patterns but may become less valid.
Hoovering over points B, C, and D will show a tooltip with the concerning limits; adjusted limits will be seen if applicable.
Tooltips in settings will also show which patterns the Fibonacci Ratio applies to.
🔹 Triangle Area Ratio
Using Heron's formula , the triangle area is calculated after the X-Y axis is normalized.
Users can filter patterns based on the ratio of the smallest triangle to the largest triangle.
A lower Triangle Area Ratio number leads to more symmetrical patterns but may appear less frequently.
🔶 DETAILS
Harmonic patterns are based on geometric patterns, where the retracement/extension of a swing point must be located between specific Fibonacci ratios of the previous swing/leg. Different Harmonic Patterns require unique ratios to become valid patterns.
In the above example there is a valid 'Max Butterfly' pattern where:
Point B is located between 0.618 - 0.886 retracement level of the X-A leg
Point C is located between 0.382 - 0.886 retracement level of the A-B leg
Point D is located between 1.272 - 2.618 extension level of the B-C leg
Point D is located between 1.272 - 1.618 extension level of the X-A leg
Harmonic Pattern Detector uses ZigZag lines, where swing highs and swing lows alternate. Each ZigZag line is checked for valid Harmonic Patterns . When multiple types of Harmonic Patterns are valid for the same sequence, the pattern will be named after the first one found.
Different swing lengths form different ZigZag lines.
By evaluating different ZigZag lines (up to 99!), shorter—and longer-term patterns can be drawn on the same chart.
🔹 Blocks
The patterns are organized into blocks that can be toggled on or off with a single click.
When a block is enabled, the user can still select which specific patterns within that block are enabled or disabled.
🔹 Visuals
Besides color settings, labels can show pattern names or arrows at point D of the pattern.
Note this will happen 1 bar after validation because one extra bar is needed for confirmation.
An option is included to show only arrows without the patterns.
🔹 Updated Patterns
When a Swing Low is followed by a lower low or a Swing High followed by a higher high , triggering a pattern identical to a previous one except with a different point D, the pattern will be updated. The previous C-D line will be visible as a dashed line to highlight the event. Only the last dashed line is shown when this happens more than once.
🔹 Optimization
The script only verifies the last leg in the initial phase, significantly reducing the time spent on pattern validation. If this leg doesn't align with a potential Harmonic Pattern , the pattern is immediately disregarded. In the subsequent phase, the remaining patterns are quickly scrutinized to ensure the next leg is valid. This efficient process continues, with only valid patterns progressing to the next phase until all sequences have been thoroughly examined.
This process can check up to 99 ZigZag lines for 75 different Harmonic Patterns , showcasing its high capacity and versatility.
🔹 Ratios
The following table shows the different ratios used for each Harmonic Pattern .
' min ' and ' max ' are used when only one limit is provided instead of 2. This limit is given a percentage tolerance above and below, customizable by the setting ' Tolerance - Fibonacci Ratio '.
For example a ratio of 0.618 with a tolerance of 1% would result in:
an upper limit of 0.624
a lower limit of 0.612
|-------------------|------------------------|------------------------|-----------------------|-----------------------|
| NAME PATTERN | BCD (BD) | ABC (AC) | XAB (XB) | XAD (XD) |
| | min max | min max | min max | min max |
|-------------------|------------------------|------------------------|-----------------------|-----------------------|
| 'ABCD' | 1.272 - 1.618 | 0.618 - 0.786 | | |
| '5-0' | 0.5 *min - 0.5 *max | 1.618 - 2.24 | 1.13 - 1.618 | |
| 'Max Gartley' | 1.128 - 2.236 | 0.382 - 0.886 | 0.382 - 0.618 | 0.618 - 0.786 |
| 'Gartley' | 1.272 - 1.618 | 0.382 - 0.886 | 0.618*min - 0.618*max | 0.786*min - 0.786*max |
| 'A Gartley' | 1.618*min - 1.618*max | 1.128 - 2.618 | 0.618 - 0.786 | 1.272*min - 1.272*max |
| 'NN Gartley' | 1.128 - 1.618 | 0.382 - 0.886 | 0.618*min - 0.618*max | 0.786*min - 0.786*max |
| 'NN A Gartley' | 1.618*min - 1.618*max | 1.128 - 2.618 | 0.618 - 0.786 | 1.272*min - 1.272*max |
| 'Bat' | 1.618 - 2.618 | 0.382 - 0.886 | 0.382 - 0.5 | 0.886*min - 0.886*max |
| 'Alt Bat' | 2.0 - 3.618 | 0.382 - 0.886 | 0.382*min - 0.382*max | 1.128*min - 1.128*max |
| 'A Bat' | 2.0 - 2.618 | 1.128 - 2.618 | 0.382 - 0.618 | 1.128*min - 1.128*max |
| 'Max Bat' | 1.272 - 2.618 | 0.382 - 0.886 | 0.382 - 0.618 | 0.886*min - 0.886*max |
| 'NN Bat' | 1.618 - 2.618 | 0.382 - 0.886 | 0.382 - 0.5 | 0.886*min - 0.886*max |
| 'NN Alt Bat' | 2.0 - 4.236 | 0.382 - 0.886 | 0.382*min - 0.382*max | 1.128*min - 1.128*max |
| 'NN A Bat' | 2.0 - 2.618 | 1.128 - 2.618 | 0.382 - 0.618 | 1.128*min - 1.128*max |
| 'NN A Alt Bat' | 2.618*min - 2.618*max | 1.128 - 2.618 | 0.236 - 0.5 | 0.886*min - 0.886*max |
| 'Butterfly' | 1.618 - 2.618 | 0.382 - 0.886 | 0.786*min - 0.786*max | 1.272 - 1.618 |
| 'Max Butterfly' | 1.272 - 2.618 | 0.382 - 0.886 | 0.618 - 0.886 | 1.272 - 1.618 |
| 'Butterfly 113' | 1.128 - 1.618 | 0.618 - 1.0 | 0.786 - 1.0 | 1.128*min - 1.128*max |
| 'A Butterfly' | 1.272*min - 1.272*max | 1.128 - 2.618 | 0.382 - 0.618 | 0.618 - 0.786 |
| 'Crab' | 2.24 - 3.618 | 0.382 - 0.886 | 0.382 - 0.618 | 1.618*min - 1.618*max |
| 'Deep Crab' | 2.618 - 3.618 | 0.382 - 0.886 | 0.886*min - 0.886*max | 1.618*min - 1.618*max |
| 'A Crab' | 1.618 - 2.618 | 1.128 - 2.618 | 0.276 - 0.446 | 0.618*min - 0.618*max |
| 'NN Crab' | 2.236 - 4.236 | 0.382 - 0.886 | 0.382 - 0.618 | 1.618*min - 1.618*max |
| 'NN Deep Crab' | 2.618 - 4.236 | 0.382 - 0.886 | 0.886*min - 0.886*max | 1.618*min - 1.618*max |
| 'NN A Crab' | 1.128 - 2.618 | 1.128 - 2.618 | 0.236 - 0.447 | 0.618*min - 0.618*max |
| 'NN A Deep Crab' | 1.128*min - 1.128*max | 1.128 - 2.618 | 0.236 - 0.382 | 0.618*min - 0.618*max |
| 'Cypher' | 1.272 - 2.00 | 1.13 - 1.414 | 0.382 - 0.618 | 0.786*min - 0.786*max |
| 'New Cypher' | 1.272 - 2.00 | 1.414 - 2.14 | 0.382 - 0.618 | 0.786*min - 0.786*max |
| 'Anti New Cypher' | 1.618 - 2.618 | 0.467 - 0.707 | 0.5 - 0.786 | 1.272*min - 1.272*max |
| 'Shark 1' | 1.618 - 2.236 | 1.128 - 1.618 | 0.382 - 0.618 | 0.886*min - 0.886*max |
| 'Shark 1 Alt' | 1.618 - 2.618 | 0.618 - 0.886 | 0.446 - 0.618 | 1.128*min - 1.128*max |
| 'Shark 2' | 1.618 - 2.236 | 1.128 - 1.618 | 0.382 - 0.618 | 1.128*min - 1.128*max |
| 'Shark 2 Alt' | 1.618 - 2.618 | 0.618 - 0.886 | 0.446 - 0.618 | 0.886*min - 0.886*max |
| 'Leonardo' | 1.128 - 2.618 | 0.382 - 0.886 | 0.5*min - 0.5*max | 0.786*min - 0.786*max |
| 'NN A Leonardo' | 2.0*min - 2.0*max | 1.128 - 2.618 | 0.382 - 0.886 | 1.272*min - 1.272*max |
| 'Nen Star' | 1.272 - 2.0 | 1.414 - 2.14 | 0.382 - 0.618 | 1.272*min - 1.272*max |
| 'Anti Nen Star' | 1.618 - 2.618 | 0.467 - 0.707 | 0.5 - 0.786 | 0.786*min - 0.786*max |
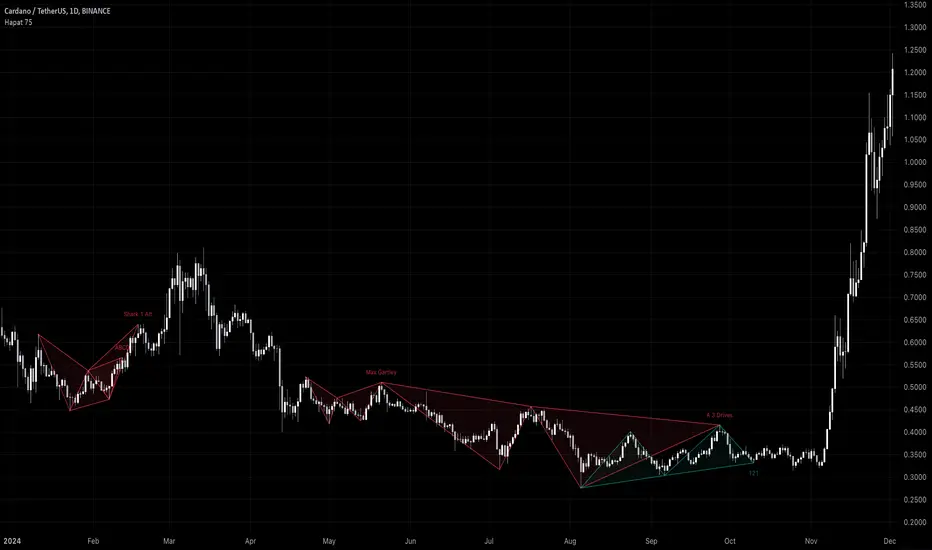
| '3 Drives' | 1.272 - 1.618 | 0.618 - 0.786 | 1.272 - 1.618 | 1.618 - 2.618 |
| 'A 3 Drives' | 0.618 - 0.786 | 1.272 - 1.618 | 0.618 - 0.786 | 0.13 - 0.886 |
| '121' | 0.382 - 0.786 | 1.128 - 3.618 | 0.5 - 0.786 | 0.382 - 0.786 |
| 'A 121' | 1.272 - 2.0 | 0.5 - 0.786 | 1.272 - 2.0 | 1.272 - 2.618 |
| '121 BG' | 0.618 - 0.707 | 1.128 - 1.733 | 0.5 - 0.577 | 0.447 - 0.786 |
| 'Black Swan' | 1.128 - 2.0 | 0.236 - 0.5 | 1.382 - 2.618 | 1.128 - 2.618 |
| 'White Swan' | 0.5 - 0.886 | 2.0 - 4.237 | 0.382 - 0.786 | 0.238 - 0.886 |
| 'NN White Swan' | 0.5 - 0.886 | 2.0 - 4.236 | 0.382 - 0.724 | 0.382 - 0.886 |
| 'Sea Pony' | 1.618 - 2.618 | 0.382 - 0.5 | 0.128 - 3.618 | 0.618 - 3.618 |
| 'Navarro 200' | 0.886 - 3.618 | 0.886 - 1.128 | 0.382 - 0.786 | 0.886 - 1.128 |
| 'May-00' | 0.5 - 0.618 | 1.618 - 2.236 | 1.128 - 1.618 | 0.5 - 0.618 |
| 'SNORM' | 0.9 - 1.1 | 0.9 - 1.1 | 0.9 - 1.1 | 0.618 - 1.618 |
| 'COL Poruchik' | 1.0 *min - 1.0 *max | 0.382 - 2.618 | 0.128 - 3.618 | 0.618 - 3.618 |
| 'Henry – David' | 0.618 - 0.886 | 0.44 - 0.618 | 0.128 - 2.0 | 0.618 - 1.618 |
| 'DAVID VM 1' | 1.618 - 1.618 | 0.382*min - 0.382*max | 0.128 - 1.618 | 0.618 - 3.618 |
| 'DAVID VM 2' | 1.618 - 1.618 | 0.382*min - 0.382*max | 1.618 - 3.618 | 0.618 - 7.618 |
| 'Partizan' | 1.618*min - 1.618*max | 0.382*min - 0.382*max | 0.128 - 3.618 | 0.618 - 3.618 |
| 'Partizan 2' | 1.618 - 2.236 | 1.128 - 1.618 | 0.128 - 3.618 | 1.618 - 3.618 |
| 'Partizan 2.1' | 1.618*min - 1.618*max | 1.128*min - 1.128*max | 0.128 - 3.618 | 0.618 - 3.618 |
| 'Partizan 2.2' | 2.236*min - 2.236*max | 1.128*min - 1.128*max | 0.128 - 3.618 | 0.618 - 3.618 |
| 'Partizan 2.3' | 1.618*min - 1.618*max | 0.618 - 1.618 | 0.128 - 3.618 | 0.618 - 3.618 |
| 'Partizan 2.4' | 2.236*min - 2.236*max | 1.618*min - 1.618*max | 0.128 - 3.618 | 0.618 - 3.618 |
| 'TOTAL' | 1.272 - 3.618 | 0.382 - 2.618 | 0.276 - 0.786 | 0.618 - 1.618 |
| 'TOTAL NN' | 1.272 - 4.236 | 0.382 - 2.618 | 0.236 - 0.786 | 0.618 - 1.618 |
| 'TOTAL 1' | 1.272 - 2.618 | 0.382 - 0.886 | 0.382 - 0.786 | 0.786 - 0.886 |
| 'TOTAL 2' | 1.618 - 3.618 | 0.382 - 0.886 | 0.382 - 0.786 | 1.128 - 1.618 |
| 'TOTNN 2NN' | 1.618 - 4.236 | 0.382 - 0.886 | 0.382 - 0.786 | 1.128 - 1.618 |
| 'TOTAL 3' | 1.272 - 2.618 | 1.128 - 2.618 | 0.276 - 0.618 | 0.618 - 0.886 |
| 'TOTNN 3NN' | 1.272 - 2.618 | 1.128 - 2.618 | 0.236 - 0.618 | 0.618 - 0.886 |
| 'TOTAL 4' | 1.618 - 2.618 | 1.128 - 2.618 | 0.382 - 0.786 | 1.128 - 1.272 |
| 'BG 1' | 2.618*min - 2.618*max | 0.382*min - 0.382*max | 0.128 - 0.886 | 1.0 *min - 1.0 *max |
| 'BG 2' | 2.237*min - 2.237*max | 0.447*min - 0.447*max | 0.128 - 0.886 | 1.0 *min - 1.0 *max |
| 'BG 3' | 2.0 *min - 2.0 *max | 0.5 *min - 0.5 *max | 0.128 - 0.886 | 1.0 *min - 1.0 *max |
| 'BG 4' | 1.618*min - 1.618*max | 0.618*min - 0.618*max | 0.128 - 0.886 | 1.0 *min - 1.0 *max |
| 'BG 5' | 1.414*min - 1.414*max | 0.707*min - 0.707*max | 0.128 - 0.886 | 1.0 *min - 1.0 *max |
| 'BG 6' | 1.272*min - 1.272*max | 0.786*min - 0.786*max | 0.128 - 0.886 | 1.0 *min - 1.0 *max |
| 'BG 7' | 1.171*min - 1.171*max | 0.854*min - 0.854*max | 0.128 - 0.886 | 1.0 *min - 1.0 *max |
| 'BG 8' | 1.128*min - 1.128*max | 0.886*min - 0.886*max | 0.128 - 0.886 | 1.0 *min - 1.0 *max |
|-------------------|------------------------|------------------------|-----------------------|-----------------------|
🔶 SETTINGS
🔹 Swings
Minimum Swing Length: Minimum length used for the swing detection.
Maximum Swing Length: Maximum length used for the swing detection.
🔹 Patterns
Toggle Pattern Block
Toggle separate pattern in each Pattern Block
🔹 Tolerance
Fibonacci Ratio: Adds a percentage tolerance below/above the ratio when only one ratio applies, creating two limits.
Triangle Area Ratio: Filters patterns based on the ratio of the smallest triangle to the largest triangle.
🔹 Display
Labels: Display Pattern Names, Arrows or nothing
Patterns: Display or not
Last Line: Display previous C-D line when updated
🔹 Style
Colors: Pattern Lines/Names/Arrows - background color of patterns
Text Size: Text Size of Pattern Names/Arrows
🔹 Calculation
Calculated Bars: Allows the usage of fewer bars for performance/speed improvement
3 Drive Harmonic Pattern [TradingFinder] Three Drive Reversal🔵 Introduction
The Three Drive harmonic pattern closely resembles other price structures such as Wedge Pattern and Three Push Pattern, yet it stands out due to its precise use of Fibonacci ratios and symmetrical price movements.
This pattern comprises three consecutive and symmetrical price drives, each validated by key Fibonacci ratios (1.27 and 1.618), which help identify critical Potential Reversal Zones (PRZ).
Unlike the Wedge, which relies on converging trend lines and can indicate either continuation or reversal, and the Three Push, which lacks defined Fibonacci ratios and symmetry, the Three Drive pattern defines PRZ with greater accuracy, providing traders with high-probability trading opportunities.
This pattern appears in both bullish and bearish trends. After the completion of the third drive (Drive 3), it signals the market's readiness to reverse direction. The PRZ in this pattern serves as a crucial zone where price is highly likely to reverse, offering a strategic point for entering or exiting trades. Professional traders utilize the Three Drive pattern and PRZ as essential tools for analyzing and capitalizing on potential market reversals.
Bullish Pattern :
Bearish Pattern :
🔵 How to Use
The Three Drive harmonic pattern is an effective tool for identifying potential reversal points in the market. By utilizing Fibonacci extension levels (1.27 and 1.618) and focusing on the pattern’s symmetry, traders can pinpoint Potential Reversal Zones (PRZ) where the price is likely to change direction. This pattern works in both bearish and bullish scenarios, each with distinct characteristics and trading opportunities.
🟣 Bullish Three Drive Pattern
The bullish Three Drive pattern develops during a downtrend, indicating a potential reversal to the upside. Similar to its bearish counterpart, this pattern features three consecutive downward price movements (drives) with retracements in between. The third drive concludes within the PRZ, which serves as a strong support zone where the price is expected to reverse upwards.
The first drive begins with a downward movement, followed by a retracement to the 0.618 Fibonacci level. The second drive continues downward to reach a 1.27 or 1.618 Fibonacci extension of the retracement. Finally, the third drive aligns with the PRZ, where a confluence of Fibonacci levels creates a high-probability support zone.
In the PRZ, traders look for bullish confirmation signals such as bullish candlestick patterns (e.g., bullish engulfing or pin bars) or increasing trading volume. Once confirmation is observed, the PRZ becomes an ideal entry point for a buy position. Stop-loss orders are placed slightly below the PRZ to minimize risk, while take-profit targets are set at key resistance levels or Fibonacci retracement levels.
🟣 Bearish Three Drive Pattern
The bearish Three Drive pattern forms during an uptrend, signaling a potential reversal to the downside. This pattern consists of three consecutive upward price movements (drives) and intermediate retracements. Each drive aligns with Fibonacci extension levels, and the third drive ends within the PRZ, indicating a high probability of a bearish reversal.
In the first drive, the price moves upward and then retraces to approximately the 0.618 Fibonacci retracement level, forming the base for the second drive. The second drive then extends upward to the 1.27 or 1.618 Fibonacci extension of the preceding retracement. This process repeats for the third drive, which reaches the PRZ, typically defined by the convergence of Fibonacci levels from previous drives.
Once the PRZ is identified, traders look for confirmation signals such as bearish candlestick patterns (e.g., bearish engulfing or pin bars) or declining trading volume. If confirmation is present, the PRZ becomes an optimal zone for entering a sell position. Stop-loss levels are typically placed slightly above the PRZ to protect against pattern failure, and take-profit targets are set at key support levels or Fibonacci retracement levels of the overall structure.
🟣 Three Drive Vs Wedge Pattern Vs 3 Push pattern
The Three Drive, Wedge, and Three Push patterns are all used to identify potential price reversal points, but they differ significantly in structure and application. The Three Drive pattern is based on three consecutive and symmetrical price movements, validated by precise Fibonacci ratios (1.27 and 1.618), to define Potential Reversal Zones (PRZ).
In contrast, the Wedge pattern relies on converging trend lines and does not require Fibonacci ratios; it can act as either a reversal or continuation pattern. Meanwhile, the Three Push pattern shares similarities with Three Drive but lacks precise symmetry and Fibonacci-based validation.
Instead of a PRZ, Three Push focuses on identifying areas of support and resistance, often signaling weakening momentum in the current trend. Among these, the Three Drive pattern is more reliable for pinpointing high-probability reversal zones due to its strict Fibonacci-based and symmetrical structure.
🔵 Setting
🟣 Logical Setting
ZigZag Pivot Period : You can adjust the period so that the harmonic patterns are adjusted according to the pivot period you want. This factor is the most important parameter in pattern recognition.
Show Valid Format : If this parameter is on "On" mode, only patterns will be displayed that they have exact format and no noise can be seen in them. If "Off" is, the patterns displayed that maybe are noisy and do not exactly correspond to the original pattern.
Show Formation Last Pivot Confirm : if Turned on, you can see this ability of patterns when their last pivot is formed. If this feature is off, it will see the patterns as soon as they are formed. The advantage of this option being clear is less formation of fielded patterns, and it is accompanied by the latest pattern seeing and a sharp reduction in reward to risk.
Period of Formation Last Pivot : Using this parameter you can determine that the last pivot is based on Pivot period.
🟣 Genaral Setting
Show : Enter "On" to display the template and "Off" to not display the template.
Color : Enter the desired color to draw the pattern in this parameter.
LineWidth : You can enter the number 1 or numbers higher than one to adjust the thickness of the drawing lines. This number must be an integer and increases with increasing thickness.
LabelSize : You can adjust the size of the labels by using the "size.auto", "size.tiny", "size.smal", "size.normal", "size.large" or "size.huge" entries.
🟣 Alert Setting
Alert : On / Off
Message Frequency : This string parameter defines the announcement frequency. Choices include: "All" (activates the alert every time the function is called), "Once Per Bar" (activates the alert only on the first call within the bar), and "Once Per Bar Close" (the alert is activated only by a call at the last script execution of the real-time bar upon closing). The default setting is "Once per Bar".
Show Alert Time by Time Zone : The date, hour, and minute you receive in alert messages can be based on any time zone you choose. For example, if you want New York time, you should enter "UTC-4". This input is set to the time zone "UTC" by default.
🔵 Conclusion
The Three Drive pattern is a highly effective harmonic tool for identifying potential reversal points in the market. By leveraging its symmetrical structure and precise Fibonacci ratios (1.27 and 1.618), this pattern provides traders with clear entry and exit signals, enhancing the accuracy of their trades.
Whether in bullish or bearish scenarios, the identification of the Potential Reversal Zone (PRZ) serves as a critical aspect of this pattern, enabling traders to anticipate price movements with greater confidence.
Compared to similar patterns like Wedge and Three Push, the Three Drive pattern stands out for its stringent reliance on Fibonacci levels and symmetrical price movements, making it a more robust choice for forecasting reversals. However, as with any technical analysis tool, its effectiveness increases when combined with confirmation signals, such as candlestick patterns, volume analysis, and broader market context.
Mastering the Three Drive pattern requires practice and attention to detail, especially in accurately defining the PRZ and ensuring the pattern adheres to its criteria. Traders who consistently apply this pattern as part of a comprehensive trading strategy can capitalize on high-probability opportunities and improve their overall performance in the market.

Double Top/Bottom [AlgoAlpha]Introducing the Double Top/Bottom Indicator by AlgoAlpha, a powerful tool designed to identify key reversal patterns in the market with precision. This indicator meticulously detects double tops and double bottoms, helping traders recognize potential trend reversals and make informed trading decisions.
Key Features:
🔍 Pattern Detection : Accurately identifies double top and double bottom formations based on customizable time horizons.
🎨 Customizable Appearance : Choose your preferred colors for bullish and bearish trends to match your trading style.
📊 Signal Labels : Option to display only the second pivot of the double top/bottom for a cleaner chart view.
🔧 Flexible Settings : Adjust the time horizon to control the look-back period, allowing for detection of both short-term and long-term patterns.
📈 Visual Enhancements : Draws trend lines and fills between pivotal points to visually highlight potential reversal zones.
🔔 Alerts : Set up alerts for potential double top and double bottom formations to stay informed of key market movements.
How to Use the Double Top/Bottom Indicator :
🛠 Add the Indicator : Simply add the Double Top/Bottom Indicator to your TradingView chart from your favorites. Customize the time horizon and appearance settings to fit your trading preferences.
📊 Analyze Patterns : Watch for the identified double top and double bottom patterns along with the corresponding trend lines and filled areas to anticipate potential market reversals.
🔔 Set Alerts : Enable alerts to receive notifications when double top or double bottom patterns are detected, ensuring you never miss a critical trading opportunity.
How It Works : The indicator scans the price action for pivot highs and lows within a specified time horizon, identifying potential double top and double bottom patterns. It maintains a sequence of these pivots and verifies the formation of these patterns based on the relationship between consecutive pivots and the proximity to a defined limit. When a double top or double bottom is confirmed, the indicator marks the second pivot point with a label and draws trend lines to visualize the reversal pattern. Additionally, it provides alert conditions to notify traders of potential confirmations, enhancing decision-making without cluttering the chart.
⚠️ Important Reminder : The labels indicating double tops and bottoms appear with a delay and are intended to mark the formations after they have already formed. They are not meant to be used as real-time trading signals. While they align perfectly with pivot points in hindsight, please use them as markers for analysis rather than immediate trading triggers.

BTC CME Futures Divergence TrackerThis script tracks divergences between price action and open interest for the BTC CME Futures contract (symbol "BTC1!") using the following components:
Key Features:
1. Price Analysis: Identifies lower highs in the price over a specified lookback period. Marks these points with red upward-facing triangles above the bars.
2. Open Interest Analysis: Retrieves open interest (OI) data for the BTC CME Futures contract via request.security. Detects lower highs in open interest over the same lookback period. Highlights these points with blue downward-facing triangles below the bars.
3. Divergence Detection: A divergence is identified when both price and open interest form lower highs simultaneously. Highlights such occurrences with a purple background, indicating potential bearish sentiment or weakening momentum.
4. Alerts: If divergences are detected, an alert is triggered (if enabled), notifying the trader to take action.
5. Visualization: Open interest is plotted as a blue line in a separate pane for added context. Red and blue markers highlight significant points in price and open interest trends.
Use Cases:
- Spot Weakening Trends: Divergences between price and open interest may indicate a loss of momentum or bearish sentiment, allowing traders to preemptively adjust their strategies.
- Monitor Institutional Activity: Open interest changes reflect shifts in market participation, especially in derivative markets like CME Futures.
- Set Alerts for Key Signals: With automated alerts, traders can stay informed of potential divergence signals without constant monitoring.
Customization Options:
- Lookback Period: Adjust the number of bars used to detect lower highs.
- Timeframe: Choose the timeframe for fetching open interest data (e.g., daily, hourly).
- Alert Activation: Enable or disable alerts for divergences.
This tool combines price action with open interest dynamics to provide a robust method for identifying market trends and potential reversals in BTC CME Futures.
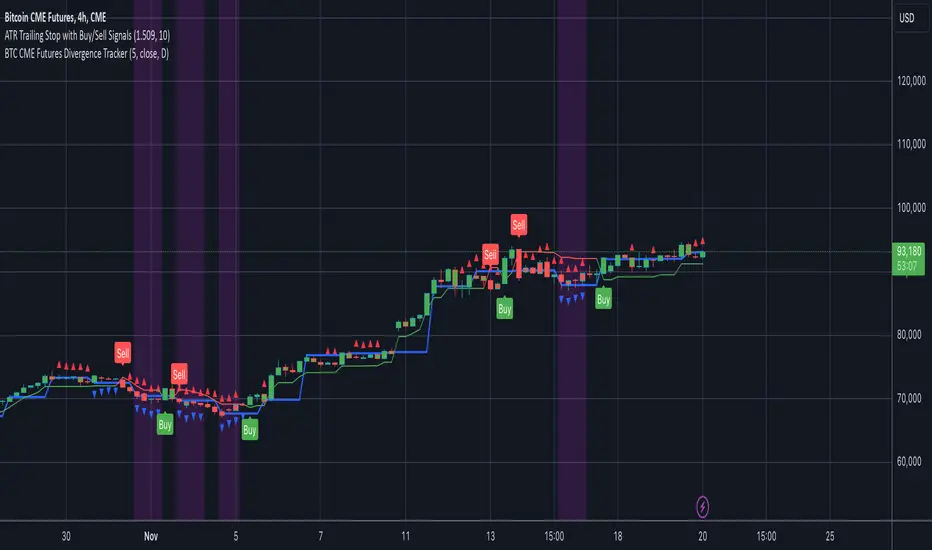
Candlestick Pattern ScannerCandlestick Pattern Scanner
This indicator identifies popular candlestick patterns on the chart and provides visual and alert-based support for traders. Based on technical analysis, it provides insights into potential trend reversals or continuation signals in price action. The following patterns are detected and marked:
1. Bullish Engulfing
Definition: Considered a strong bullish signal. A small red candle is followed by a large green candle that completely engulfs the previous one.
Chart Display: Marked with a green arrow below the price bar.
Alert Message: "Bullish Engulfing Pattern Detected!"
2. Bearish Engulfing
Definition: Considered a strong bearish signal. A small green candle is followed by a large red candle that completely engulfs the previous one.
Chart Display: Marked with a red arrow above the price bar.
Alert Message: "Bearish Engulfing Pattern Detected!"
3. Doji
Definition: Indicates indecision in the market. The candlestick has an opening and closing price that are almost the same, forming a very small body.
Chart Display: Marked with a blue triangle below the price bar.
Alert Message: "Doji Pattern Detected!"
4. Hammer
Definition: Can signal a strong bullish reversal. It has a long lower shadow and a small body, often appearing at the end of a downtrend.
Chart Display: Marked with an orange triangle below the price bar.
Alert Message: "Hammer Pattern Detected!"
5. Shooting Star
Definition: Can signal a strong bearish reversal. It has a long upper shadow and a small body, often appearing at the end of an uptrend.
Chart Display: Marked with a purple triangle above the price bar.
Alert Message: "Shooting Star Pattern Detected!"
Features:
Visual Support: Patterns are clearly marked on the chart using distinct shapes (arrows and triangles).
Alerts: Receive real-time notifications through TradingView’s alert system when a pattern is detected.
Versatility: Useful for identifying both trend reversals and continuation signals.
User-Friendly: Patterns are easily distinguishable with unique color coding.
Purpose:
This indicator helps traders identify potential reversal points or strong trend beginnings in price action. It can be used as a supportive tool in scalping, swing trading, or long-term investment strategies.
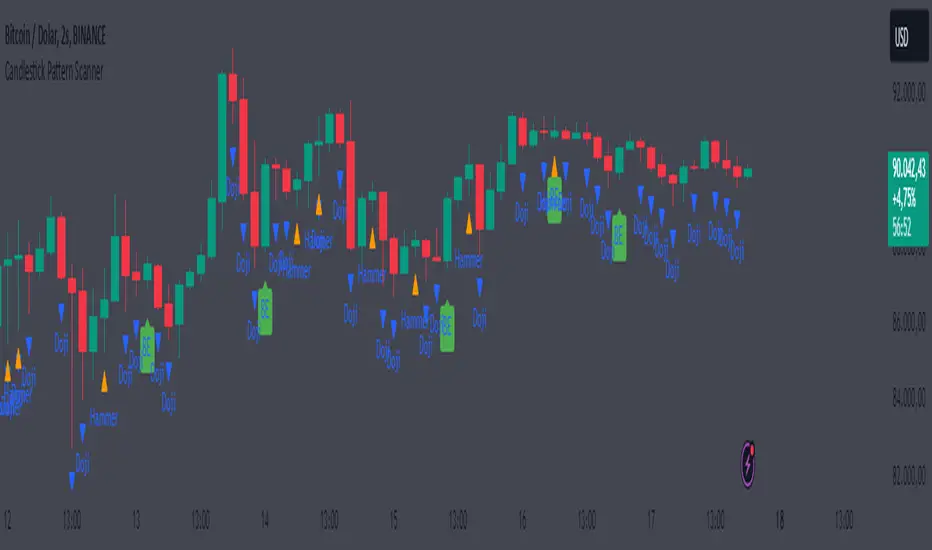
[EmreKb] Custom PatternCustom Pattern
With this indicator, you can create and display as many patterns as you want on the chart. The indicator works by taking two inputs. We can start the explanation by describing these inputs.
Inputs
Zigzag Length: Length for zigzag legs.
Patternscript Code: Patternscript code. (But what is patternscript?)
Explanation Of Patternscript
Patternscript (it's a completely fictional script language) is a scripting language that allows you to write your own patterns, and it operates within Pinescript). Let's take a look at the syntax of this language.
{
(, )
}
...
This means that the Fibonacci levels drawn from the from_point to the to_point must have the target_point between the min_fib_level and max_fib_level .
Let's see a few practical examples.
Patternscript Code For ABCD Pattern
ABCD{
ABC(0.618, 0.886)
BCD(1.272, 1.618)
}
ABC(0.618, 0.886): Fibonacci drawn from the A to B, must have the C between the 0.618 and 0.886
BCD(1.272, 1.618): Fibonacci drawn from the B to C, must have the D between the 1.272 and 1.618
Patternscript Code For Multiple Pattern
BAT{
XAB(0.382, 0.5)
ABC(0.382, 0.886)
BCD(1.618, 2.618)
XAD(0.382, 0.886)
}
ABCD{
ABC(0.618, 0.886)
BCD(1.272, 1.618)
}
Notes:
You can set the pattern name as you like, this is not related to the pattern rules.
There is no limit for pattern count, but remember pine limits.