Cosmic Volume Analyzer [JOAT]
Cosmic Volume Analyzer - Astrophysics Edition
Overview
Cosmic Volume Analyzer is an open-source oscillator indicator that applies astrophysics-inspired concepts to volume analysis. It classifies volume into buy/sell categories, calculates volume flow, detects accumulation/distribution phases, identifies climax volume events, and uses gravitational and stellar mass analogies to visualize volume dynamics.
What This Indicator Does
The indicator calculates and displays:
Volume Classification - Categorizes each bar as CLIMAX_BUY, CLIMAX_SELL, HIGH_BUY, HIGH_SELL, NORMAL_BUY, or NORMAL_SELL
Volume Flow - Percentage showing buy vs sell pressure over a lookback period
Buy/Sell Volume - Separated volume based on candle direction
Accumulation/Distribution - Phase detection using Money Flow Multiplier
Volume Oscillator - Fast vs slow volume EMA comparison
Gravitational Pull - Volume-weighted price attraction metric
Stellar Mass Index - Volume ratio combined with price momentum
Black Hole Detection - Identifies extremely low volume periods (liquidity voids)
Supernova Events - Detects extreme volume with extreme price movement
Orbital Cycles - Sine-wave based cyclical visualization
How It Works
Volume classification uses volume ratio and candle direction:
classifyVolume(series float vol, series float close, series float open) =>
float avgVol = ta.sma(vol, 20)
float volRatio = avgVol > 0 ? vol / avgVol : 1.0
if volRatio > 1.5
if close > open
classification := "CLIMAX_BUY"
else
classification := "CLIMAX_SELL"
else if volRatio > 1.2
// HIGH_BUY or HIGH_SELL
else
// NORMAL_BUY or NORMAL_SELL
Volume flow separates buy and sell volume over a period:
calculateVolumeFlow(series float vol, series float close, simple int period) =>
float currentBuyVol = close > open ? vol : 0.0
float currentSellVol = close < open ? vol : 0.0
// Accumulate in buffers
float flow = (buyVolume - sellVolume) / totalVol * 100
Accumulation/Distribution uses the Money Flow Multiplier:
float mfm = ((close - low) - (high - close)) / (high - low)
float mfv = mfm * vol
float adLine = ta.cum(mfv)
if adLine > adEMA and ta.rising(adLine, 3)
phase := "ACCUMULATION"
else if adLine < adEMA and ta.falling(adLine, 3)
phase := "DISTRIBUTION"
Gravitational pull uses volume-weighted price distance:
gravitationalPull(series float vol, series float price, simple int period) =>
float massCenter = ta.vwma(price, period)
float distance = math.abs(price - massCenter)
float mass = vol / ta.sma(vol, period)
float gravity = distance > 0 ? mass / (distance * distance) : 0.0
Signal Generation
Signals are generated based on volume conditions:
Buy Climax: Volume exceeds 2 standard deviations above average on bullish candle
Sell Climax: Volume exceeds 2 standard deviations above average on bearish candle
Strong Buy Flow: Volume flow exceeds positive threshold (default 45%)
Strong Sell Flow: Volume flow exceeds negative threshold (default -45%)
Supernova: Volume 3x average AND price change 3x average
Black Hole: Volume 2 standard deviations below average
Dashboard Panel (Top-Right)
Volume Class - Current volume classification
Volume Flow - Buy/sell flow percentage
Buy Volume - Accumulated buy volume
Sell Volume - Accumulated sell volume
A/D Phase - ACCUMULATION/DISTRIBUTION/NEUTRAL
Volume Strength - Normalized volume strength
Gravity Pull - Current gravitational metric
Stellar Mass - Current stellar mass index
Cosmic Field - Combined cosmic field strength
Black Hole - Detection status and void strength
Signal - Current actionable status
Visual Elements
Volume Ratio Columns - Colored bars showing normalized volume
Volume Flow Line - Main oscillator showing flow direction
Flow EMA - Smoothed flow for trend reference
Volume Oscillator - Area plot showing fast/slow comparison
Gravity Field - Area plot showing gravitational pull
Orbital Cycle - Circle plots showing cyclical pattern
Stellar Mass Line - Line showing mass index
Climax Markers - Fire emoji for buy climax, snowflake for sell climax
Supernova Markers - Diamond shapes for extreme events
Black Hole Markers - X-cross for liquidity voids
A/D Phase Background - Subtle background color based on phase
Input Parameters
Volume Period (default: 20) - Period for volume calculations
Distribution Levels (default: 5) - Granularity of distribution analysis
Flow Threshold (default: 1.5) - Multiplier for flow significance
Accumulation Period (default: 14) - Period for A/D calculation
Gravitational Analysis (default: true) - Enable gravity metrics
Black Hole Detection (default: true) - Enable void detection
Stellar Mass Calculation (default: true) - Enable mass index
Orbital Cycles (default: true) - Enable cyclical visualization
Supernova Detection (default: true) - Enable extreme event detection
Suggested Use Cases
Identify accumulation phases for potential long entries
Watch for distribution phases as potential exit signals
Use climax volume as potential exhaustion indicators
Monitor volume flow for directional bias
Avoid trading during black hole (low liquidity) periods
Watch for supernova events as potential trend acceleration
Timeframe Recommendations
Best on 15m to Daily charts. Volume analysis requires sufficient trading activity for meaningful readings.
Limitations
Volume data quality varies by exchange and instrument
Buy/sell separation is based on candle direction, not actual order flow
Astrophysics concepts are analogies, not literal physics
A/D phase detection may lag during rapid transitions
Open-Source and Disclaimer
This script is published as open-source under the Mozilla Public License 2.0 for educational purposes. It does not constitute financial advice. Past performance does not guarantee future results. Always use proper risk management.
- Made with passion by officialjackofalltrades
Gravity

Rotational Gravity OscillatorMade using elements from two Cheatcountry scripts:
Includes a Bollinger Band for bounds that forms a trend follower based on the 0 point.
Includes CheatCountry color code signals, different color scheme. Bright colors are strong signals, ark are weak, green bull, red bear, the basics.
Switches for Bollinger Band color codes, which can actually be useful signals.
This oscillator can be used for divergences, trends, signal strength, confirmation, volatility readings, you name it.
It is a comparative oscillator, that compares adaptively smoothed, weighted modified Change of Gravity oscillators between 2 symbols and multiple lengths to determine directional momentum as one asset compares to another.
The default uses the Crypto TOTAL market cap to help trade cryptocurrencies. You will notice that BTC will give sell signals in uptrends at times. That is because it is being compared to an index of the total Crypto market cap, and since alt-coins move faster, BTC will lag behind this index.
Give CheatCountry a follow, hes one of the MVPs of Tradingview Pinescripters, constantly giving us access to novel new concepts as they are published by professionals.

Center Of Gravity OscillatorThe COG Oscillator (center of gravity) is an indicator based on statistics and the Fibonacci golden ratio. It uses ALMA as a trigger and LSMA as "zero line". The trigger is set tight by default but can be tweaked by adjusting the window size and sigma in settings. This is a great indicator for setting up trades and spotting reversals. There are 2 main strategies that come with this indicator:
Strategy 1: Long positions are entered when current low point is higher than previous low. Short positions are entered as current high is lower than previous high. (Shown in image above)
Strategy 2 : If market is bullish long trades are entered as COG line crosses over red LSMA line. Traders have the option of scalping the first crossover or even scaling out of trade to close on second exit. This works the opposite for shorts when market is bearish.
Above shows different configurations of the indicator. Top shows length of 50, Middle has length of 21 and bottom is default 9.

Ehlers Center Of Gravity Oscillator [CC]The Center of Gravity Oscillator was created by John Ehlers (Cybernetic Analysis For Stocks And Futures pg 49) and this provides a pretty accurate way to see how the stock is trending. If the indicator stays above 0 then the stock is in a pretty strong uptrend and if it stays below 0 then the stock is in a pretty strong downtrend. Buy when the indicator changes from red to green and sell when it changes from green to red.
Let me know if you would like me to publish any other indicators or if you want something custom done!

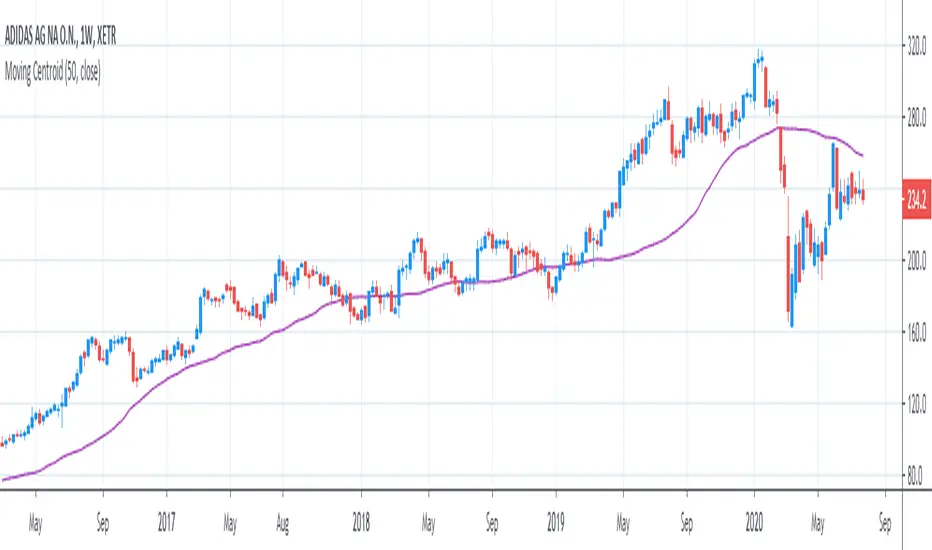
[R&D] Moving CentroidThis script utilizes this concept. Instead of weighting by volume, it weights by amount of price action on every close price of the rolling window. I assume it can be used as an additional reference point for price mode and price antimode.
it is directly connected with Market (not volume) profile, or TPO charts.
The algorithm:
1) takes a rolling window of, for example, 50 data points of close prices:
2) for each of this closing prices, the algorithm will check how many bars touched this close price.
3) then: sum of datapoints * weights/sum of weights
Since the logic is implemented in pretty non-efficient way, the script sometimes can take time to make calculations. Moreover, it calculates the centroid taking into account only close prices, not every tick. of a given rolling window That's why it's still experimental.
Sell Gravitation IndexThe Sell Gravitation Index was created by Howard Wang and was published in Stocks & Commodities V37:02 (36-38)
This indicator is similar to the relative strength index but the big difference is that this indicator gives early buy and sell signals which I find very helpful. Buy when it rises above its signal line and sell when it falls below its signal line.
Let me know if you would like to see me publish any other scripts!

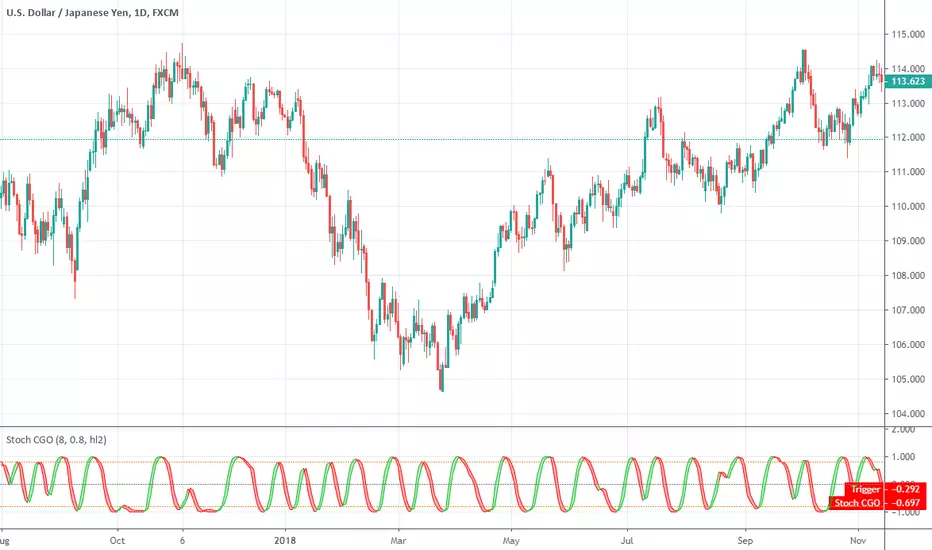
Stochastic CG Oscillator (Center of Gravity)Stochastic CG Oscillator (Center of Gravity) script.
This indicator was originally developed by John F. Ehlers (see his book `Cybernetic Analysis for Stocks and Futures`, Chapter 8: `Stochasticization and Fisherization of Indicators`).
CG Oscillator (Center of Gravity)CG Oscillator indicator script. This indicator was originally developed by John Ehlers.

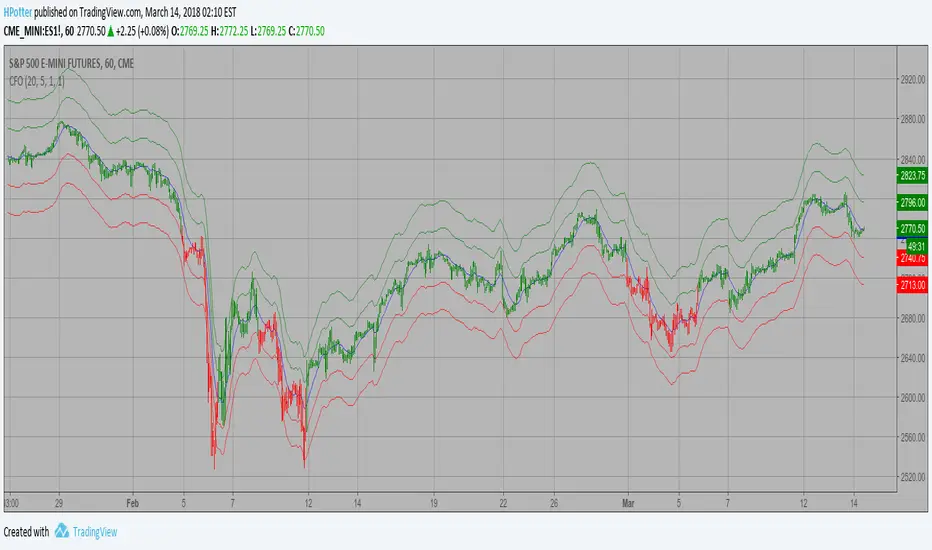
Center Of Gravity Backtest The indicator is based on moving averages. On the basis of these, the
"center" of the price is calculated, and price channels are also constructed,
which act as corridors for the asset quotations.
You can change long to short in the Input Settings
WARNING:
- For purpose educate only
- This script to change bars colors.

Center Of Gravity Strategy The indicator is based on moving averages. On the basis of these, the
"center" of the price is calculated, and price channels are also constructed,
which act as corridors for the asset quotations.