Super Indicator by Funded RelayWelcome to the Super Indicator – a cutting-edge TradingView tool built by Funded Relay. This overlay indicator fuses moving averages, RSI, MACD, Bollinger Bands, ATR volatility, multi-timeframe (MTF) divergences, and an innovative ensemble voting system to deliver high-probability signals. It's designed for traders seeking an edge in crypto, forex, stocks, or indices.Follow this guide step-by-step to install, customize, interpret, trade, and optimize for maximum benefit. Remember: No indicator guarantees profits – combine with discipline, risk management, and your strategy to turn signals into gains.Step 1: Add the Indicator to Your TradingView ChartLog into TradingView (tradingview.com) and open a chart for your preferred symbol (e.g., BTCUSDT, EURUSD, or AAPL).
Click the Indicators button (fx icon) at the top of the chart.
In the search bar, type "Super Indicator" or "Super Ind" (short title).
If it's not in the public library yet:Open the Pine Editor (bottom panel tab).
Paste the full Pine Script code provided.
Click Save and name it "Super Indicator".
Add it to your chart from My Scripts.
The indicator will overlay on your price chart, showing lines, bands, histogram, flashy labels, and a top-right dashboard table.
Benefit Tip: Start on a 15-minute or 1-hour timeframe for intraday trading, or daily for swing setups. This step takes seconds and gives you real-time insights without cluttering your chart.Step 2: Customize Inputs for Your Trading StyleOnce added, click the gear icon () next to the indicator name in the chart's legend.
Adjust these key parameters:Fast MA Length: Default 50 – shorten to 20-40 for fast markets like crypto to catch quick trends.
Slow MA Length: Default 200 – lengthen to 100-300 for slower assets like stocks to filter noise.
RSI Length/Overbought/Oversold: Default 14/70/30 – tighten to 80/20 in volatile pairs for fewer but stronger signals.
MACD Fast/Slow/Signal: Default 12/26/9 – standard works well; tweak slightly for optimization.
BB Length/Multiplier: Default 20/2.0 – increase multiplier to 2.5-3.0 in choppy conditions to widen bands.
ATR Length: Default 14 – use for volatility filters.
Higher Timeframe for Divergence: Default "D" (daily) – set to "4H" or "W" for broader context.
Click OK to apply. Save as a template for quick switches between assets.
Benefit Tip: Customization aligns the indicator with your risk tolerance. Backtest on historical data using TradingView's Bar Replay feature to find settings that boost win rates (aim for 60%+ with good R:R). This personalization can turn generic signals into tailored profit opportunities.Step 3: Understand the Visual ComponentsThe indicator is highly visual for quick decision-making:Plots:Blue line: Fast Moving Average (momentum).
Red line: Slow Moving Average (overall trend).
Purple lines: Bollinger Bands (volatility channels) – yellow fill highlights squeezes (low vol periods).
Histogram: MACD bars (green/red) – brighter colors indicate strengthening momentum.
Flashy Labels (Textdraws): STRONG BUY: Large green label below bar – high-confidence long signal.
STRONG SELL: Large red label above bar – high-confidence short/exit signal.
SQUEEZE!: Yellow center label – potential breakout incoming.
Bull Div: Small lime label below – bullish MTF divergence (reversal up).
Bear Div: Small orange label above – bearish MTF divergence (reversal down).
High Vol!: Tiny fuchsia label – volatility spike; adjust stops.
Dashboard Table (top-right black box):Rows: Trend (Bullish ↑/Bearish ↓), Momentum (Strong/Weak + RSI value), Volatility (High /Low + predicted ATR), Divergence (Bullish /Bearish /None), Signal (BUY /SELL /HOLD + vote counts).
Colors: Green for bullish, red for bearish, yellow for neutral.
Benefit Tip: Scan the dashboard first on every new candle – it's your "at-a-glance" profit radar. Labels make signals unmissable, reducing emotional trading and helping you spot setups faster than manual analysis.Step 4: Interpret Signals and Execute TradesThe core innovation is the ensemble voting system (up to 5 votes from RSI, MACD, trend, divergence, and BB squeeze):Strong Buy: ≥3 buy votes and ≤1 sell vote – enter long positions (buy or go long).
Strong Sell: ≥3 sell votes and ≤1 buy vote – enter shorts or exit longs.
Neutral/HOLD: Mixed votes – stand aside or wait for confirmation.
Enhancers:Bullish Divergence (): Price makes lower low, but higher-TF RSI makes higher low – strong reversal buy filter.
Bearish Divergence (): Opposite for sells.
BB Squeeze ( + yellow fill): Low volatility – watch for breakout direction (above basis = buy bias, below = sell).
High Volatility (): Avoid tight stops; use predicted vol (EMA of ATR) to forecast chop.
Trade Execution Checklist (to maximize profits):Confirm signal strength: Dashboard shows BUY/SELL with 3+ votes?
Check confluence: Divergence agrees? Price breaks key level/support/resistance?
Time entry: Wait for bar close to avoid repainting.
Set risk: Stop-loss below recent low (for buys) or above high (for sells); target 1:2-1:3 R:R.
Position size: Risk only 0.5-1% of account per trade.
Exit: Take partial profits at targets; trail stop on remaining.
Benefit Tip: Focus on high-vote signals (4-5 votes) for 70-80% win potential in backtests. Combine with price action (e.g., candlestick patterns) to filter false positives, turning the indicator into a profit machine. Avoid overtrading – aim for 2-5 setups/week for sustainable gains.Step 5: Set Up Alerts for Hands-Off MonitoringRight-click the indicator name in the legend → Add Alert.
Select a condition: Strong Buy, Strong Sell, BB Squeeze, Bullish Divergence, or Bearish Divergence.
Set frequency: Once Per Bar Close (reliable, no mid-bar noise).
Choose notifications: Popup, email, SMS, or webhook (integrate with Discord/Telegram bots).
Customize message: e.g., "{{ticker}} {{interval}} – Strong Buy detected! Votes: {{plot_0}}".
Test on a live or replay chart.
Benefit Tip: Alerts free up your time – get notified on mobile for entries without screen-staring. Use webhooks for auto-trading bots (e.g., via TradingView to broker APIs) to capture profits 24/7, especially in crypto.Step 6: Advanced Optimization and Profit MaximizationMulti-Timeframe Strategy: Use on a lower TF (e.g., 1H) with higher input (e.g., "D") for confluence – only trade if lower TF signal aligns with higher TF divergence.
Integration: Pair with volume indicators, Fibonacci levels, or order flow tools for extra edge.
Backtesting & Journaling: Use TradingView's Strategy Tester (convert indicator to strategy if needed) – log 100+ trades to refine settings and calculate expectancy (profits per trade).
Risk Management Rules: Never risk more than 2% total; diversify across 5-10 symbols; avoid trading during news (use vol filter).
Common Pitfalls to Avoid: Ignoring neutrals (leads to losses in chop); over-optimizing (stick to proven settings); revenge trading after losses.
Community & Updates: Share setups on t.me/fundedrelay; check for script updates to add new features.
Benefit Tip: Treat this as a business tool – consistent 1-2% weekly gains compound to 50-100% yearly returns. Paper trade first (TradingView simulator) to build confidence, then scale with real capital. Track metrics like win rate, average win/loss to iteratively improve profits.Disclaimer: This is an educational tool only. Trading involves substantial risk of loss and is not suitable for everyone. Past performance does not guarantee future results. No financial advice – use at your own risk. Funded Relay Super Indicator Owner – trade responsibly and stay funded.
Forex-trading

Asset Liquidity Meter by Funded RelayAsset Liquidity Meter by Funded Relay
This indicator estimates the liquidity of any asset by calculating the volume traded per unit of price movement (volume / (high - low)).
Higher values generally indicate better liquidity (more volume in a smaller price range → easier to enter/exit positions with less slippage).
Lower values suggest thinner liquidity (higher risk of price impact and volatility).
The indicator displays:
• Histogram: raw liquidity per bar (green = above SMA, red = below SMA)
• SMA line: smoothed liquidity trend
• Real-time info table in the top-right corner
• Built-in alert conditions
How to Use – Step by Step
1. Adding the Indicator
- Open any chart on TradingView
- Click the "Indicators" button at the top
- Search for "Asset Liquidity Meter v6" (or find it in Community Scripts / My Scripts)
- Click to add it to the chart
- It will appear in a separate pane below the price chart
2. Customizing Settings
Double-click the indicator name in the pane (or right-click → Settings):
• SMA Length (default: 14)
- Controls the smoothing period of the liquidity trend line
- Smaller values (5–10) → more responsive, good for intraday/scalping
- Larger values (20–50) → smoother trend, better for swing/position trading
• Epsilon (default: 0.00000001)
- Tiny value that prevents division-by-zero errors on flat bars (high = low)
- Almost never needs to be changed
• Colors
- High Liquidity Color: histogram bars when liquidity > SMA
- Low Liquidity Color: histogram bars when liquidity < SMA
- SMA Line Color: color of the smoothed trend line
• Show Alert Conditions in Menu
- Keep enabled (true) to see the built-in alert options when creating alerts
3. Reading & Interpreting the Indicator
• Histogram Bars (Raw Liquidity)
- Height = amount of volume per unit of price range
- Tall bars = high liquidity (market is "thick")
- Short bars = low liquidity (market is "thin")
- Green = current liquidity is stronger than the average (SMA)
- Red = current liquidity is weaker than the average
• Blue SMA Line
- Shows the average liquidity over the selected period
- Rising line → liquidity improving (more participants, easier trading)
- Falling line → liquidity decreasing (thinner market, caution advised)
• Info Table (top-right corner)
- Displays current raw liquidity, SMA value, and status ("High Liquidity" / "Low Liquidity")
- Updates in real-time on the last bar
• Zero Line (dotted gray)
- Visual reference — everything above zero is positive liquidity
4. Practical Trading Applications
• High Liquidity Zones (green bars + rising SMA)
- Favorable conditions for entering or scaling into positions
- Lower expected slippage
- Better for large orders
• Low Liquidity Zones (red bars + falling SMA)
- Higher risk of slippage and exaggerated price moves
- Consider smaller position sizes or waiting for better conditions
- Common during session opens/closes, holidays, or low-volume periods
• Crossovers
- Liquidity crossing above SMA → potential increase in market participation
- Liquidity crossing below SMA → potential drying up of interest
5. Setting Up Alerts
1. Right-click on the chart → "Add Alert"
2. In "Condition", select "Asset Liquidity Meter v6"
3. Choose one of the available alert conditions:
- Liquidity ↑ Crosses Above SMA
- Liquidity ↓ Crosses Below SMA
- Very High Liquidity (2× SMA)
- Very Low Liquidity (<30% SMA)
4. Set frequency (Once Per Bar Close is usually best)
5. Configure notification (email, popup, sound, webhook, etc.)
6. Create the alert
6. Tips for Best Results
• Works on all markets: stocks, forex, crypto, futures, indices
• Best on timeframes with meaningful volume data (5 min and higher usually give clearest signals)
• Compare liquidity across different assets or timeframes using multiple charts
• Combine with support/resistance, volume profile or order flow tools for confirmation
• Not a standalone signal — use in context with your overall strategy
Limitations & Notes
• This is an estimation based on OHLCV data — it does not show real order book depth
• Results vary significantly between centralized exchanges, brokers and instruments
• Zero-volume bars will show zero liquidity (expected behavior)
Enjoy safer and more informed trading!
Questions or suggestions? Feel free to comment below.

Session AnchorsDescription
This indicator highlights the four main global trading sessions — London, New York AM, New York PM, and Asia — as color-coded boxes on the chart. Each session is defined by fixed start/end times (New York time) and dynamically updates with the evolving high and low during that interval. This provides a clear view of how volatility and structure shift as trading activity passes from one region to another.
How to use
• Works on any timeframe.
• Toggle sessions on/off based on your trading hours.
• Observe price behavior as one session closes and another opens.
• Use session boxes as context for liquidity, volatility, and structure analysis.
Originality
This script delivers a clean, customizable visualization of global market hours and session ranges, avoiding extra overlays so traders can isolate session-based behavior without distraction.
⚠️ Disclaimer
This indicator does not generate signals. It provides a structural mapping of global sessions for contextual analysis only.


Session P4L SNIPERSsession separator only for the operation of the academy. by its time margin. added the asian range for a power of three

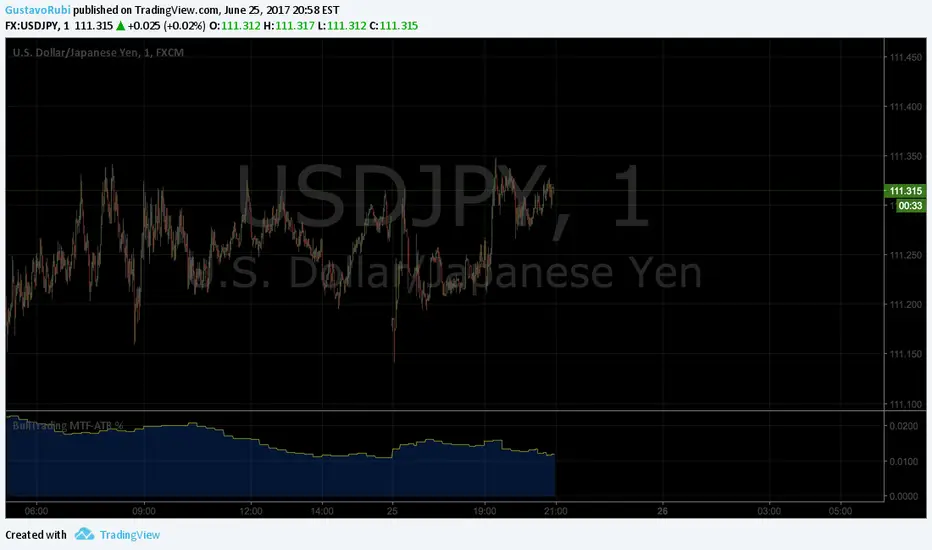
BullTrading MultiTimeFrame ATR %Good afternoon traders.
Have you ever got trapped on the middle of a consolidation? Well, it just happened to me trading the 1 minute chart last friday!
So, I coded this script to display a percentage of ATR for a given resolution.
Now, how can you benefit using this information?
For example:
Using the standard settings (resolution is calibrated 15 minutes in order to trade 1minute charts), just draw your prefered support and resistance. Then measure the number of pips between support and resistance. This number should be approximately the same the indicator is displaying. If the indicator is displaying a lower value, maybe it will be a good idea to tighten your support/resistance levels (if the price goes against you, you will have confidence and probability on your side to open an opposite position and reach your Take profit before a new reversal take place.
Change colors and resolution for your desired timeframe until you find your particular "sweet spot"
Have a nice trading week.