RSI Divergence StrategyOverview
The RSI Divergence Strategy Indicator is a trading tool that uses the RSI and divergences created to generate high-probability buy and sell signals.
I have provided the best formula of numbers to use for BTC on a 30 minute timeframe.
You can change where on RSI you enter and exit both long or short trades. This way you can experiment on different tokens using different entry/exit points. Can use on multiple timeframes.
This strategy is designed to open and close long or short trades based on the levels you provide it. You can then check on the RSI where the best levels are for each token you want to trade and amend it as required to generate a profitable strategy.
How It Works
The RSI Divergence Strategy Indicator uses bear and bull divergences in conjuction with a level you have input on the RSI.
RSI for Overbought/Oversold:
• Input variables for entry and exit levels and when the entry levels combine with a bear or bull divergence signal, a trade is alerted.
RSI Divergence:
• Buy and sell signals are confirmed when the RSI creates bearish or bullish divergences and these divergences are in the same area as your levels you input for entry to short or long.
After 7 years of experience and testing I have calculated the exact numbers required and produced a formula to calculate the exact input variables for a 30 minute Bitcoin chart.
Key Features
1️⃣ Divergence Identification – Ensures trades are taken only when a bull or bear divergence has formed.
2️⃣ Overbought/Oversold Input Filtering – Set up your own variables on the RSI for different markets after identifying patterns on the RSI in relation to a bearish or bullish divergence.
3️⃣ Works on any chart – Suitable for all markets and timeframes once you input the correct variables for entry and exit levels.
How to Use
🟢 Basic Trading:
• Use on any timeframe.
• Enter trade only when alert has fired off. Close when it says to exit.
• Change entry and exit levels in the properties of the strategy indicator.
• Make entry and exit levels coincide with bearish or bullish divergences on the RSI.
Check the strategy tester to see backtesting so you know if the indicator is profitable or not for that market and timeframe as each crypto token is different and so is the timeframe you choose.
📢 Webhook Automation:
• Set up TradingView Alerts to auto-execute trades via Webhook-compatible platforms.
Key additions for divergence visualization:
Divergence Arrows:
Bullish divergence: Green label with white 'bull ' text
Bearish divergence: Red label with white 'bear' text
Positioned at the pivot point
Divergence Lines:
Connects consecutive RSI pivot points
Automatically drawn between consecutive pivot points
Enhanced RSI Coloring:
Overbought zone: Red
Oversold zone: Green
Neutral zone: Gray
The visualization helps you instantly spot:
Where divergences are forming on the RSI
The pattern of higher lows (bullish) or lower highs (bearish)
Contextual coloring of RSI relative to standard levels
All divergence markers appear at the correct historical pivot points, making it easy to visually confirm divergence patterns as they develop.
Strategy levels and background zones also shown to help visual look.
Why This Combination?
This indicator is just a simple RSI tool.
It is designed to filter out weak trades and only execute trades that have:
✅ RSI Divergence
✅ Overbought or Oversold Conditions
It does not calculate downtrends or bear markets so care is recommended taking long trades during these times.
Why It’s Worth Using?
📈 Open Source – Free to use and learn from.
📉 Long or Short Term Trading Style – Entry/Exit parameters options are designed for both short or long term trades allowing you to experiment until you find a profitable strategy for that market you want to trade.
📢 Seamless Webhook Automation – Execute trades automatically with TradingView alerts.
💲 Ready to trade smarter?
✅ Add the RSI Divergence Strategy Indicator to your TradingView chart.
Forecasting

Golden Crossover Momentum Check📊 Golden Cross Momentum Screener — Summary
🔍 What It Does
This indicator identifies Golden Cross events — where the 50 EMA crosses above the 200 EMA, signaling a potential long-term trend reversal — and evaluates the momentum strength to help determine whether price is likely to:
Surge immediately (Group B), or
Retrace first (Group A)
It uses 5 momentum-confirming conditions to score the quality of the breakout and display a single label on the chart with a classification.
✅ Momentum Conditions Validated
RSI > 60 and rising – Indicates bullish buying pressure
MACD Histogram > 0 and rising – Confirms increasing momentum
Volume > 2× 20-day average – Validates participation on the breakout
ADX > 25 – Measures trend strength
Price is >5% above 200 EMA – Confirms price extension above long-term trend
Each passing condition adds 1 point to the momentum score (0–5).
📈 How to Use
Watch for a Golden Cross signal (triangle appears below candle)
If momentum score ≥ 4, the script labels the setup as:
"🚀 Surge Likely (Group B)" — consider immediate breakout entries
If score is 2–3, labeled:
"🔄 Pullback Likely (Group A)" — expect retest/consolidation before continuation
If score < 2, labeled:
"❌ No Momentum Confirmed" — avoid or wait for confirmation

IU Liquidity Flow TrackerDESCRIPTION
The IU Liquidity Flow Tracker is a powerful market analysis tool designed to visualize hidden buying and selling activity by analyzing price action, volume behavior, market pressure, and depth. It provides a composite view of liquidity dynamics to help traders identify accumulation, distribution, and neutral phases with high clarity.
This indicator is ideal for traders who want to gauge the flow of market participants and make informed entry/exit decisions based on the underlying liquidity structure.
USER INPUTS:
* Flow Analysis Period: Length used for analyzing price spread and volume flow.
* Pressure Sensitivity: Adjusts the sensitivity of threshold detection for flow classification.
* Flow Smoothing: Controls the smoothing applied to raw flow data.
* Market Depth Analysis: Sets the depth range for rejection and wick analysis.
* Colors: Customize colors for accumulation, distribution, neutral zones, and pressure visualization.
INDICATOR LOGIC:
The IU Liquidity Flow Tracker uses a multi-factor model to evaluate market behavior:
1. Liquidity Pressure: Combines price spread, price efficiency, and volume imbalance.
2. Flow Direction: Weighted momentum using short, medium, and long-term price changes adjusted for volume.
3. Market Depth: Wick-based rejection scoring to estimate buying/selling aggressiveness at price extremes.
4. Composite Flow Index: Blended value of flow direction, pressure, and depth—smoothed for clarity.
5. Dynamic Thresholds: Automatically adjusts based on volatility to classify the market into:
* Accumulation: Strong buying signals.
* Distribution: Strong selling signals.
* Neutral: No significant flow dominance.
6. Entry Signals: Long/Short signals are generated when flow state shifts, supported by momentum, volume surge, and depth strength.
WHY IT IS UNIQUE:
Unlike typical indicators that rely solely on price or volume, this tool combines spread behavior, volume polarity, momentum weighting, and price rejection zones into a single visual interface. It dynamically adjusts sensitivity based on market volatility, helping avoid false signals during sideways or low-volume periods.
It is not based on any traditional indicator (RSI, MACD, etc.), making it ideal for traders looking for an original and data-driven market read.
HOW USER CAN BENEFIT FROM IT:
* Understand Market Context: Know whether the market is being accumulated, distributed, or ranging.
* Improve Entries/Exits: Use flow transitions combined with volume confirmation for high-probability setups.
* Spot Institutional Activity: Detect subtle shifts in liquidity that precede major price moves.
* Reduce Whipsaws: Dynamic thresholds and multi-factor confirmation help filter noise.
* Use with Any Style: Whether you're a swing trader, day trader, or scalper, this tool adapts to different timeframes and strategies.
DISCLAIMER:
This indicator is created for educational and informational purposes only. It does not constitute financial advice or a recommendation to buy or sell any asset. All trading involves risk, and users should conduct their own analysis or consult with a qualified financial advisor before making any trading decisions. The creator is not responsible for any losses incurred through the use of this tool. Use at your own discretion.

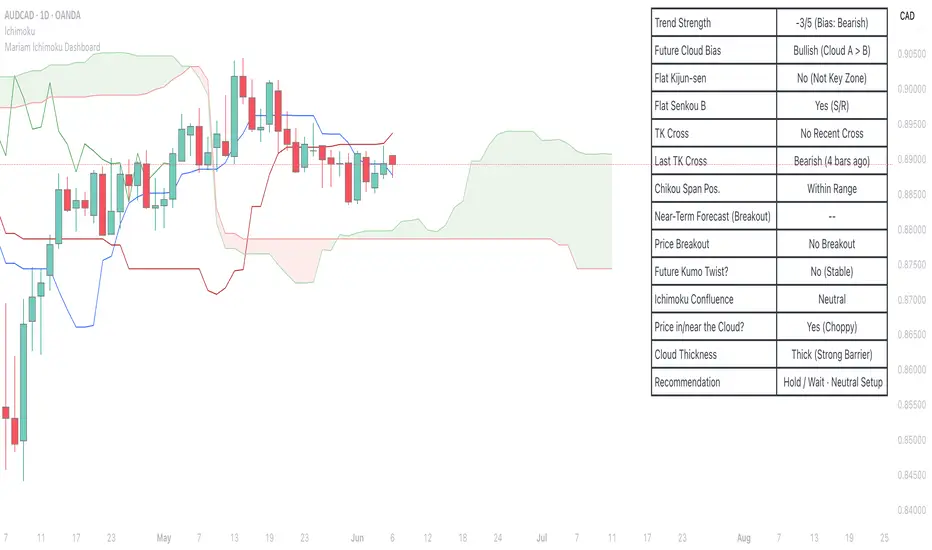
Mariam Ichimoku DashboardPurpose
The Mariam Ichimoku Dashboard is designed to simplify the Ichimoku trading system for both beginners and experienced traders. It provides a complete view of trend direction, strength, momentum, and key signals all in one compact dashboard on your chart. This tool helps traders make faster and more confident decisions without having to interpret every Ichimoku element manually.
How It Works
1. Trend Strength Score
Calculates a score from -5 to +5 based on Ichimoku components.
A high positive score means strong bullish momentum.
A low negative score shows strong bearish conditions.
A near-zero score indicates a sideways or unclear market.
2. Future Cloud Bias
Looks 26 candles ahead to determine if the future cloud is bullish or bearish.
This helps identify the longer-term directional bias of the market.
3. Flat Kijun / Flat Senkou B
Detects flat zones in the Kijun or Senkou B lines.
These flat areas act as strong support or resistance and can attract price.
4. TK Cross
Identifies Tenkan-Kijun crosses:
Bullish Cross means Tenkan crosses above Kijun
Bearish Cross means Tenkan crosses below Kijun
5. Last TK Cross Info
Shows whether the last TK cross was bullish or bearish and how many candles ago it happened.
Helps track trend development and timing.
6. Chikou Span Position
Checks if the Chikou Span is above, below, or inside past price.
Above means bullish momentum
Below means bearish momentum
Inside means mixed or indecisive
7. Near-Term Forecast (Breakout)
Warns when price is near the edge of the cloud, preparing for a potential breakout.
Useful for anticipating price moves.
8. Price Breakout
Shows if price has recently broken above or below the cloud.
This can confirm the start of a new trend.
9. Future Kumo Twist
Detects upcoming twists in the cloud, which often signal potential trend reversals.
10. Ichimoku Confluence
Measures how many key Ichimoku signals are in agreement.
The more signals align, the stronger the trend confirmation.
11. Price in or Near the Cloud
Displays if the price is inside the cloud, which often indicates low clarity or a choppy market.
12. Cloud Thickness
Shows whether the cloud is thin or thick.
Thick clouds provide stronger support or resistance.
Thin clouds may allow easier breakouts.
13. Recommendation
Gives a simple trading suggestion based on all major signals.
Strong Buy, Strong Sell, or Hold.
Helps simplify decision-making at a glance.
Features
All major Ichimoku signals summarized in one panel
Real-time trend strength scoring
Detects flat zones, crosses, cloud twists, and breakouts
Visual alerts for trend alignment and signal confluence
Compact, clean design
Built with simplicity in mind for beginner traders
Tips
Best used on 15-minute to 1-hour charts for short-term trading
Avoid entering trades when price is inside the cloud because the market is often indecisive
Wait for alignment between trend score, TK cross, cloud bias, and confluence
Use the dashboard to support your trading strategy, not replace it
Enable alerts for major confluence or upcoming Kumo twists
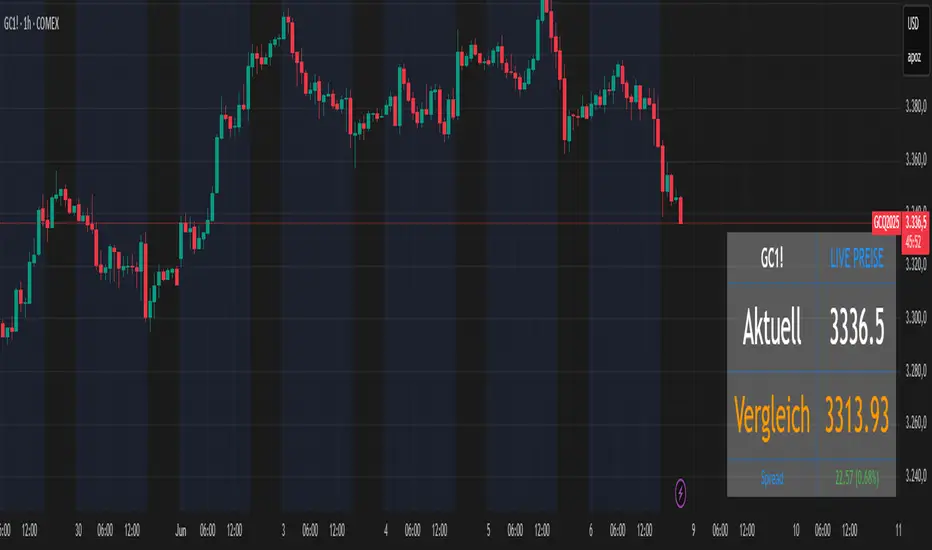
Futures vs CFD Price Display
🎯 Trading the same asset in CFDs and Futures but tired of switching charts to compare prices? This is your indicator!
Stop the constant chart hopping! This live price comparison shows you instantly where the better conditions are.
✨ What you get:
Bidirectional: Works in both Futures AND CFD charts
Live prices: Real-time comparison of both markets
Spread calculation: Automatic difference in points and percentage
Fully customizable: Colors, position, size to your liking
Professional design: Clean display with symbol header
🎯 Perfect for:
Gold traders (Futures vs CFD)
Arbitrage strategies
Spread monitoring
Multi-broker comparisons
⚙️ Customization:
3 sizes (Small/Normal/Large) for all screens
4 positions available
Individual color schemes
Toggle features on/off
💡 Simply enter the symbol and keep both markets in sight!
Notice: "Co-developed with Claude AI (Anthropic) - because even AI needs to pay the server bills! 😄"
DCA Investment Tracker Pro [tradeviZion]DCA Investment Tracker Pro: Educational DCA Analysis Tool
An educational indicator that helps analyze Dollar-Cost Averaging strategies by comparing actual performance with historical data calculations.
---
💡 Why I Created This Indicator
As someone who practices Dollar-Cost Averaging, I was frustrated with constantly switching between spreadsheets, calculators, and charts just to understand how my investments were really performing. I wanted to see everything in one place - my actual performance, what I should expect based on historical data, and most importantly, visualize where my strategy could take me over the long term .
What really motivated me was watching friends and family underestimate the incredible power of consistent investing. When Napoleon Bonaparte first learned about compound interest, he reportedly exclaimed "I wonder it has not swallowed the world" - and he was right! Yet most people can't visualize how their $500 monthly contributions today could become substantial wealth decades later.
Traditional DCA tracking tools exist, but they share similar limitations:
Require manual data entry and complex spreadsheets
Use fixed assumptions that don't reflect real market behavior
Can't show future projections overlaid on actual price charts
Lose the visual context of what's happening in the market
Make compound growth feel abstract rather than tangible
I wanted to create something different - a tool that automatically analyzes real market history, detects volatility periods, and shows you both current performance AND educational projections based on historical patterns right on your TradingView charts. As Warren Buffett said: "Someone's sitting in the shade today because someone planted a tree a long time ago." This tool helps you visualize your financial tree growing over time.
This isn't just another calculator - it's a visualization tool that makes the magic of compound growth impossible to ignore.
---
🎯 What This Indicator Does
This educational indicator provides DCA analysis tools. Users can input investment scenarios to study:
Theoretical Performance: Educational calculations based on historical return data
Comparative Analysis: Study differences between actual and theoretical scenarios
Historical Projections: Theoretical projections for educational analysis (not predictions)
Performance Metrics: CAGR, ROI, and other analytical metrics for study
Historical Analysis: Calculates historical return data for reference purposes
---
🚀 Key Features
Volatility-Adjusted Historical Return Calculation
Analyzes 3-20 years of actual price data for any symbol
Automatically detects high-volatility stocks (meme stocks, growth stocks)
Uses median returns for volatile stocks, standard CAGR for stable stocks
Provides conservative estimates when extreme outlier years are detected
Smart fallback to manual percentages when data insufficient
Customizable Performance Dashboard
Educational DCA performance analysis with compound growth calculations
Customizable table sizing (Tiny to Huge text options)
9 positioning options (Top/Middle/Bottom + Left/Center/Right)
Theme-adaptive colors (automatically adjusts to dark/light mode)
Multiple display layout options
Future Projection System
Visual future growth projections
Timeframe-aware calculations (Daily/Weekly/Monthly charts)
1-30 year projection options
Shows projected portfolio value and total investment amounts
Investment Insights
Performance vs benchmark comparison
ROI from initial investment tracking
Monthly average return analysis
Investment milestone alerts (25%, 50%, 100% gains)
Contribution tracking and next milestone indicators
---
📊 Step-by-Step Setup Guide
1. Investment Settings 💰
Initial Investment: Enter your starting lump sum (e.g., $60,000)
Monthly Contribution: Set your regular DCA amount (e.g., $500/month)
Return Calculation: Choose "Auto (Stock History)" for real data or "Manual" for fixed %
Historical Period: Select 3-20 years for auto calculations (default: 10 years)
Start Year: When you began investing (e.g., 2020)
Current Portfolio Value: Your actual portfolio worth today (e.g., $150,000)
2. Display Settings 📊
Table Sizes: Choose from Tiny, Small, Normal, Large, or Huge
Table Positions: 9 options - Top/Middle/Bottom + Left/Center/Right
Visibility Toggles: Show/hide Main Table and Stats Table independently
3. Future Projection 🔮
Enable Projections: Toggle on to see future growth visualization
Projection Years: Set 1-30 years ahead for analysis
Live Example - NASDAQ:META Analysis:
Settings shown: $60K initial + $500/month + Auto calculation + 10-year history + 2020 start + $150K current value
---
🔬 Pine Script Code Examples
Core DCA Calculations:
// Calculate total invested over time
months_elapsed = (year - start_year) * 12 + month - 1
total_invested = initial_investment + (monthly_contribution * months_elapsed)
// Compound growth formula for initial investment
theoretical_initial_growth = initial_investment * math.pow(1 + annual_return, years_elapsed)
// Future Value of Annuity for monthly contributions
monthly_rate = annual_return / 12
fv_contributions = monthly_contribution * ((math.pow(1 + monthly_rate, months_elapsed) - 1) / monthly_rate)
// Total expected value
theoretical_total = theoretical_initial_growth + fv_contributions
Volatility Detection Logic:
// Detect extreme years for volatility adjustment
extreme_years = 0
for i = 1 to historical_years
yearly_return = ((price_current / price_i_years_ago) - 1) * 100
if yearly_return > 100 or yearly_return < -50
extreme_years += 1
// Use median approach for high volatility stocks
high_volatility = (extreme_years / historical_years) > 0.2
calculated_return = high_volatility ? median_of_returns : standard_cagr
Performance Metrics:
// Calculate key performance indicators
absolute_gain = actual_value - total_invested
total_return_pct = (absolute_gain / total_invested) * 100
roi_initial = ((actual_value - initial_investment) / initial_investment) * 100
cagr = (math.pow(actual_value / initial_investment, 1 / years_elapsed) - 1) * 100
---
📊 Real-World Examples
See the indicator in action across different investment types:
Stable Index Investments:
AMEX:SPY (SPDR S&P 500) - Shows steady compound growth with standard CAGR calculations
Classic DCA success story: $60K initial + $500/month starting 2020. The indicator shows SPY's historical 10%+ returns, demonstrating how consistent broad market investing builds wealth over time. Notice the smooth theoretical growth line vs actual performance tracking.
MIL:VUAA (Vanguard S&P 500 UCITS) - Shows both data limitation and solution approaches
Data limitation example: VUAA shows "Manual (Auto Failed)" and "No Data" when default 10-year historical setting exceeds available data. The indicator gracefully falls back to manual percentage input while maintaining all DCA calculations and projections.
MIL:VUAA (Vanguard S&P 500 UCITS) - European ETF with successful 5-year auto calculation
Solution demonstration: By adjusting historical period to 5 years (matching available data), VUAA auto calculation works perfectly. Shows how users can optimize settings for newer assets. European market exposure with EUR denomination, demonstrating DCA effectiveness across different markets and currencies.
NYSE:BRK.B (Berkshire Hathaway) - Quality value investment with Warren Buffett's proven track record
Value investing approach: Berkshire Hathaway's legendary performance through DCA lens. The indicator demonstrates how quality companies compound wealth over decades. Lower volatility than tech stocks = standard CAGR calculations used.
High-Volatility Growth Stocks:
NASDAQ:NVDA (NVIDIA Corporation) - Demonstrates volatility-adjusted calculations for extreme price swings
High-volatility example: NVIDIA's explosive AI boom creates extreme years that trigger volatility detection. The indicator automatically switches to "Median (High Vol): 50%" calculations for conservative projections, protecting against unrealistic future estimates based on outlier performance periods.
NASDAQ:TSLA (Tesla) - Shows how 10-year analysis can stabilize volatile tech stocks
Stable long-term growth: Despite Tesla's reputation for volatility, the 10-year historical analysis (34.8% CAGR) shows consistent enough performance that volatility detection doesn't trigger. Demonstrates how longer timeframes can smooth out extreme periods for more reliable projections.
NASDAQ:META (Meta Platforms) - Shows stable tech stock analysis using standard CAGR calculations
Tech stock with stable growth: Despite being a tech stock and experiencing the 2022 crash, META's 10-year history shows consistent enough performance (23.98% CAGR) that volatility detection doesn't trigger. The indicator uses standard CAGR calculations, demonstrating how not all tech stocks require conservative median adjustments.
Notice how the indicator automatically detects high-volatility periods and switches to median-based calculations for more conservative projections, while stable investments use standard CAGR methods.
---
📈 Performance Metrics Explained
Current Portfolio Value: Your actual investment worth today
Expected Value: What you should have based on historical returns (Auto) or your target return (Manual)
Total Invested: Your actual money invested (initial + all monthly contributions)
Total Gains/Loss: Absolute dollar difference between current value and total invested
Total Return %: Percentage gain/loss on your total invested amount
ROI from Initial Investment: How your starting lump sum has performed
CAGR: Compound Annual Growth Rate of your initial investment (Note: This shows initial investment performance, not full DCA strategy)
vs Benchmark: How you're performing compared to the expected returns
---
⚠️ Important Notes & Limitations
Data Requirements: Auto mode requires sufficient historical data (minimum 3 years recommended)
CAGR Limitation: CAGR calculation is based on initial investment growth only, not the complete DCA strategy
Projection Accuracy: Future projections are theoretical and based on historical returns - actual results may vary
Timeframe Support: Works ONLY on Daily (1D), Weekly (1W), and Monthly (1M) charts - no other timeframes supported
Update Frequency: Update "Current Portfolio Value" regularly for accurate tracking
---
📚 Educational Use & Disclaimer
This analysis tool can be applied to various stock and ETF charts for educational study of DCA mathematical concepts and historical performance patterns.
Study Examples: Can be used with symbols like AMEX:SPY , NASDAQ:QQQ , AMEX:VTI , NASDAQ:AAPL , NASDAQ:MSFT , NASDAQ:GOOGL , NASDAQ:AMZN , NASDAQ:TSLA , NASDAQ:NVDA for learning purposes.
EDUCATIONAL DISCLAIMER: This indicator is a study tool for analyzing Dollar-Cost Averaging strategies. It does not provide investment advice, trading signals, or guarantees. All calculations are theoretical examples for educational purposes only. Past performance does not predict future results. Users should conduct their own research and consult qualified financial professionals before making any investment decisions.
---
© 2025 TradeVizion. All rights reserved.

Previous Two Days HL + Asia H/L + 4H Vertical Lines📊 Indicator Overview
This custom TradingView indicator visually marks key market structure levels and session data on your chart using lines, labels, boxes, and vertical guides. It is designed for traders who analyze intraday and multi-session behavior — especially around the New York and Asia sessions — with a focus on 4-hour price ranges.
🔍 What the Indicator Tracks
1. Previous Two Days' Ranges (6PM–5PM NY Time)
PDH/PDL (Day 1 & Day 2): Draws horizontal lines marking the previous two trading days’ highs and lows.
Midlines: Calculates and displays the midpoint between each day’s high and low.
Color-Coded: Uses strong colors for Day 1 and more transparent versions for Day 2, to help differentiate them.
2. Asia Session High/Low (6 PM – 2 AM NY Time)
Automatically tracks the high and low during the Asia session.
Extends these levels until the following day’s NY close (4 PM).
Shows a midline of the Asia session (optional dotted line).
Highlights the Asia session background in gray.
Labels Asia High and Low on the chart for easy reference.
3. Last Closed 4-Hour Candle Range
At the start of every new 4H candle, it:
Draws a box from the last closed 4H candle.
Box spans horizontally across a set number of bars (adjustable).
Top and bottom lines indicate the high and low of that 4H candle.
Midline, 25% (Q1) and 75% (Q3) levels are also drawn inside the box using dotted lines.
Helps traders identify premium/discount zones within the previous 4H range.
4. Vertical 4H Time Markers
Draws vertical dashed lines to mark the start and end of the last 4H candle range.
Based on the standard 4H bar timing in NY (e.g. 5:00, 9:00, 13:00, 17:00).
⚙️ Inputs & Options
Line thickness, color customization for all levels.
Option to place labels on the right or left side of the chart.
Toggle for enabling/disabling the 4H box.
Adjustable box extension length (how far to extend the range visually).
✅ Ideal Use Cases
Identifying reaction zones from prior highs/lows.
Spotting reversals during Asia or NY session opens.
Trading intraday setups based on 4H structure.
Anchoring scalping or swing entries off major session levels.

Session Status Table📌 Session Status Table
Session Status Table is an indicator that displays the real-time status of the four major trading sessions:
* 🇯🇵 Asia (Tokyo)
* 🇬🇧 London
* 🇺🇸 New York AM
* 🇺🇸 New York PM
It shows which sessions are currently open, how much time remains until they open or close, and optionally sends alerts in advance.
🧩 Features:
* Real-time session table — shows the status of each session on the chart.
* Color-coded statuses:
* 🟢 Green – Session is open
* 🔴 Red – Session is closed
* ⚪ Gray – Weekend
* Countdown timers until session open or close.
* User alerts — receive a notification a custom number of minutes before a session starts.
⚙️ Customization:
* Table position — fully configurable.
* Session colors — customizable for open, closed, and weekend states.
* Session labels — customizable with icons.
* Notifications:
* Enabled through TradingView's Alerts panel.
* User-defined lead time before session opens.
🕒 Time Zones:
All times are calculated in UTC to ensure consistency across different markets and regions, avoiding discrepancies from time zones and daylight saving time.
🚨 How to enable alerts:
1. Open the "Alerts" panel in TradingView.
2. Click "Create Alert".
3. In the condition dropdown, choose "Session Status Table".
4. Set to any alert() trigger.
5. Save — you'll be notified a set number of minutes before each session begins.
ℹ️ Technical Notes:
* Built with Pine Script version 6.
* Logically divided into clear sections: inputs, session calculations, table rendering, and alerts.
* Optimized for performance and reliability on all timeframes.
Ideal for traders who use session activity in their strategies — especially in Forex, crypto, and futures markets.

QG-Particle OscillatorThis is an advanced oscillator based on auxiliary particle filter. It separates signal from noise and uses smoothing algorithm similar to JMA.
The main oscillator line is a smoothed and detrended version of the price series similar to detrended oscillator line. The purple/aqua lines are a prediction based on an additional adaptive smoothing technique and current volatility.
The prediction is smoothed twice and is supposed to represent the true signal without any noise, thus the prediction should always be less than the raw detrend line. However, certain volatile conditions will cause the prediction to cross above/below the detrend line. When this happens the likelihood of a reversal or pullback is extremely high.
There are 3 dots on the zero line- Red, Green and Yellow. The yellow dots warn of an eminent pullback 2 bars before it actually occurs. This is a non-repainting indicator.
One can also use this indicator to trade CCI signals, similar to zero line rejection in existing trend.
The indicator has 2 settings- Period and Phase. The phase represents cycle phase and Period represents oscillator period.
Credits: This indicator has been originally published for Ninjatrader and this is conversion into pinescript.

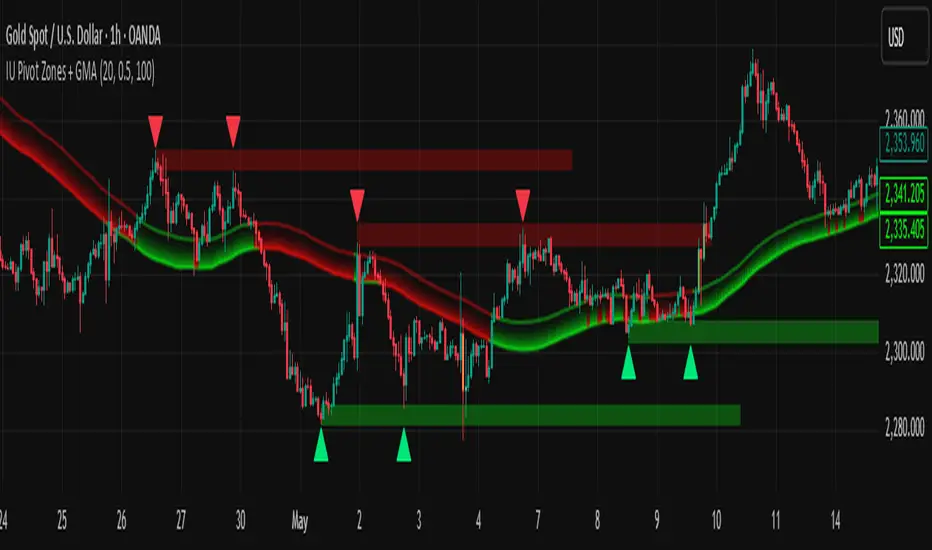
IU Pivot Zones + GMADESCRIPTION:
IU Pivot Zones + GMA is a smart price-action-based indicator that detects meaningful support and resistance zones formed through pivot highs/lows while combining them with dynamic zone generation and Geometric Moving Averages (GMA). This tool is built to help traders visualize institutional breakout/rejection zones with clear, logical mapping and live box management — helping you stay ahead of the move.
The indicator is designed for intraday, swing, and positional traders who want to enhance their trading decisions with visual confluence zones and market structure logic.
USER INPUTS
* Pivot point Lengths: Number of bars used to detect pivot highs/lows
* Zone length: Controls the thickness of the support/resistance zone; higher values create wider zones
* GMA Length: Period for calculating the geometric moving averages based on highs and lows
* Allow Bar/candle Color: Enables or disables special candle coloring when price interacts with the zones
LOGIC OF THE INDICATOR:
* Detects pivot highs and pivot lows using the user-defined length
* Compares consecutive pivot levels to determine if they fall within a valid ATR-based price band to form a zone
* If confirmed, the indicator dynamically plots a resistance or support box between those pivot points, colored respectively (red for resistance, green for support)
* The boxes update in real-time based on price action. If price respects the zone, the box extends forward. If price breaks the zone, the box disappears
* Geometric Moving Averages (GMA) based on logarithmic mean of highs and lows are plotted to offer a trend bias
* Candles that touch the top of the support zone are colored yellow, and those touching the bottom of the resistance zone are orange, enhancing zone reaction visibility
WHY IT IS UNIQUE:
* Uses logarithmic-based GMAs, which are smoother and less reactive than traditional moving averages
* ATR-based zone logic makes it adaptive to volatility instead of using fixed-width zones
* Combines structural levels (pivots), volatility filters (ATR), and trend overlays (GMA) in one unified tool
* Real-time zone extension and disappearance logic based on price interaction
HOW USER CAN BENEFIT FROM IT:
* Spot high-probability breakout or reversal zones that price respects consistently
* Use the GMA cloud for trend confirmation — for example, bullish bias when price is above both GMAs
* Build price action strategies around zone touches, breakouts, or rejections
* Use color-coded candles as real-time alerts for potential entry/exit signals near S/R levels
* Save time by avoiding manual marking of zones on charts across timeframes
DISCLAIMER:
This indicator is created for educational and informational purposes only. It does not constitute financial advice or a recommendation to buy or sell any asset. All trading involves risk, and users should conduct their own analysis or consult with a qualified financial advisor before making any trading decisions. The creator is not responsible for any losses incurred through the use of this tool. Use at your own discretion.
Last Week's APM & Daily % Move(Corrected)Last Week's Average Price Movement + Daily Percentage Move (based on NY time)
This indicator accurately displays last week's Average Pip Movement (APM) consistently across all timeframes and tracks the true daily percentage move relative to that APM in a clear table in the top-right corner.
Key Features:
-Consistent Last Week's APM: Calculates the average pip movement from Monday to Friday of the previous trading week (based on daily wick-to-wick ranges, divided by 5). This APM value is now stable and the same across all chart timeframes.
-Accurate Live Daily % Move: Tracks the maximum percentage the price has moved (either up or down) since the 5 PM New York time daily open, compared to last week's APM. The percentage holds the maximum value reached during the day and resets at the next 5 PM NY open.
-NY Time Alignment: All time-based calculations are aligned with the New York time zone
Pip Adjustment: Automatically adjusts for JPY pairs.
⚠️ Important: For the intended display and relevance of the daily percentage move, this indicator is best used on timeframes 4-hour and under. On Daily and Weekly timeframes, the APM display will show a message indicating this.
We hope this indicator enhances your trading analysis.

COT-Index-NocTradingCOT Index Indicator
The COT Index Indicator is a powerful tool designed to visualize the Commitment of Traders (COT) data and offer insights into market sentiment. The COT Index is a measurement of the relative positioning of commercial traders versus non-commercial and retail traders in the futures market. It is widely used to identify potential market reversals by observing the extremes in trader positioning.
Customizable Timeframe: The indicator allows you to choose a custom time interval (in months) to visualize the COT data, making it flexible to fit different trading styles and strategies.
How to Use:
Visualize Market Sentiment: A COT Index near extremes (close to 0 or 100) can indicate potential turning points in the market, as it reflects extreme positioning of different market participant groups.
Adjust the Time Interval: The ability to adjust the time interval (in months) gives traders the flexibility to analyze the market over different periods, which can be useful in detecting longer-term trends or short-term shifts in sentiment.
Combine with Other Indicators: To enhance your analysis, combine the COT Index with your technical analysis.
This tool can serve as an invaluable addition to your trading strategy, providing a deeper understanding of the market dynamics and the positioning of major market participants.

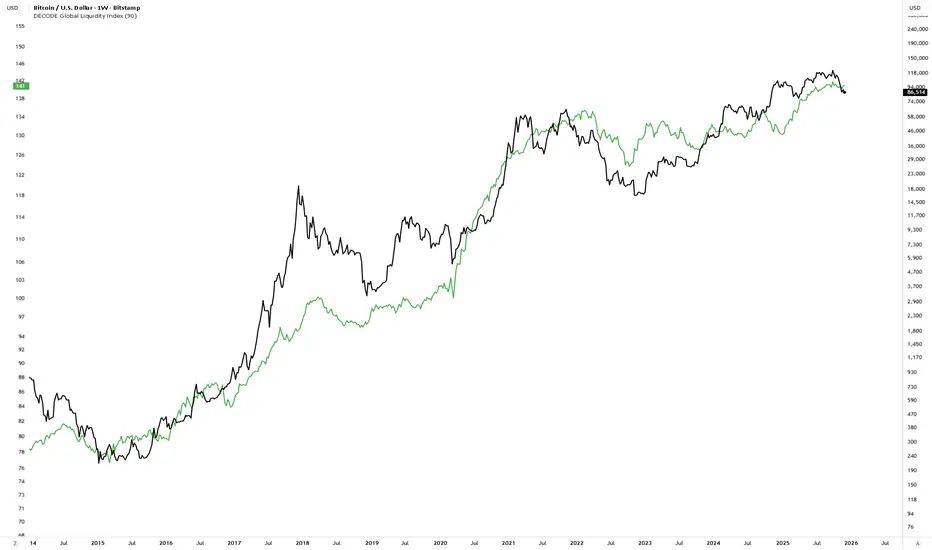
DECODE Global Liquidity IndexDECODE Global Liquidity Index 🌊
The DECODE Global Liquidity Index is a powerful tool designed to track and aggregate global liquidity by combining data from the world's 13 largest economies. It offers a comprehensive view of financial liquidity, providing crucial insights into the underlying currents that can influence asset prices and market trends.
The economies covered are: United States, China, European Union, Japan, India, United Kingdom, Brazil, Canada, Russia, South Korea, Australia, Mexico, and Indonesia. The European Union accounts for major individual economies within the EU like Germany, France, Italy, Spain, Netherlands, Poland, etc.
Key Features:
1. Customizable Liquidity Sources
Include Global M2: You can opt to include the M2 money supply from the 13 listed economies. M2 is a broad measure of money supply that includes cash, checking deposits, savings deposits, money market securities, mutual funds, and other time deposits. (Note: Australia uses M3 as its primary measure, which is included when M2 is selected for Australia).
Include Central Bank Balance Sheets (CBBS): Alternatively, or in addition, you can include the total assets held by the central banks of these economies. Central bank balance sheets expand or contract based on monetary policy operations like quantitative easing (QE) or tightening (QT).
Combined View: If you select both M2 and CBBS, and data is available for both, the indicator will display an average of the two aggregated values. If only one source type is selected, or if data for one type is unavailable despite both being selected, the indicator will display the single available and selected component. This provides flexibility in how you define and analyze global liquidity.
2. Lead/Lag Analysis (Forward Projection):
Lead Offset (Days): This feature allows you to project the liquidity index forward by a specified number of days.
Why it's useful: Global liquidity changes can often be a leading indicator for various asset classes, particularly those sensitive to risk appetite, like Bitcoin or growth stocks. These assets might lag shifts in liquidity. By applying a lead (e.g., 90 days), you can shift the liquidity data forward on your chart to more easily visualize potential correlations and identify if current asset price movements might be responding to past changes in liquidity.
3. Rate of Change (RoC) Oscillator:
Year-over-Year % View: Instead of viewing aggregate liquidity, you can switch to a Year-over-Year (YoY%) Rate of Change (ROC) oscillator.
Why it's useful:
Momentum Identification: The ROC highlights the speed and direction of liquidity changes. Positive values indicate liquidity is increasing compared to a year ago, while negative values show it's decreasing.
Turning Points: Oscillators make it easier to spot potential accelerations, decelerations, or reversals in liquidity trends. A cross above the zero line can signal strengthening liquidity momentum, while a cross below can signal weakening momentum.
Cycle Analysis: It helps in assessing the cyclical nature of liquidity provision and its potential impact on market cycles.
This indicator aims to provide a clear, customizable, and insightful measure of global liquidity to aid traders and investors in their market analysis.
Momentum Fusion v1Momentum Fusion v1
Overview
Momentum Fusion v1 (MFusion) is a multi-oscillator indicator that combines several components to analyze market momentum and trend strength. It incorporates modified versions of classic indicators such as PVI (Positive Volume Index), NVI (Negative Volume Index), MFI (Money Flow Index), RSI, Stochastic, and Bollinger Bands Oscillator. The indicator displays a histogram that changes color based on momentum strength and includes "FUSION🔥" signal labels when extreme values are reached.
Indicator Settings
Parameters:
EMA Length – Smoothing period for the moving average (default: 255).
Smoothing Period – Internal calculation smoothing parameter (default: 15).
BB Multiplier – Standard deviation multiplier for Bollinger Bands (default: 2.0).
Show verde / marron / media lines – Toggles the display of auxiliary lines.
Show FUSION🔥 label – Enables/disables signal labels.
Indicator Components
1. PVI (Positive Volume Index)
Formula:
pvi := volume > volume ? nz(pvi ) + (close - close ) / close * sval : nz(pvi )
Description:
PVI increases when volume rises compared to the previous bar and accounts for price percentage change. The stronger the price movement with increasing volume, the higher the PVI value.
2. NVI (Negative Volume Index)
Formula:
nvi := volume < volume ? nz(nvi ) + (close - close ) / close * sval : nz(nvi )
Description:
NVI tracks price movements during declining volume. If the price rises on low volume, it may indicate a "stealth" trend.
3. Money Flow Index (MFI)
Formula:
100 - 100 / (1 + up / dn)
Description:
An oscillator measuring money flow strength. Values above 80 suggest overbought conditions, while values below 20 indicate oversold conditions.
4. Stochastic Oscillator
Formula:
k = 100 * (close - lowest(low, length)) / (highest(high, length) - lowest(low, length))
Description:
A classic stochastic oscillator showing price position relative to the selected period's range.
5. Bollinger Bands Oscillator
Formula:
(tprice - BB midline) / (upper BB - lower BB) * 100
Description:
Indicates the price position relative to Bollinger Bands in percentage terms.
Key Lines & Histogram
1. Verde (Green Line)
Calculation:
verde = marron + oscp (normalized PVI)
Interpretation:
Higher values indicate stronger bullish momentum. A FUSION🔥 signal appears when the value reaches 750+.
2. Marron (Brown Line)
Calculation:
marron = (RSI + MFI + Bollinger Osc + Stochastic / 3) / 2
Interpretation:
A composite oscillator combining multiple indicators. Higher values suggest overbought conditions.
3. Media (Red Line)
Calculation:
media = EMA of marron with smoothing period
Interpretation:
Acts as a signal line for trend confirmation.
4. Histogram
Calculation:
histo = verde - marron
Colors:
Bright green (>100) – Strong bullish momentum.
Light green (>0) – Moderate bullish momentum.
Orange (<0) – Bearish momentum.
Red (<-100) – Strong bearish momentum.
Signals & Alerts
1. FUSION🔥 (Strong Momentum)
Condition:
verde >= 750
Visualization:
A "FUSION🔥" label appears below the chart.
Alert:
Can be set to trigger notifications when the condition is met.
2. Background Aura
Condition:
verde > 850
Visualization:
The chart background turns teal, indicating extreme momentum.
Usage Recommendations
FUSION🔥 Signal – Can be used as a long entry point when confirmed by other indicators.
Histogram:
1. Green bars – Potential long entry.
2. Red/orange bars – Potential short entry.
3. Media & Marron Crossover – Can serve as an additional trend filter.
4. Suitable for a 5-15 minute time frame
Conclusion
Momentum Fusion v1 is a powerful tool for momentum analysis, combining multiple indicators into a unified system. It is suitable for:
Trend traders (catching strong movements).
Scalpers (identifying short-term impulses).
Swing traders (filtering entry points).
The indicator features customizable settings and visual signals, making it adaptable to various trading styles.

Price Statistical Strategy-Z Score V 1.01
Price Statistical Strategy – Z Score V 1.01
Overview
A technical breakdown of the logic and components of the “Price Statistical Strategy – Z Score V 1.01”.
This script implements a smoothed Z-Score crossover mechanism applied to the closing price to detect potential statistical deviations from local price mean. The strategy operates solely on price data (close) and includes signal spacing control and momentum-based candle filters. No volume-based or trend-detection components are included.
Core Methodology
The strategy is built on the statistical concept of Z-Score, which quantifies how far a value (closing price) is from its recent average, normalized by standard deviation. Two moving averages of the raw Z-Score are calculated: a short-term and a long-term smoothed version. The crossover between them generates long entries and exits.
Signal Conditions
Entry Condition:
A long position is opened when the short-term smoothed Z-Score crosses above the long-term smoothed Z-Score, and additional entry conditions are met.
Exit Condition:
The position is closed when the short-term Z-Score crosses below the long-term Z-Score, provided the exit conditions allow.
Signal Gapping:
A minimum number of bars (Bars gap between identical signals) must pass between repeated entry or exit signals to reduce noise.
Momentum Filter:
Entries are prevented during sequences of three or more consecutively bullish candles, and exits are prevented during three or more consecutively bearish candles.
Z-Score Function
The Z-Score is calculated as:
Z = (Close - SMA(Close, N)) / STDEV(Close, N)
Where N is the base period selected by the user.
Input Parameters
Enable Smoothed Z-Score Strategy
Enables or disables the Z-Score strategy logic. When disabled, no trades are executed.
Z-Score Base Period
Defines the number of bars used to calculate the simple moving average and standard deviation for the Z-Score. This value affects how responsive the raw Z-Score is to price changes.
Short-Term Smoothing
Sets the smoothing window for the short-term Z-Score. Higher values produce smoother short-term signals, reducing sensitivity to short-term volatility.
Long-Term Smoothing
Sets the smoothing window for the long-term Z-Score, which acts as the reference line in the crossover logic.
Bars gap between identical signals
Minimum number of bars that must pass before another signal of the same type (entry or exit) is allowed. This helps reduce redundant or overly frequent signals.
Trade Visualization Table
A table positioned at the bottom-right displays live PnL for open trades:
Entry Price
Unrealized PnL %
Text colors adapt based on whether unrealized profit is positive, negative, or neutral.
Technical Notes
This strategy uses only close prices — no trend indicators or volume components are applied.
All calculations are based on simple moving averages and standard deviation over user-defined windows.
Designed as a minimal, isolated Z-Score engine without confirmation filters or multi-factor triggers.

MTF - Quantum Fibonacci ATR/ADR Levels & Targets V_2.0# Quantum Fibonacci Wave Mechanics v2.0 Release Notes
## 🚀 New Features
- Added multi-timeframe alert system for buy/sell signals
- Implemented dynamic label management with price values
- New mid-level trigger option for additional signals
- New EMA trigger option for confirmation signals
- Signal bar highlighting option
- Customizable line widths for all levels
## 🎨 Visual Improvements
- Completely redesigned label system (left-aligned with offsets)
- More intuitive input organization
- Better color customization options
## ⚙️ Technical Upgrades
- Upgraded to Pine Script v6
- Reduced repainting with stricter confirmation checks
- Optimized performance with proper variable initialization
## ⚠️ Note for Existing Users
- Some color parameters have been renamed
- Label positioning has changed (now with configurable offset)
- Review new mid-level trigger option in strategy settings
## 🐛 Bug Fixes
- Fixed potential repainting issues in signal generation
- Improved label cleanup between periods
- More robust security function implementation
## ⚠️ Caution for Mid-Level & EMA Signals
- Mid-Level Reversals may trigger premature entries in ranging markets.
- EMA crossovers can lag; confirm with price action.

CAFX Liquidity Pro V1CAFX Liquidity Pro Indicator
Precision Engineered for Smart Profit-Taking
The CAFX Liquidity Pro Indicator is a powerful trading tool designed to help traders pinpoint high-probability liquidity zones, making it ideal for setting accurate and strategic take profit levels. By identifying where institutional interest is likely to reside, this indicator highlights the areas where price is most likely to react, reverse, or pause—giving you the edge in locking in profits before the market shifts.
Whether you're scalping, day trading, or swing trading, the CAFX Liquidity Pro provides clear visual cues that simplify your decision-making process and enhance your trade management. With a focus on precision and reliability, it helps you avoid emotional exits and instead base your take profits on real market behavior and liquidity dynamics.
Use CAFX Liquidity Pro to stay one step ahead—because knowing where to exit is just as important as knowing when to enter.

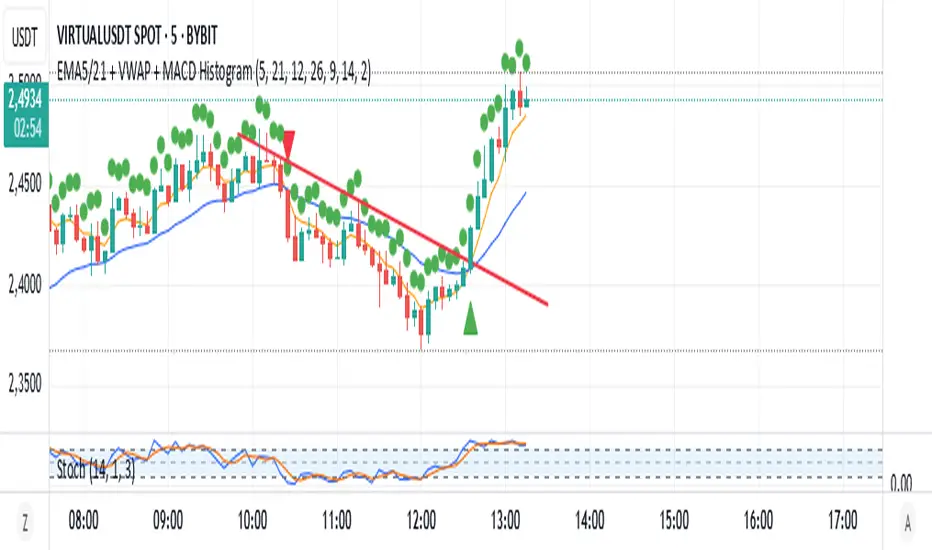
EMA5/21 + VWAP + MACD HistogramScript Summary: EMA + VWAP + MACD + RSI Strategy
Objective: Combine multiple technical indicators to identify market entry and exit opportunities, aiming to increase signal accuracy.
Indicators Used:
EMAs (Exponential Moving Averages): Periods of 5 (short-term) and 21 (long-term) to identify trend crossovers.
VWAP (Volume Weighted Average Price): Serves as a reference to determine if the price is in a fair value zone.
MACD (Moving Average Convergence Divergence): Standard settings of 12, 26, and 9 to detect momentum changes.
RSI (Relative Strength Index): Period of 14 to identify overbought or oversold conditions.
Entry Rules:
Buy (Long): 5-period EMA crosses above the 21-period EMA, price is above VWAP, MACD crosses above the signal line, and RSI is above 40.
Sell (Short): 5-period EMA crosses below the 21-period EMA, price is below VWAP, MACD crosses below the signal line, and RSI is below 60.
Exit Rules:
For long positions: When the 5-period EMA crosses below the 21-period EMA or MACD crosses below the signal line.
For short positions: When the 5-period EMA crosses above the 21-period EMA or MACD crosses above the signal line.
Visual Alerts:
Buy and sell signals are highlighted on the chart with green (buy) and red (sell) arrows below or above the corresponding candles.
Indicator Plotting:
The 5 and 21-period EMAs, as well as the VWAP, are plotted on the chart to facilitate the visualization of market conditions.
This script is a versatile tool for traders seeking to combine multiple technical indicators into a single strategy. It can be used across various timeframes and assets, allowing adjustments according to the trader's profile and market characteristics.
Juliano Einhardt Ulguim, Brazil, 05/27/2025.
Parabolic-Fibonacci MA ForecastThis indicator displays a series of projected price levels based on Fibonacci moving averages. For each selected Fibonacci period, it calculates a simple moving average (SMA) and mirrors the distance from the current price to that SMA in the opposite direction, creating a vertical forecast distance. These forecast distances are drawn forward into the future using geometric spacing (squared increments: 1², 2², 3², etc.), creating a fan-like or polyline visual structure.
Users can choose between three display modes:
Fan: Lines drawn from the current price to projected values at increasing intervals
Polyline: Forecast points connected to form a jagged projection path
Both: Displays both fan and polyline structures simultaneously
Options are provided to adjust the number of Fibonacci lines (up to 12), line width, and colors for lines above/below price or up/down slope.
This tool can help visualize directional price tendencies using multiple SMA-based forecasts in a spatially meaningful layout.

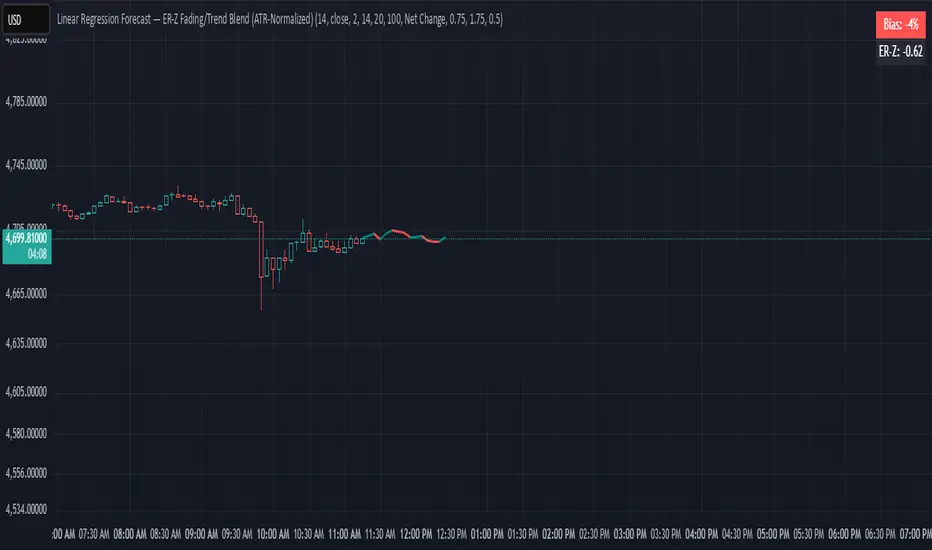
Linear Regression ForecastDescription:
This indicator computes a series of simple linear regressions anchored at the current bar, using look-back windows from 2 bars up to the user-defined maximum. Each regression line is projected forward by the same number of bars as its look-back, producing a family of forecast endpoints. These endpoints are then connected into a continuous polyline: ascending segments are drawn in green, and descending segments in red.
Inputs:
maxLength – Maximum number of bars to include in the longest regression (minimum 2)
priceSource – Price series used for regression (for example, close, open, high, low)
lineWidth – Width of each line segment
Calculation:
For each window size N (from 2 to maxLength):
• Compute least-squares slope and intercept over the N most recent bars (with bar 0 = current bar, bar 1 = one bar ago, etc.).
• Project the regression line to bar_index + N to obtain the forecast price.
Collected forecast points are sorted by projection horizon and then joined:
• First segment: current bar’s price → first forecast point
• Subsequent segments: each forecast point → next forecast point
Segment colors reflect slope direction: green for non-negative, red for negative.
Usage:
Apply this overlay to any price chart. Adjust maxLength to control the depth and reach of the forecast fan. Observe how shorter windows produce nearer-term, more reactive projections, while longer windows yield smoother, more conservative forecasts. Use the colored segments to gauge the overall bias of the fan at each step.
Limitations:
This tool is for informational and educational purposes only. It relies on linear regression assumptions and past price behavior; it does not guarantee future performance. Users should combine it with other technical or fundamental analyses and risk management practices.
Range Progress TrackerRANGE PROGRESS TRACKER(RPT)
PURPOSE
This indicator helps traders visually and statistically understand how much of the typical price range (measured by ATR) has already been covered in the current period (Daily, Weekly, or Monthly). It includes key features to assist in trend exhaustion analysis, reversal spotting, and smart alerting.
CORE LOGIC
The indicator calculates the current range of the selected time frame (e.g., Daily), which is:
Current Range = High - Low
This is then compared to the ATR (Average True Range) of the same time frame, which represents the average price movement range over a defined period (default is 14).
The comparison is expressed as a percentage, calculated with this formula:
Range % = (Current Range / ATR) × 100
This percentage shows how much of the “average expected move” has already occurred.
WHY IT MATTERS
When the current range approaches or exceeds 100% of ATR, it means the price has already moved as much as it typically does in a full session.
This indicates a lower probability of continuing the trend with a new high or low, especially when the price is already near the session's high or low.
This setup can signal:
A possible consolidation phase
A reversal in trend
The market entering a corrective phase
SMART ALERTS
The indicator can alert you when:
A new high is made after the range percentage exceeds your set threshold.
A new low is made after the range percentage exceeds your set threshold.
You can adjust the Range % Alert Threshold in the settings to tailor it to your trading style.

Tangent Extrapolation ForecastTangent Extrapolation Forecast
This indicator visually projects price direction by drawing a smoothed sequence of tangent lines based on recent price movements. For each bar in a user-defined lookback window, it calculates the slope over a smoothing period and extends the projected price forward. The resulting polyline forecast connect the endpoints of the extrapolations, and is color-coded to reflect directional changes: green for upward moves, red for downward, and gray for flat segments. This tool can assist traders in visualizing short-term momentum and potential trend continuity without introducing artificial future gaps.
Inputs:
Bars to Use: Number of historical bars used in the forecast.
Slope Smoothing Window: The number of bars used to calculate slope for projection.
Source: Price input for calculations (default is close).
This indicator does not generate buy/sell signals. It is intended as a visual aid to support discretionary analysis.

H2-25 cuts (bp)This custom TradingView indicator tracks and visualizes the implied pricing of Federal Reserve rate cuts in the market, specifically for the second half of 2025. It does so by comparing the price differences between two specific Fed funds futures contracts: one for June 2025 and one for December 2025. These contracts are traded on the Chicago Board of Trade (CBOT) and are a widely-used market gauge of the expected path of U.S. interest rates.
The indicator calculates the difference between the implied rates for June and December 2025, and then multiplies the result by 100 to express it in basis points (bps). Each 0.01 change in the spread corresponds to a 1-basis point change in expectations for future rate cuts. A positive value indicates that the market is pricing in a higher likelihood of one or more rate cuts in 2025, while a negative value suggests that the market expects the Fed to hold rates steady or even raise them.
The plot represents the difference in implied rate cuts (in basis points) between the two contracts:
June 2025 (ZQM2025): A contract representing the implied Fed funds rate for June 2025.
December 2025 (ZQZ2025): A contract representing the implied Fed funds rate for December 2025.
