FII and DII Data
Greetings to All of you.
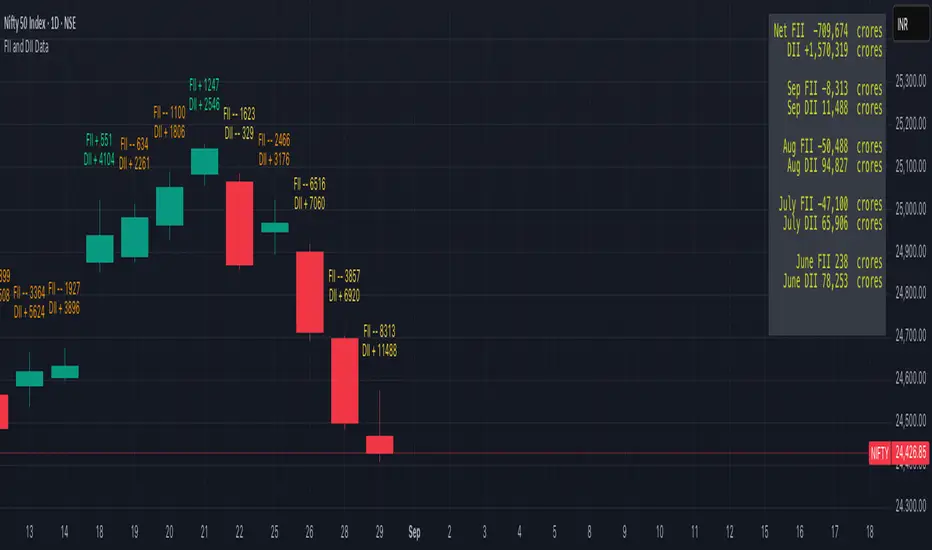
The script is plotting FII & DII activity of buying or selling on Daily TimeFrame of Nifty Spot.
Will display only on Nifty 50 Spot on Daily TimeFrame . Codes are hardcoded because novice to PineScripting.
Data is collected from NSE website on daily basis, it's an manual process.
Observation:
Start date of observation is 16th Nov., 2021. FII bought worth 14,240 & kept buying for next 2 days & bought stocks worth 17,760 crores. But market kept falling as we can see in the chart.
Now FII's started selling & in next 5 days they sold stocks worth 18,698 crores. What makes sense from this is might have cut their losses early. FII's kept selling & Nifty made an low of 16410.
FII had sold stocks worth -21,954 crores.
FII are negative & the top green box which you see is FII & DII activity from 19th Oct 2021 when Nifty Spot made an High of 18604.45.
As of 14th Jan.,2022 they are still Negative & DII are extremely positive.
NOTE: DII have not sold any thing yet. They are PLUS +74,428 Crore . Now if they start selling we need to take care of our portfolio.
Hope the information might help in someway.
Take Care & Stay Safe why because Health is Wealth.
PS: If you have any better way to improve the hard coded codes please enlighten. Thank you in advance