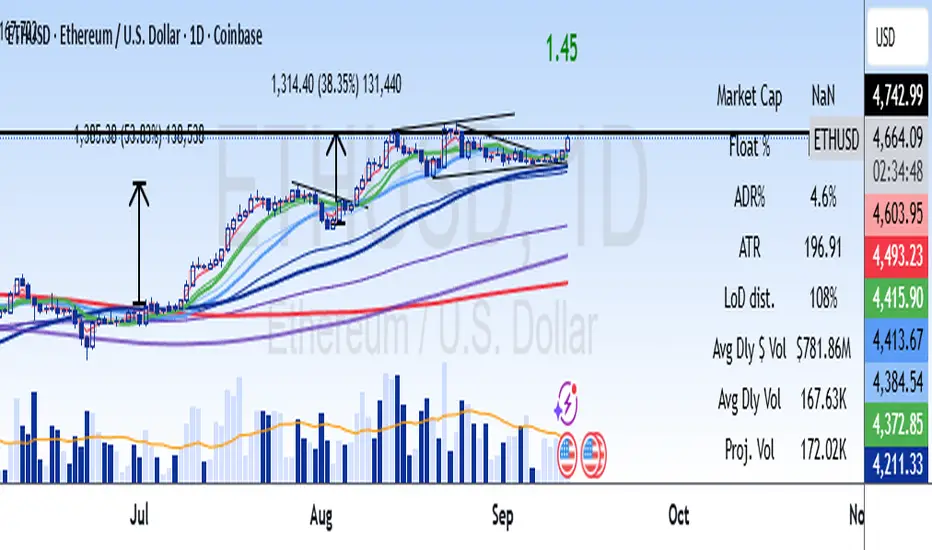
Distance from 50 SMA in ADR TermsIndicator produces a multiple of ADR% from the 50-day simple moving average to determine is a stock or etf is extended.
Extensions
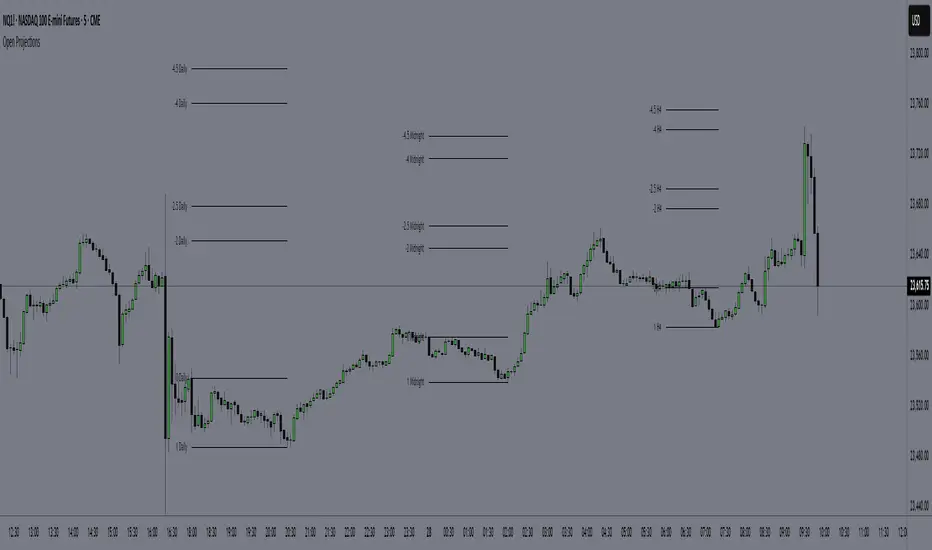
Time-Based Manipulation ProjectionsThis indicator automatically plots custom projection levels based on session and timeframe opening prices, utilizing the AMD/PO3 concept (Accumulation, Manipulation, Distribution / Power of Three). The theory suggests that price typically opens, creates an initial manipulation move to hunt liquidity, then reverses for distribution.
By measuring the distance from the open to the initial high/low manipulation, the indicator projects potential targets and reversal zones at customizable ratios, with the 2-2.5x and 4-4.5x extensions often serving as key areas.
Features:
Session-Based Projections: 4 custom session-based projections with full control over the opening time and the time when the projections stop updating with new manipulation highs/lows (Midnight, Daily, NY Open, etc)
Timeframe-Based Projections: 4 custom timeframe-based projections (H1, H4, Daily, Weekly, etc.)
Dynamic Anchoring: In line with AMD/PO3 logic, the indicator automatically locks to the correct manipulation leg (high or low) based on price position relative to the open
Custom Projections: Define your own projection levels
Custom Labels: Assign your own names to each projection, making it easy to identify and organize levels on the chart
Historical Levels: Option to display past projections
Styling Options: Choose line style, thickness, colors, label size, font, and positioning
Extend Lines: Option to extend projections forward to current price
Delayed Plotting: Set a delay (in minutes) after open before projections appear, useful to avoid false early swings
Note: These projections are most effective when the manipulation leg is clean and well-defined. If the manipulation is shallow, standard projections like 2–2.5x or 4–4.5x may not provide useful levels. In such cases, try experimenting with larger custom projections.
IB + ExtensionsInitial Balance with Extensions.
Other traders have posted similar indicators. I wrote my own because I wanted additional features.
Features:
Supports up to 9 extensions. Default = 3.
Each extension is filled using an automatic gradient. Fill can be disabled if you like.
IB levels extend into the future to the end of the current session.
By default only the current IB levels are shown, but you can enable past IB's as well.
When showing past IB's, each session has a clean break - no awkward lines connecting one session to the other (this really annoyed me about other IB indicators!)
The IB midpoint is also supported. It is on by default, but can be disabled.
You may notice the midpoint of past IB's looks different than the current IB . There is a technical reason for this that I won't go into here. Ask if you want the full explanation.
NOTE: This indicator was designed for the crypto charts. It may have some rendering issues when used with other markets.

IB+ [Intromoto] Hey traders,
This is a script that calculates the Initial Balance , which is the range of the first hour per trading session/day.
The pink and green lines are the high and respective low extension multiples, up to x12 the IB .
White line in the center is the middle of the IB , and the orange lines above and below are the 1/4 and 3/4 fractions of the IB .
IB is filled black to make the IB a bit more obvious.
The IB can be used to determine the direction/trend of price intraday or for swing trades.
S/R or pivot levels often occur at current or past IB extensions.
Reuploaded for code protection and for further edits.

Support/Resistance Zones x3Support and Resistance Levels + Zones for 3 time frames, based on volume at fractal levels with Zones based on wick size which is a true reflection of a Zone when compared to other S/R Zone scripts which only use a thick line not based on anything.
Original script is thanks to synapticex I have just migrated to version 3, heavily modified it and added Support and Resistance Zones.

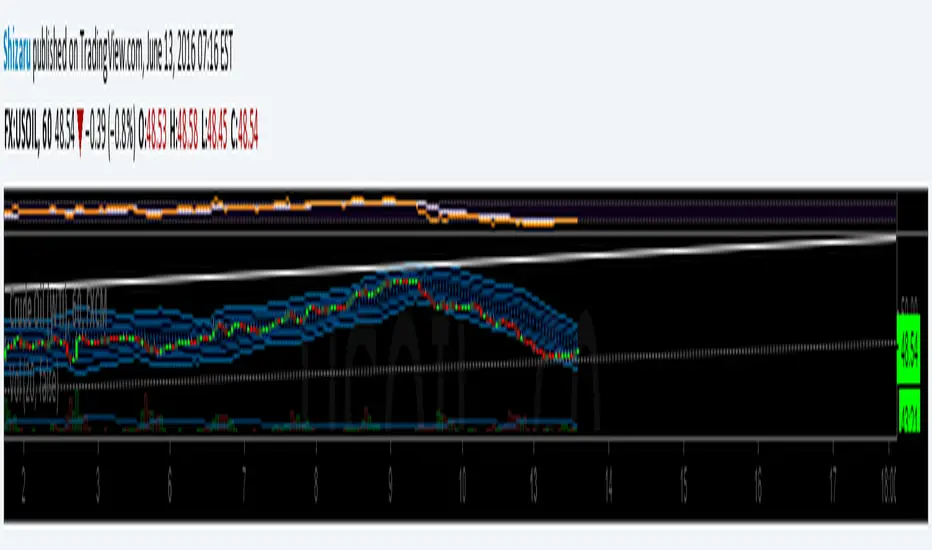
Bollinger Bands Fibonacci ratiosThe Fibonacci Bollinger Bands indicator is based on the same principles as the standard Bollinger Bands indicator developed by John Bollinger. The Fibonacci Bollinger Bands indicator bases its upper and lower bands on volatility just like the Bollinger Bands indicator does, but instead of using standard deviation as the measure of volatility, a Wilders Smoothed ATR is used in its place.
The middle band is a moving average used to establish the intermediate-term trend. The 3 upper bands are constructed by using the Wilders Smoothed ATR and multiplying it by each of the Fibonacci factors (1.618, 2.618, and 4.236) and then adding the results to the middle band. The 3 lower bands are constructed in the same manner as the upper bands except their results are subtracted from the middle band.