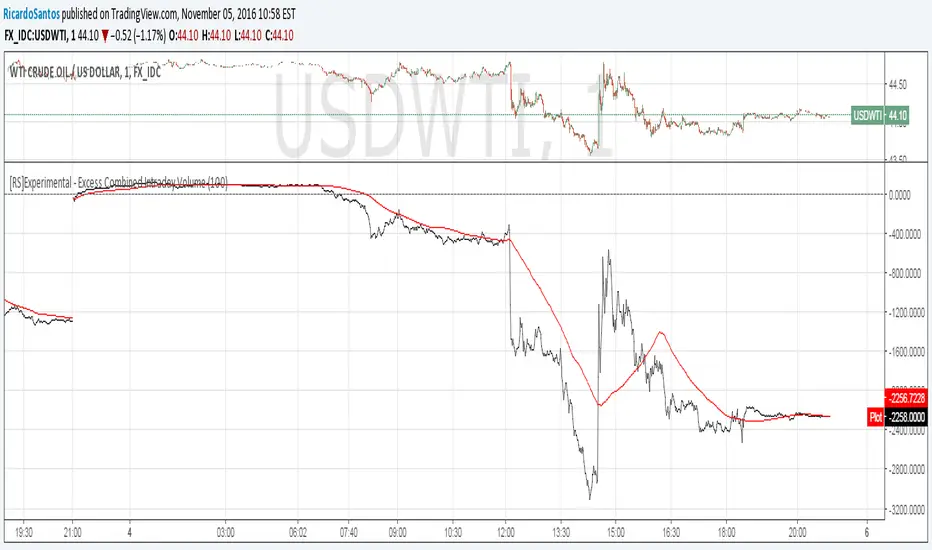
[RS]Experimental - Excess Combined Intraday VolumeEXPERIMENTAL:
Use at your discretion.
A different way to look at volume information from a time flowing perspective.
Experimental
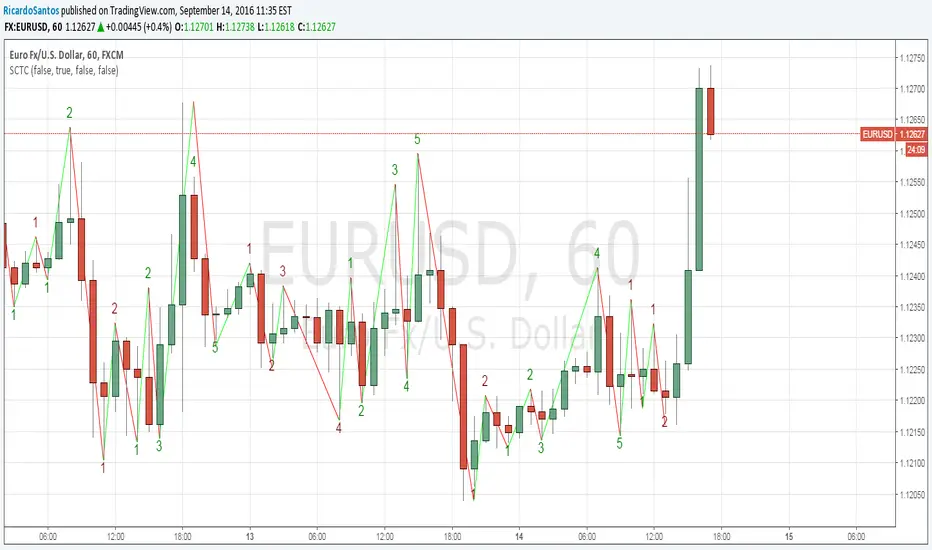
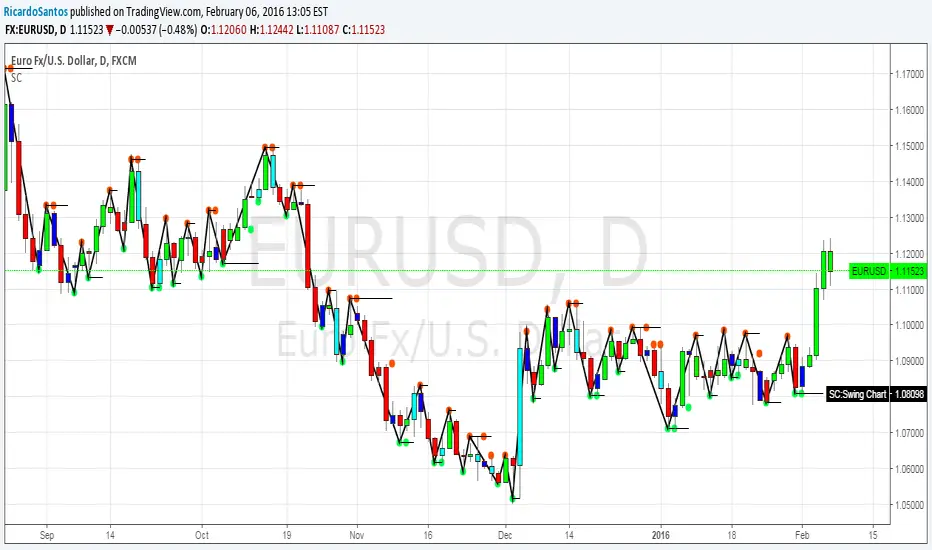
[RS]Swing Charts V0 Trend Counter V0EXPERIMENTAL:
wave counting using swing charts, use at your own discretion.
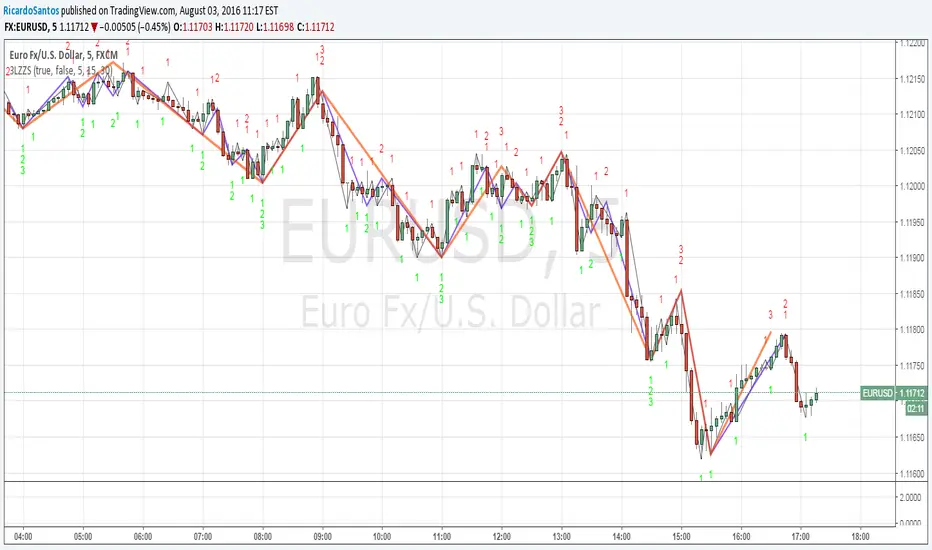
[RS]3 Level ZigZag Semafor V0EXPERIMENTAL:
request for CharanTejaM
zigzag may be adjusted to use other methods.
zigzag repaints, use at your own discretion.
[RS]Volatility Explosive Measure V0EXPERIMENTAL:
Measures the volatility range of current price range, can help detect squeezes as well explosive moves

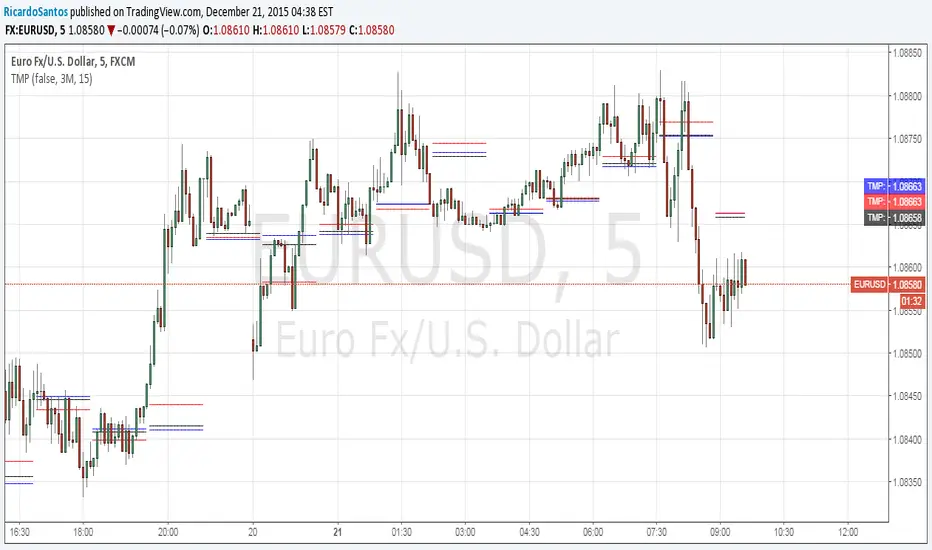
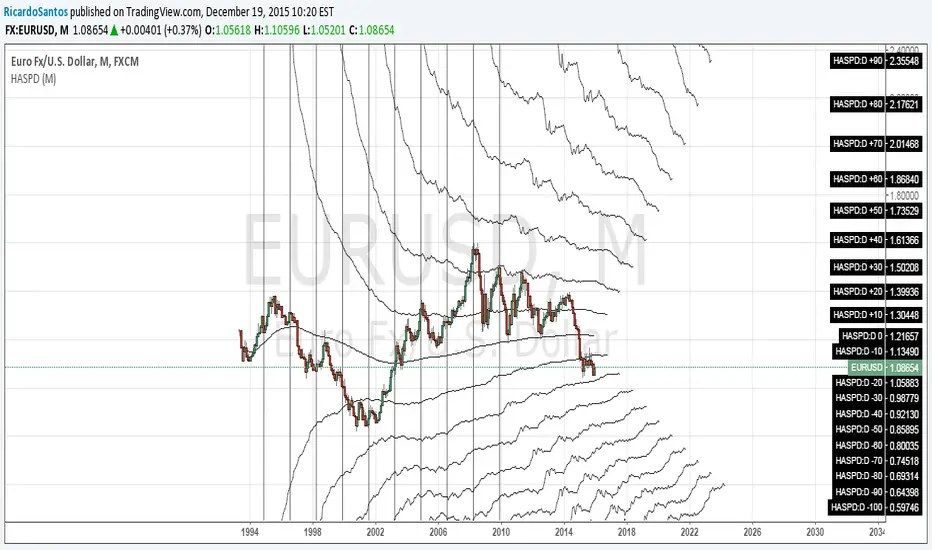
[RS]Time Based Thermal Support and Resistance V0EXPERIMENTAL:
theres a bug where certain dates dont work for the loop, returning a out of index error, please review..


[RS]Temporal Median Price V1EXPERIMENTAL: previous custom time window median price and current time window open price in a neat package :p
(JeanLouisHardy) added option for bar count system, also added a donchian average.
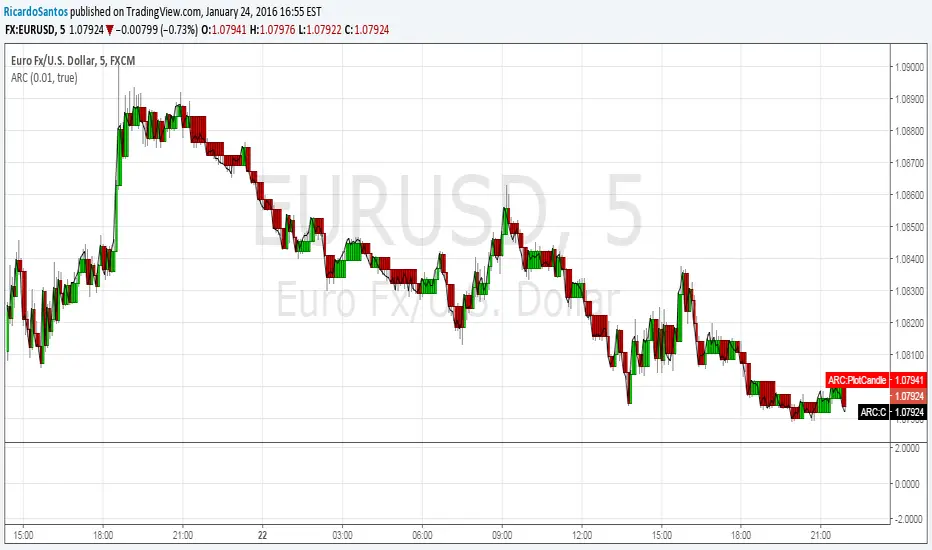
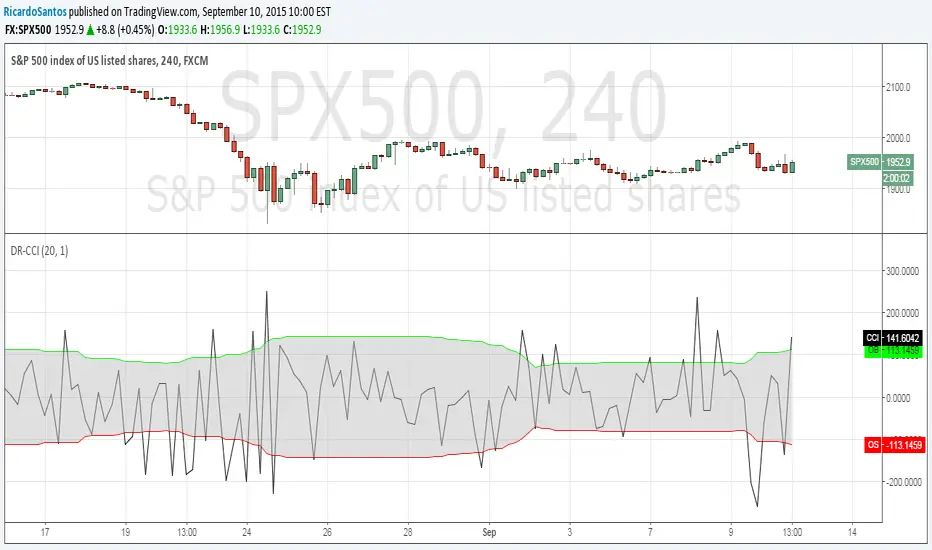
[RS]Linear Regression Bull and Bear Power Accumulation V1EXPERIMENTAL:
Bull and Bear power based on linear regression (this is a non lagging oscillator, the parameter are for the lookup window for the donchian extremes)
this indicator can also be used for convergence/divergence.
(accidentjev2) added multi timeframe support (indicator may repaint values)


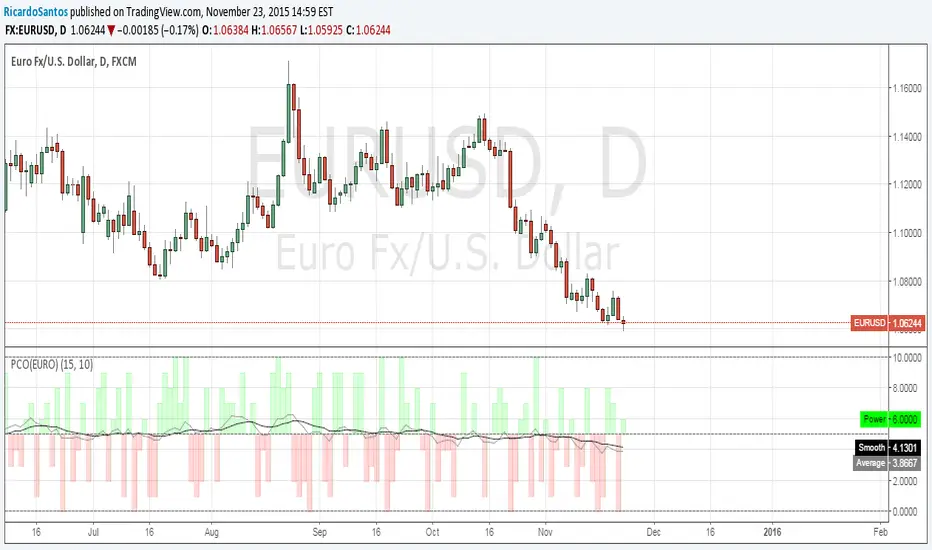
[RS]Power Correlation Oscillator (EURO) V1EXPERIMENTAL:
Added Smoother avg for a better visualization of the trending strength.
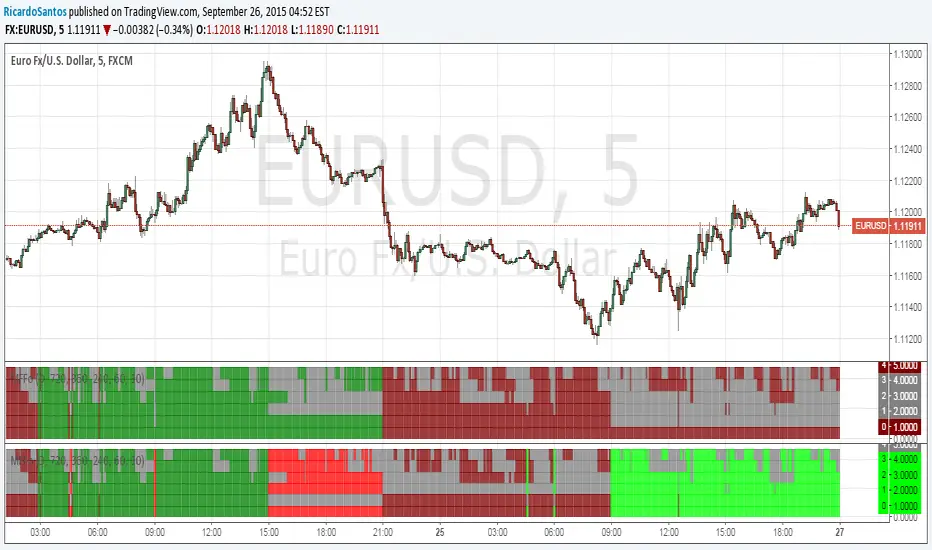
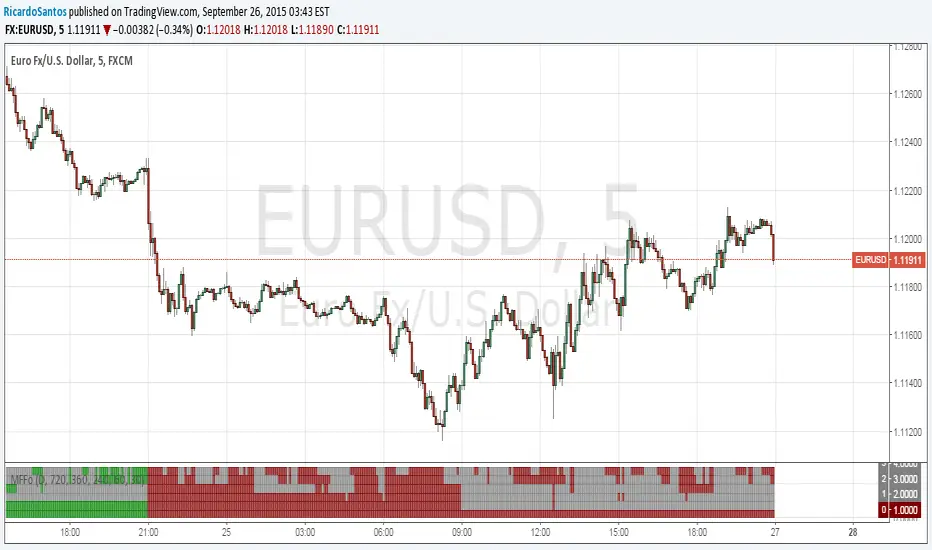
[RS]Market Fractility Flow Oscillator V0EXPERIMENTAL:
same as MTF-BIAS. but slightly more practical, reads market fractality flow into a oscillator.
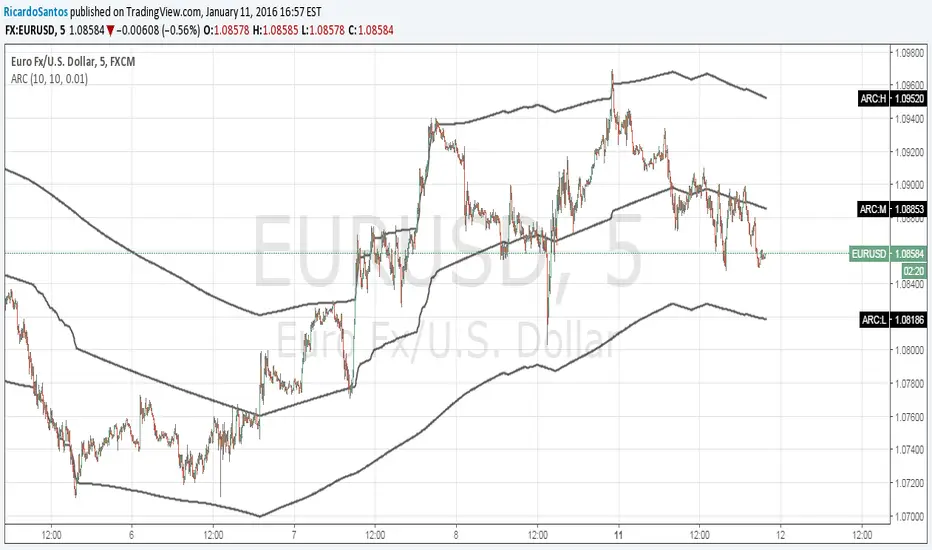
[RS]Linear Regression Bands V2EXPERIMENTAL:
added titles to inputs and plots for better understanding what is what(DCC)
M = middle, T = top, B = bottom, S = signal.


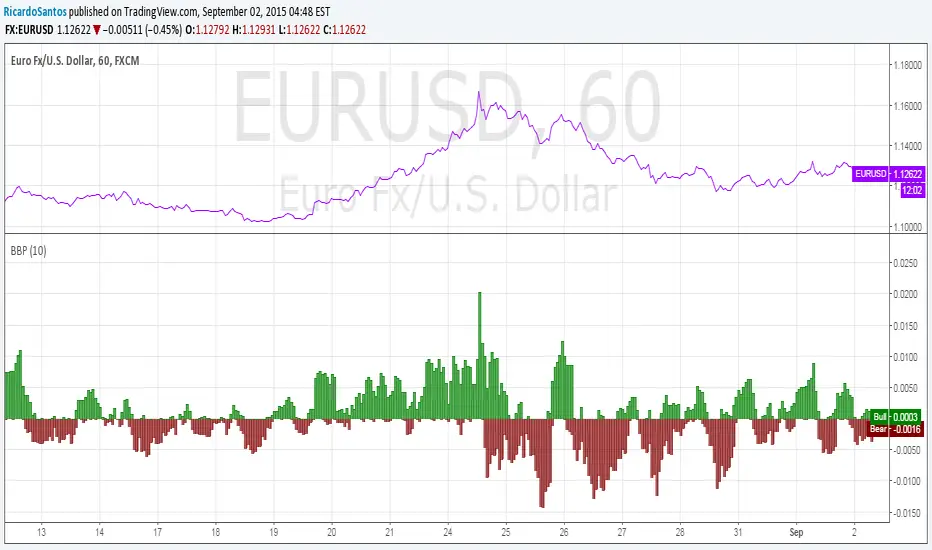
[RS]Linear Regression Bull and Bear Power V0EXPERIMENTAL:
Bull and Bear power based on linear regression (this is a non lagging oscillator, the parameter are for the lookup window for the donchian extremes)
this indicator can also be used for convergence/divergence.
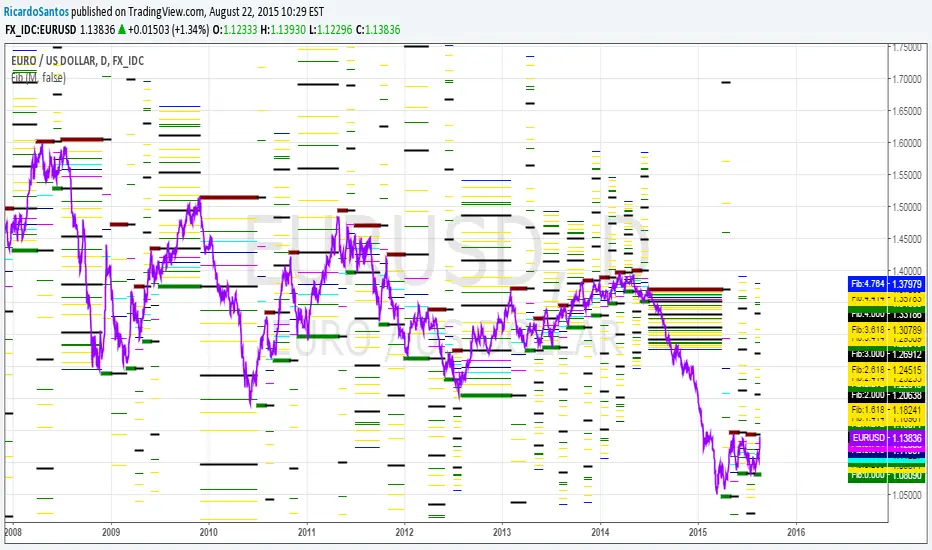
[RS]MTF Fibonacci Cycles V0EXPERIMENTAL:
Fibonacci rate levels based on price advance/decline, can be used to make visualizations of fib clusters or for cycles.
[RS]Timed Percentual Change V0EXPERIMENTAL: time based percentual change.
note: each series uses it self as base reference so there's a bit a divergence.

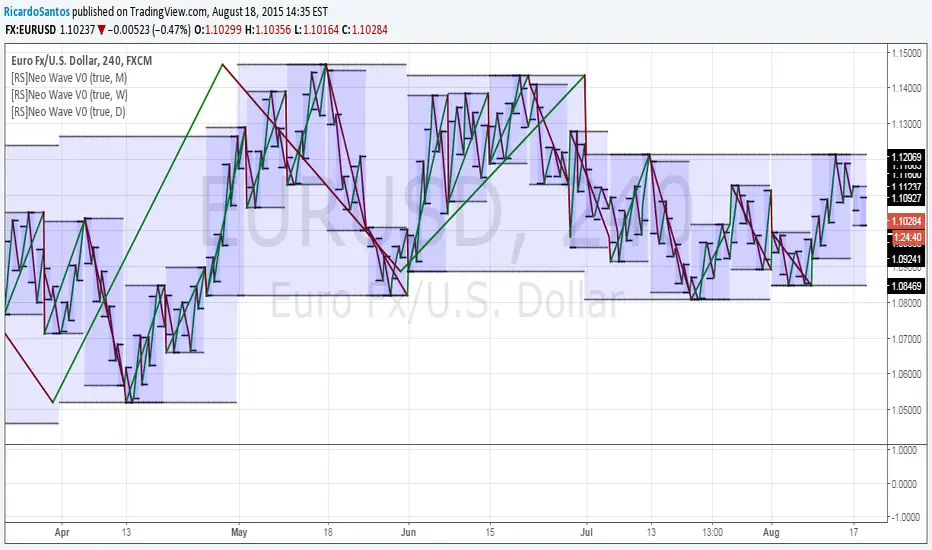
[RS]Neo Wave V0EXPERIMENTAL: Request for IvanLabrie.
Method for reading Neo Wave's.
note: some issues arent possible to work around/fix due to limitations in pinescript.