Stock Fundamental Performance:EPS and Revenue growth [Dots3Red]This indicator provides a clear and intuitive overview of a company’s revenue and EPS growth, helping you quickly evaluate its financial performance over time.
All data is displayed in a clean, easy-to-read table below the main chart, so you can analyze fundamentals without cluttering price action.
The indicator supports both annual and quarterly data, making it suitable for long-term investors and short-term traders alike.
In addition to raw values, it also shows the percentage change relative to the previous period, allowing you to instantly identify acceleration or deceleration in growth.
To improve visual clarity:
Green values indicate an increase compared to the previous period
Red values indicate a decrease compared to the previous period
This color-coded system makes trend changes immediately visible at a glance.
How to use
By default, the table displays annual data for the last 5 years, offering a long-term perspective on company growth.
You can switch to quarterly data in the settings for a more granular analysis.
Limitations
Due to Pine Engine data request constraints, quarterly data is limited to a maximum lookback of 5 years.
Selecting a longer quarterly period may cause the data to appear out of chronological order. We are actively working on improvements to address this in future updates.
EPS

Fundamentals [AletheiaTradeLab]This indicator adds a fundamentals layer to your chart around earning events:
1. EPS YoY % and Sales YoY %
On earnings dates you’ll see two percentages:
- EPS YoY % = how much this quarter’s earnings per share changed vs the same quarter last year
- Sales YoY % = how much this quarter’s revenue changed vs the same quarter last year
2. Acceleration highlight
A visual highlight appears when YoY results have been improving for several events in a row (you decide how many).
3. Next earnings countdown
The indicator marks the next earnings date on the chart and shows:
Countdown = days remaining (Today if it’s the current day)
Use it to quickly see how close the next earnings catalyst is while you’re charting.
4. Fundamentals table (ratings + quality metrics + pass/fail).
Ratings are computed using formulas I built and run locally. The values displayed here are updated weekly (and may be updated more frequently during earnings season). They are independent interpretations inspired by publicly available concepts from Mike Webster, William O’Neil, and IBD, and are not official IBD ratings.
A table on-chart that can show (you choose the rows):
- Market cap
- EPS Rating (1–99)
A percentile-style score that ranks a stock’s earnings strength versus the tracked universe.
It blends four components:
EPS YoY (Last quarter)
EPS YoY (Prior quarter)
EPS growth rate (5Y, fallback to 3Y if 5Y is missing)
Earnings Stability (lower volatility scores better)
Higher is better. A stock with 90 is roughly stronger than ~90% of the universe on this composite.
- Sales Rating (1–99)
Same idea as EPS Rating, but focused on revenue growth quality.
It blends:
Sales YoY (Last quarter)
Sales YoY (Prior quarter)
Sales growth rate (5Y, fallback to 3Y)
Sales Stability (lower volatility scores better)
- SMR Rating (1–99)
A profitability + quality rating inspired by the classic “SMR” concept.
It combines four pillars:
Sales growth (avg of last 3 quarters) + whether sales are accelerating
After-tax margin (recent/avg) + whether margins are improving
Pre-tax margin (FY) + whether it’s improving
ROE (FY) + whether it’s improving
- Earnings / Sales stability
- EPS / Sales growth rates (3Y / 5Y)
- Profit margins and ROE
- Optional pass/fail dots based on thresholds you set.

Momentum Trading Fundamental Screener- by ParthibThis indicator adds a fundamentals dashboard directly on your price chart, so you can see key business performance numbers without leaving the chart.
It displays a compact table that can be placed in any corner of the chart and customized (text size, colors, and which columns are shown). The table shows recent periods of EPS, Sales (Revenue), and Profit Margin %, along with their percentage changes (QoQ if you choose quarterly, YoY if you choose yearly).
It also optionally prints small labels under candles whenever new EPS or Sales data appears, showing the percentage change at that report point (with “EPS” or “SALES” written inside the label).

Quarterly Earnings - YOY ATH and QOQ HIGHHere is a comprehensive and professional description suitable for publishing your script on TradingView. It highlights the features, explains the logic (especially the new ATH color coding), and gives proper credit to the original author as per the code.
You can copy and paste this directly into the description field when publishing.
Title: Quarterly Earnings & Sales Monitor
Description:
Overview: This indicator brings essential fundamental data directly onto your chart, allowing you to track a company's financial health without leaving your trading screen. It displays a customizable table featuring Earnings Per Share (EPS) and Sales (Revenue) data, complete with Year-over-Year (YoY) growth percentages.
Designed for both fundamental investors and technical traders, this script helps visualize earnings momentum and growth trends instantly.
Key Features
Smart Highlighting (Trend Detection): The latest quarter's data is automatically color-coded to help you spot strength immediately:
Yellow: Indicates an All-Time High (ATH) in EPS or Sales for the loaded history.
Orange: Indicates the current quarter is higher than the previous quarter (Quarter-over-Quarter growth).
Standard Color: Indicates stable or lower performance compared to the previous quarter.
Flexible Viewing Modes:
Standard Mode: A detailed table showing raw numbers and percentage changes.
Mini Mode: A compact "traffic light" version that replaces numbers with colored dots (Green/Red/Orange) representing YoY growth, perfect for keeping your chart clean.
Fundamental Context:
Displays Free Float or Market Cap (customizable) in the top-left corner of the table, giving you context on the stock's liquidity and size.
Fully Customizable:
Dark Mode: One-click toggle to switch between Light and Dark themes.
Positioning: Place the table anywhere on the chart (Top/Bottom, Left/Right/Center).
Data Size: Adjust how many historical quarters you want to see.
How to Read the Table
Rows: Each row represents a fiscal quarter (or year, depending on settings).
EPS Column: Diluted Earnings Per Share.
Sales Column: Total Revenue.
%Chg / YoY: The percentage growth compared to the same period last year.
Settings
Period: Toggle between Quarterly (FQ) and Yearly (FY) data.
Long Mode: Increase the number of historical periods displayed.
Size: Adjust the text size of the table to fit your screen resolution.
Credits: This script is built upon the "Volume Price and Fundamentals" concept by Mohit_Kakkar08, enhanced with ATH tracking, UI improvements, and specific color logic by finallynitin & EquityCraze.

CoreEdgeTrader™ Quarterly EPSVisualized Quarterly EPS, including:
EPS: Reported EPS
Std EPS: Standardized EPS
Actual: real number
QoQ change
YoY change
By @CoreEdgeTrader

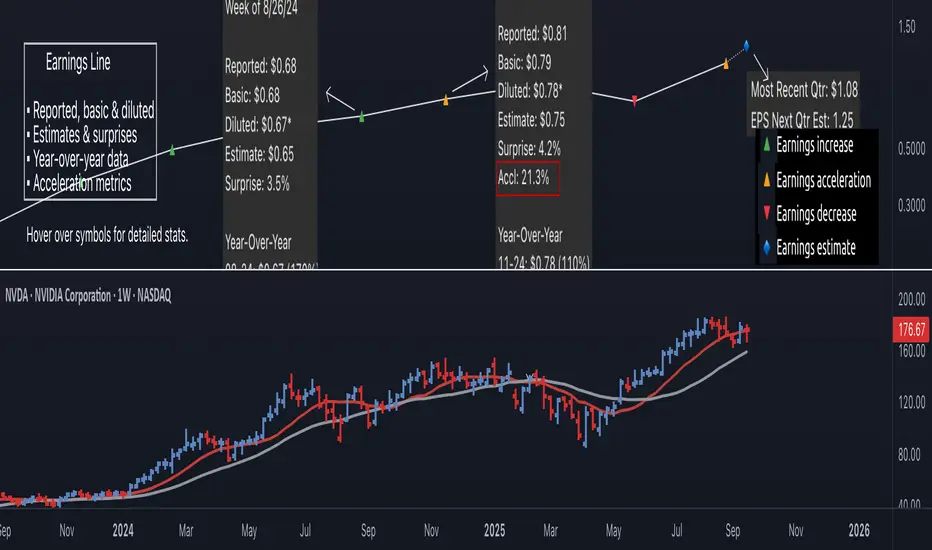
MarketSurge EPS Line [tradeviZion]MarketSurge EPS Line
EPS trend line overlay for TradingView charts, inspired by the IBD MarketSurge (formerly MarketSmith) EPS line style.
Comparison: Left side shows IBD MarketSurge EPS line as reference. Right side shows this TradingView script producing similar output with interactive tooltips. The left side image is for reference only to demonstrate similarity - it is not part of the TradingView script.
Features:
Displays EPS trend line on price charts
Uses 4-quarter earnings moving average
Shows earnings momentum over time
Works with actual, estimated, or standardized earnings data
Customizable line color and width
Interactive tooltips with detailed earnings information
Custom symbol analysis support
How to Use:
Add script to chart
EPS line appears automatically
Adjust color and width in settings if needed
Hover over line for earnings details
Settings Explained:
Display Settings:
Show EPS Line: Toggle to show or hide the EPS trend line
EPS Line Color: Choose the color for the EPS trend line and labels
EPS Line Width: Adjust the thickness of the EPS trend line (1-5 pixels)
Symbol Settings:
By default, the indicator analyzes the EPS data for the symbol currently displayed on your chart. The Custom Symbol feature allows you to:
Analyze EPS data for a different symbol without changing your chart
Compare earnings trends of related stocks or competitors
View EPS data for one symbol while analyzing price action of another
To use Custom Symbol:
Enable "Use Custom Symbol" checkbox
Click on "Custom Symbol" field to open TradingView's symbol picker
Search and select the symbol you want to analyze
The indicator will fetch and display EPS data for the selected symbol
Note: The chart will still show price action for your current symbol, but the EPS line will reflect the custom symbol's earnings data.
Data Settings:
EPS Field: Choose which earnings data source to use:
Actual Earnings: Reported earnings from company financial statements (default). Use this to analyze historical performance based on what companies actually reported.
Estimated Earnings: Analyst consensus forecasts for future quarters. Use this to see what analysts expect and compare expectations with actual results.
Standardized Earnings: Earnings adjusted for comparability across companies. Use this when comparing multiple stocks as it normalizes accounting differences.
Display Scale:
For the indicator to display correctly on the existing chart, it uses its own axis (right scale) by default. However, you can change this, but the view will not look the same. The right scale is recommended for optimal visibility as it allows the EPS line to be clearly visible alongside price action without compression.
Example: EPS line on separate right scale (recommended) - hover over labels to view detailed earnings tooltips
Example: EPS line pinned to Scale A (not recommended - appears as straight line due to small EPS range compared to price)
Example: EPS line displayed in separate pane below price chart
Methodology Credits:
This indicator implements the EPS line visualization methodology developed by Investor's Business Daily (IBD) for their MarketSurge platform (formerly known as MarketSmith). The EPS line concept helps visualize earnings momentum alongside price action, providing a fundamental overlay for technical analysis.
Technical Details:
Designed for daily, weekly, and monthly timeframes
Minimum 4 quarters of earnings data required
Uses TradingView's built-in earnings data
Automatically handles missing or invalid data
This indicator helps you visualize earnings trends alongside price action, providing a fundamental overlay for your technical analysis.

Top 20 Stocks Earnings Table: Quarters + Details (Easy View)Definition: Earnings Per Share (EPS) is a key financial metric that measures a company's profitability on a per-share basis. It shows how much profit is generated for each outstanding share of common stock.
You Can Edit Stocks To View EPS For Latest Quarter And Info Of Upcoming Quarter
Its Auto Updated Just Put It On Any Stock Or Index To View It
Even You Set Alerts For EPS Dates Announcements
Formula:
EPS = (Net Income - Preferred Dividends) / Average Outstanding Shares
Basic EPS: Uses weighted average shares outstanding.
Diluted EPS: Accounts for potential dilution from options, convertibles, etc. (often more conservative).
Importance:
Investor Insight: Helps compare profitability across companies (e.g., higher EPS signals better performance).
Valuation Tool: Used in ratios like P/E (Price/Earnings) to assess if a stock is over/undervalued.
Earnings Reports: Released quarterly/annually; beats/misses vs. estimates can drive stock prices. Thanks Saandeep Patill

EPS Trendline (Fundamentals Insight by Mazhar Karimi)Overview
This indicator visualizes a company’s Earnings Per Share (EPS) data directly on the chart—pulled from TradingView’s fundamental database—and applies a dynamic linear regression trendline to highlight the long-term direction of earnings growth or decline.
It’s designed to help investors and quantitative traders quickly see how the company’s profitability (EPS) has evolved over time and whether it’s trending upward (growth), flat (stagnant), or downward (decline).
How it Works
Uses request.financial() to fetch EPS data (Diluted or Basic).
You can select whether to use TTM (Trailing Twelve Months), FQ (Fiscal Quarter), or FY (Fiscal Year) data.
The script fits a regression line (using ta.linreg) over a configurable window to visualize the underlying EPS trend.
Updates automatically when new financial data is released.
Inputs
EPS Period: Choose between FQ / FY / TTM
Use Diluted EPS: Toggle to compare Diluted vs. Basic EPS
Regression Window: Adjust how many bars are used to fit the trendline
Interpretation Tips
A rising trendline indicates earnings momentum and potential investor confidence.
A flat or declining trendline may warn of profitability slowdowns.
Combine with price action or valuation ratios (like P/E) for deeper analysis.
Works best on stocks or ETFs with fundamental data (not available for crypto or FX).
Suggestions / Use Cases
Pair with Price/Earnings ratio indicators to evaluate valuation vs. fundamentals.
Use in conjunction with earnings release events for context.
Ideal for long-term investors, swing traders, or fundamental quants tracking financial health trends.
Future Enhancements (Planned Ideas)
🔹 Option to display multiple regression lines (short-term and long-term)
🔹 Support for comparing multiple tickers’ EPS in the same pane
🔹 Integration with Net Income, Revenue, or Free Cash Flow trends
🔹 Add a “Rate of Change” signal for momentum-based EPS analysis

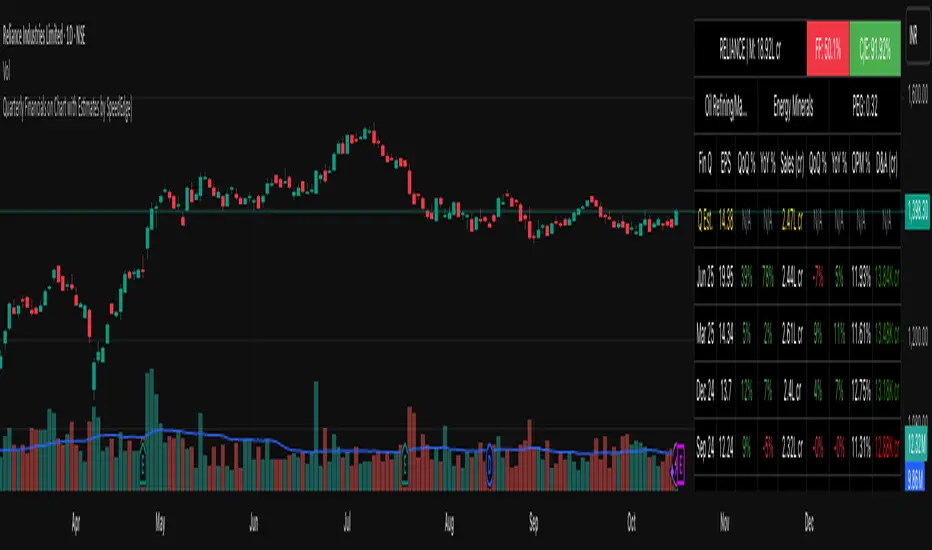
Quarterly Financials on Chart with Estimates by SpeedEdge)# Quarterly Financials on Chart with Estimates
## WHAT THIS SCRIPT DOES
This indicator displays comprehensive quarterly financial data directly on your trading chart, eliminating the need to switch between charting and fundamental analysis platforms. The script automatically fetches and organizes key financial metrics including earnings per share (EPS), revenue, operating margins, depreciation & amortization, and quarterly estimates alongside actual results for comparative analysis.
## WHY THIS COMBINATION IS ORIGINAL AND USEFUL
**The Problem Solved:** Traders conducting fundamental analysis typically need to toggle between trading charts and separate financial platforms to view quarterly results, estimates, and year-over-year comparisons. This workflow is inefficient and makes it difficult to correlate price movements with earnings announcements.
**The Solution:** This script integrates fundamental financial data directly into the price chart environment, providing:
- Side-by-side comparison of quarterly estimates versus actual results
- Automatic calculation of Quarter-over-Quarter (QoQ) and Year-over-Year (YoY) growth rates
- Color-coded visualization of financial performance trends
- Regional number formatting (Indian Crores or Global Billions/Millions)
- Key valuation metrics (Market Cap, Free Float, PEG Ratio, CFO/EBITDA) in header
**Unique Features:**
1. **Dual Number Format System**: Automatically formats financial figures in Indian Crores (Cr, K Cr, L Cr) or Global formats (M, B, T) based on user preference
2. **Estimate Integration**: Shows analyst estimates for upcoming quarters alongside historical actuals for beat/miss analysis
3. **Intelligent Growth Analysis**: Automatically calculates and color-codes quarterly and yearly growth comparisons with smart handling of missing data
4. **Context-Aware Color Coding**: Green/red visualization adapts based on metric type - growth metrics, cash flow quality indicators, and expense trends each use appropriate color logic
5. **Configurable History**: Display 4 to 20 previous quarters based on analysis needs
## HOW THE SCRIPT WORKS TECHNICALLY
### Core Methodology:
**1. Financial Data Integration:**
The script accesses quarterly and annual financial statement data from public company filings, including:
- **Earnings Estimates**: Analyst consensus forecasts for upcoming quarters
- **Quarterly Actuals**: Reported earnings per share, revenue, margins, and operating expenses
- **Key Ratios**: Shares outstanding data, valuation multiples, and cash flow metrics
All data is sourced from TradingView's fundamental database, which aggregates information from official regulatory filings (10-Q, 10-K, annual reports) filed by publicly traded companies.
**2. Historical Data Organization:**
The script employs a sophisticated data structure system that:
- Detects when new quarterly results are released by monitoring data changes
- Automatically indexes financial data by quarters relative to the current date
- Creates a chronological timeline of financial performance
- Maintains historical records for comparison calculations
- Updates dynamically as new earnings are reported
**3. Intelligent Number Formatting:**
**Indian Regional Format:**
- Converts absolute values to Crore denomination (1 Crore = 10 Million)
- Scales to Thousand Crores (K Cr) for mid-size companies
- Scales to Lakh Crores (L Cr) for large corporations
- Appropriate for analyzing Indian market stocks
**Global Standard Format:**
- Uses Million (M) for smaller companies
- Scales to Billion (B) for mid-cap and large-cap stocks
- Uses Trillion (T) for mega-cap corporations
- Thousands (K) for smaller financial figures
- Standard across US and international markets
**4. Comparative Growth Analysis:**
**Quarter-over-Quarter (QoQ) Calculations:**
The script compares each quarter's performance against the immediately preceding quarter to identify:
- Sequential growth trends
- Momentum acceleration or deceleration
- Short-term business trajectory
- Seasonal pattern changes
**Year-over-Year (YoY) Calculations:**
Compares each quarter against the same quarter from the previous year to:
- Eliminate seasonal effects
- Identify sustainable growth trends
- Normalize for business cycles
- Provide apples-to-apples comparison
Both calculations automatically handle edge cases like missing data, account for different fiscal year conventions, and provide meaningful "N/A" indicators when comparative data is unavailable.
**5. Adaptive Color Coding System:**
**Growth Metrics (EPS, Revenue):**
- Positive growth → Green shading indicates improving performance
- Negative growth → Red shading signals declining performance
- Missing data → Gray indicates insufficient information
**Quality Indicators (Free Float %):**
- Lower float (<40%) → Green indicates potentially better supply-demand dynamics
- Higher float (≥40%) → Red suggests more diluted ownership
**Cash Flow Quality (CFO/EBITDA):**
- Strong cash conversion (≥50%) → Green shows quality earnings
- Weak cash conversion (<50%) → Red flags potential accounting concerns
**Expense Trends (Depreciation & Amortization):**
- Decreasing D&A → Green indicates improving cash flow characteristics
- Increasing D&A → Red suggests rising capital intensity
- Stable D&A → Default color shows consistency
**Future Estimates:**
- Yellow coloring clearly distinguishes forward-looking estimates from historical actuals
**6. Date and Quarter Intelligence:**
The script automatically:
- Determines the current financial quarter based on real-time date
- Maps calendar months to fiscal quarters (Q1-Q4)
- Handles different fiscal year conventions globally
- Calculates quarter differentials for accurate historical lookback
- Formats display labels showing quarter-end months and years (e.g., "Mar 24", "Dec 23")
### Advanced Calculations:
**Free Float Percentage:**
Calculates the proportion of shares available for public trading relative to total shares outstanding. Lower percentages indicate more concentrated ownership, which can affect volatility and liquidity.
**Market Capitalization:**
Real-time calculation using total shares outstanding multiplied by current market price, automatically updated with each price tick and formatted according to regional preferences.
**CFO/EBITDA Cash Quality Ratio:**
Measures what percentage of accounting earnings converts to actual operating cash flow. Higher ratios indicate better earnings quality and less aggressive accounting. Industry standards vary, but 60-100% typically signals strong cash generation.
**Operating Profit Margin Tracking:**
Monitors the percentage of revenue retained as operating profit after deducting operating expenses, providing insight into operational efficiency and pricing power trends.
## HOW TO USE THIS SCRIPT
### Initial Setup:
**1. Region Configuration:**
- **India**: Select for Indian stocks - formats numbers in Crores (₹10M = 1 Cr)
- **Global**: Select for international stocks - formats in Millions/Billions
**2. Display Settings:**
- **Position**: Choose table location on chart (Top Right recommended)
- **Table Size**: Adjust based on screen resolution (Normal is default)
- **Short Labels**: Enable to condense industry/sector names for space saving
- **Lookback Quarters**: Set how many previous quarters to display (4-20, default 5)
**3. Visual Customization:**
- **Background Color**: Customize table background color and transparency
- **Text Color**: Adjust text color for visibility
- **Border/Frame Colors**: Modify table borders for preferred appearance
### Reading the Dashboard:
**Header Section (Top 3 Rows):**
**Row 1:**
- **Ticker | Mcap**: Company symbol and current market capitalization
- **FF (Free Float)**: Percentage of freely traded shares (Green < 40% is positive, Red ≥ 40%)
- **CFO/EBITDA**: Cash flow quality ratio (Green ≥ 50% is positive, Red < 50%)
**Row 2:**
- **Industry**: Company's specific industry classification
- **Sector**: Broader sector classification
- **PEG Ratio**: Price/Earnings to Growth ratio (< 1 traditionally considered undervalued)
**Data Section:**
**Column Explanations:**
1. **Fin Q**: Financial quarter (format: "Mar 24" = Q4 FY2024 ending March)
2. **EPS**: Earnings Per Share in reporting currency
3. **QoQ %**: EPS growth versus previous quarter (Green = increase, Red = decrease)
4. **YoY %**: EPS growth versus same quarter last year
5. **Sales**: Total revenue (formatted in Cr or M/B based on region)
6. **QoQ %**: Revenue growth versus previous quarter
7. **YoY %**: Revenue growth versus same quarter last year
8. **OPM %**: Operating Profit Margin percentage
9. **D&A**: Depreciation & Amortization (Green if decreasing = cash flow positive)
**Estimates Row (Yellow Text):**
- Shows "Q Est." for upcoming quarter
- Displays analyst consensus estimates for EPS and Sales
- Compare actuals against estimates after earnings release to identify beats/misses
### Trading Applications:
**Fundamental Analysis:**
- **Earnings Quality Check**: Look for consistent QoQ and YoY growth in both EPS and Sales
- **Margin Trend Analysis**: Monitor OPM % changes to assess operational efficiency
- **Estimate Comparison**: Identify stocks that consistently beat or miss estimates
- **Cash Flow Validation**: Use CFO/EBITDA ratio to verify earnings quality
**Entry/Exit Timing:**
- **Post-Earnings Analysis**: Check if stock beat estimates and by what margin
- **Trend Confirmation**: Strong YoY growth + improving margins = positive fundamentals
- **Warning Signs**: Declining margins, negative growth, or deteriorating CFO/EBITDA
**Portfolio Screening:**
- **Growth Stocks**: Look for consistent QoQ and YoY EPS/Sales growth
- **Value Stocks**: Low PEG ratios combined with positive fundamentals
- **Quality Filter**: High CFO/EBITDA ratios (>75%) indicate superior cash generation
### Interpretation Guidelines:
**Strong Fundamental Setup:**
- YoY growth > 15% in both EPS and Sales
- QoQ growth positive for 2+ consecutive quarters
- OPM % stable or improving
- CFO/EBITDA > 60%
- Actual results exceed estimates
**Concerning Signals:**
- Declining YoY growth rates
- Shrinking operating margins
- Consistently missing estimates
- CFO/EBITDA < 40%
- Increasing D&A as percentage of revenue
## IMPORTANT USAGE NOTES
**Data Limitations:**
- Financial data depends on official company filings and reporting schedules
- Some stocks may have incomplete historical data depending on listing history
- Estimates may not be available for all companies, especially smaller-cap stocks
- Data updates occur after official earnings releases, not in real-time during announcements
**Realistic Expectations:**
- This tool displays historical fundamental data for analysis - not predictive signals
- Always verify critical financial data with official company filings when making investment decisions
- Fundamental analysis should complement technical analysis, not replace it
- Past financial performance does not guarantee future results
- Earnings estimates are analyst opinions, not certainties
**Best Practices:**
- Cross-reference important data points with company investor relations pages
- Consider industry-specific metrics beyond the displayed general figures
- Use in conjunction with technical indicators for comprehensive analysis
- Monitor for data anomalies (stock splits, accounting changes, restatements) that may affect comparisons
- Understand that different accounting standards (GAAP vs IFRS) may affect international comparisons
**Regional Considerations:**
- Indian stocks: Numbers in Crores (1 Cr = 10 Million Rupees)
- Global stocks: Numbers in standard M/B/T format
- Currency conversions are not performed - data shown in reporting currency
- Fiscal year conventions vary by region (India typically uses Apr-Mar fiscal year, US uses Jan-Dec or custom fiscal years)
- Different markets have different reporting timelines and requirements
## CONFIGURATION RECOMMENDATIONS
**For Indian Stocks:**
- Region: India
- Lookback: 5-8 quarters (recommended)
- Focus on YoY growth due to seasonal business patterns in many Indian companies
**For US/Global Stocks:**
- Region: Global
- Lookback: 4-6 quarters for tech/growth stocks
- Lookback: 8-12 quarters for cyclical/industrial stocks
- Monitor QoQ trends closely for rapid-growth sectors
**For Long-term Investors:**
- Increase lookback to 12-20 quarters to see multi-year trends
- Focus on consistency rather than individual quarter volatility
- Pay close attention to CFO/EBITDA quality metric for sustainable businesses
- Look for stable or improving margins over extended periods
**For Active Traders:**
- Use 4-6 quarter lookback for recent trend focus
- Concentrate on latest QoQ trends and estimate beats/misses
- Monitor table closely before/after earnings announcements
- Compare estimate versus actual immediately post-earnings for trading opportunities
**For Swing Traders:**
- 6-8 quarter lookback provides good balance
- Focus on acceleration/deceleration in growth rates
- Use margin trends to identify operational inflection points
- Combine with technical analysis for optimal entry/exit timing
This script serves as a comprehensive fundamental analysis tool for traders and investors who want seamless chart integration of financial data without workflow interruption, enabling faster and more informed decision-making.
EPS YoY% Labels (MarketSurge / IBD style)This script automatically calculates and displays year-over-year quarterly EPS growth (%) directly on the chart, in the same style used by MarketSurge / IBD.
🔹 Key Features
Detects each quarterly earnings report and shows EPS YoY growth as a label above the bar.
Works with both reported EPS and standardized EPS (selectable in settings).
Positive growth is highlighted in green, while negative growth is highlighted in red.
Optional setting to hide negative results for a cleaner, bullish-focused view.
Adjustable decimal precision (0–2 decimals) for percentage display.
🔹 Why it’s useful
EPS growth is one of the core fundamentals that top traders like Mark Minervini and William O’Neil (IBD) focus on when screening for market leaders.
Now you can see at a glance how a stock’s earnings power is accelerating or decelerating — without flipping between platforms.
Combine with Relative Strength (RS) analysis and price/volume patterns for a complete growth-stock trading workflow.
🔹 Example
If a company reports EPS of $1.20 this quarter vs. $0.80 in the same quarter last year, the label will display:
EPS +50% (green).

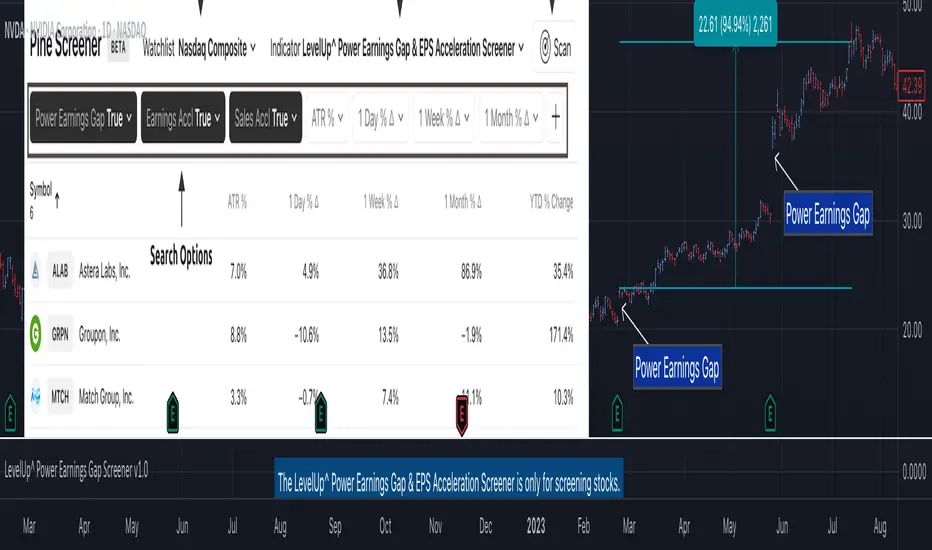
Power Earnings Gap Screener Pro [LevelUp]Customizable Pine Screener to scan for stocks with a Power Earnings Gap as well as accelerating earnings and sales. Historical analysis shows that strong earnings often trigger institutional buying, pushing prices higher and increasing the likelihood of sustained price gains.
🔹 Power Earnings Gap (PEG)
A power earnings gap refers to a significant price gap up after an earnings report, reflecting a rapid shift in investor sentiment and perceived value. It’s called "power" because the move is often sharp, sustained, and accompanied by high trading volume, signaling a potential trend continuation or reversal.
A gap is the difference between the closing price of a stock on the day before an earnings report and the opening price the next trading day. A power earnings gap typically exceeds a certain threshold (e.g., 8-10% or more) and is driven by earnings surprises, guidance changes, or other significant news.
Strong earnings beats, misses, or forward-looking guidance can trigger these gaps. For example, a company reporting higher-than-expected profits or raising guidance might gap up, while a miss or weak outlook could cause a gap down.
The gap is often accompanied by above-average trading volume, confirming the move's strength. Power gaps often lead to sustained price movement in the direction of the gap (continuation) or signal a reversal if the gap fills quickly.
How Power Earnings Gap Be Helpful
▪ Power earnings gaps often indicate strong momentum. Traders can capitalize on this by entering trades in the direction of the gap (e.g., buying on a gap-up if the trend continues).
Example: If a stock gaps up 10% after a stellar earnings report and shows high volume, traders might buy, expecting further upside as momentum builds.
▪ Breakout Opportunities: A gap through key technical levels (e.g., resistance or support) can signal a breakout. Traders use these gaps to identify potential long-term trends.
Example: A stock breaking above a resistance level on a power earnings gap may continue to rally, offering a setup for swing or position traders.
▪ Volatility for Short-Term Trades: Earnings gaps create heightened volatility, ideal for day traders or scalpers. The large price swings allow for quick profits if timed correctly.
Example: A trader might use options (e.g., calls for a gap-up, puts for a gap-down) to leverage the volatility around earnings.
▪ Confirmation of Fundamental Strength/Weakness: A power earning gap often reflects a fundamental shift, e.g., strong earnings growth or a major business development. Traders can use this to align technical setups with fundamental catalysts.
Example: A gap-up after a company raises its full-year guidance might signal a long-term buying opportunity.
▪ Risk Management and Stop Losses: Gaps provide clear levels for setting stop-loss orders. For instance, traders might place stops at or below the gap up bar low to protect against a potential reversal.
Example: If a stock gaps up from $100 to $110 and intraday hits a low of $105, a trader might set a stop at $105 or lower to limit downside risk.
▪ Gap Fill Strategies:Some traders bet on gaps filling, i.e., the stock returning to its pre-gap price. If a power earnings gap seems overextended (e.g., due to market overreaction), contrarian traders might short a gap-up or buy a gap-down, anticipating a pullback.
Example: A stock gaps up 15% but lacks volume or follow-through; a trader might short it, expecting the price to retreat.
🔹 Earnings and Sales Acceleration
Earnings and sales acceleration refers to the rate of growth in a company's earnings over consecutive quarters. It highlights companies that are not only growing but doing so at an accelerating pace, signaling improving financial health and operational momentum. This metric is derived from earnings reports, which detail a company’s financial performance.
Key Concepts
▪ Earnings Acceleration: When a company’s earnings per share (EPS) growth rate increases over time (e.g., EPS growth of 10% in Q1, 15% in Q2, 20% in Q3). It indicates improving profitability, often due to cost efficiencies, margin expansion and strong demand.
▪ Sales Acceleration: When revenue growth rates increase over time (e.g., revenue growth of 5% in Q1, 8% in Q2, 12% in Q3). This reflects rising demand for products/services and operational efficiency.
▪ Relation to Earnings Reports: Acceleration is calculated by comparing sequential quarter-over-year growth rates in earnings and sales, often highlighted in earnings reports or analyst commentary. It’s a sign of fundamental strength when both metrics accelerate together.
How It’s Helpful to Traders
▪ Identify High-Potential Stocks: Stocks with accelerating earnings and sales often attract investor attention, as they signal a company is outperforming expectations and gaining market share. This can lead to sustained price appreciation.
Example: A tech company reporting 20% EPS growth and 15% sales growth quarter-over-quarter may see bullish price action as investors bet on continued momentum.
▪ Momentum Trading Opportunities: Acceleration often fuels stock price momentum, especially post-earnings. Traders can ride these trends using technical setups like breakouts or pullbacks.
Example: A stock breaking above a key resistance level after reporting accelerating growth may be a buy signal for swing traders.
▪ Early Indicator of Breakouts: Companies with accelerating fundamentals are more likely to experience price breakouts, as institutional investors (e.g., hedge funds, mutual funds) pile in. Traders can use this to position early.
Example: A retailer with accelerating sales due to strong holiday demand might gap up post-earnings, offering a breakout trade.
▪ Confirmation of Fundamental Strength: Acceleration validates a company’s growth story, reducing the risk of investing in stocks with inconsistent performance. Traders can align technical trades with strong fundamentals.
Example: A biotech with accelerating sales from a new drug launch may sustain a rally, giving traders confidence in long positions.
▪ Volatility for Short-Term Trades: Earnings reports showing acceleration often lead to significant price gaps or volatility, creating opportunities for day traders or options traders.
Example: A trader might buy call options on a stock expected to report accelerating earnings, anticipating a sharp post-earnings move.
🔹 Power Earnings Gaps - Examples
🔹 Screening Features - Setting Your Search Criteria
Power Earnings Gap
▪ Search Range
How many bars back to search for Power Earnings Gaps, anywhere between 1 and 90 bars.
▪ Last Bar Only
Look only at the last bar for Power Earnings Gaps. This is useful when looking for PEGs when screening at the end of a trading day. Choosing this option, the Search Range will be ignored.
▪ Minimum Price % Gap Up From Prior Close
This is the minimum gap up percent change to be considered a Power Earnings Gap.
▪ Minimum Volume % Change Over Average
This is the minimum volume percent change, over the 50-day average volume, to be considered a Power Earnings Gap.
▪ Require Positive Surprise
Require a positive earnings surprise and the minimum percent change.
▪ Require Closing Range
To ensure the price action closed strong on the day, specify a preferred closing range as a percentage of the bar's daily range.
▪ Gap Up Bar
The gap up bar can be configured to require one of the following:
- Open Above Prior High - Ensures there is visible gap up from the prior bar.
- Low Above Prior High - Allows for intraday price action to go below the prior bar high.
- No Requirement
Earnings And Sales Acceleration
▪ Quarters of Acceleration
You can specify between 1 and 4 quarters of earnings and/or sales acceleration.
🔹 Installation And Usage
▪ Mark this indicator as a Favorite.
▪ Use the Pine Screener to search for stocks.
▪ Save the search results to a watchlist.
▪ View the watchlist in TradingView.
🔹 Note
▪ Risk of Reversals: Not all gaps sustain their direction. Over reactions can lead to gap fills.
▪ High Volatility: Earnings gaps can be unpredictable, requiring quick decision-making & discipline.
Script de pago
PFA_Earnings Surprise %📌 Indicator Name: Earnings Surprise %
📖 Description:
The Earnings Surprise % indicator calculates and plots the difference between reported EPS (Earnings Per Share) and analyst consensus estimates, expressed as a percentage of the estimate. It helps traders and investors quickly gauge how much a company’s earnings have deviated from expectations on each earnings release date.
Earnings Surprise % — See how earnings stack up against expectations!
This simple yet powerful tool shows the percentage difference between reported EPS and analyst estimates directly on your chart. Positive surprises are plotted in green, negative surprises in red, so you can instantly spot earnings beats and misses. Great for combining with gap analysis, volume spikes, or technical setups around earnings dates. Works best on daily charts of stocks and ETFs with regular earnings reports.

EPS, Revenue & NPM Growth Marker v2This indicator visually tracks fundamental growth by plotting smart labels on earnings dates, showing three key metrics:
EPS (Earnings Per Share)
Revenue (Sales)
Net Profit Margin (NPM)
It overlays compact, readable labels on the chart allowing you to evaluate a company's financial performance — both sequentially (QoQ) and annually (YoY).
EPS, Revenue & NPM Growth Marker v2 uses both official earnings data and fallback logic (EPS/Revenue/NPM changes) to ensure consistent detection of earnings events.
⭐ Key Features
Three Metrics: Displays EPS, Revenue, and Net Profit Margin
Growth Breakdown: Shows Absolute, Quarter-over-Quarter %, and Year-over-Year % change
Smart Arrows: Trend direction shown with emoji arrows (🡩🡫)
Earnings Detection: Aligns labels to official earnings events or fallback data
Highly Customizable: Full control over visible metrics, growth types, label style, placement, and max label count
Clean Display: Keeps the chart clean with a limit on max labels
⚙️ Customization Options
You can personalize the indicator to match your charting style:
Select metrics to display: EPS, Revenue, NPM
Toggle row types: Absolute, QoQ %, YoY %
Choose label position: Above Bar, Below Bar, Top, or Bottom
Customize line style, colors, and label text color
Set the maximum number of labels shown on chart
🧠How It Works
Absolute Value: Latest reported figure for each metric (e.g., EPS = ₹3.20)
QoQ % Change: (Current - Previous Quarter) / |Previous| * 100
YoY % Change: (Current - Same Quarter Last Year) / |Previous Year| * 100
The script uses TradingView’s request.earnings() data when available. If official earnings data is missing, it intelligently detects earnings events based on changes in EPS, Revenue, or NPM figures.
This is a major update to EPS & Sales/Revenue Growth Marker script, with expanded metrics, enhanced logic, and greater customization.
Developed & Published by: @learningvitals

EPS+Sales+Net Profit+MCap+Sector & Industry📄 Full Description
This script displays a comprehensive financial data panel directly on your TradingView chart, helping long-term investors and swing traders make informed decisions based on fundamental trends. It consolidates key financial metrics and business classification data into a single, visually clear table.
🔍 Key Features:
🧾 Financial Metrics (Auto-Fetched via request.financial):
EPS (Earnings Per Share) – Displayed with trend direction (QoQ or YoY).
Sales / Revenue – In ₹ Crores (for Indian stocks), trend change also included.
Net Profit – Also in ₹ Crores, along with percentage change.
Market Cap – Automatically calculated using outstanding shares × price, shown in ₹ Cr.
Free Float Market Cap – Based on float shares × price, also in ₹ Cr.
🏷️ Sector & Industry Info:
Automatically identifies and displays the Sector and Industry of the stock using syminfo.sector and syminfo.industry.
Displayed inline with metrics, making it easy to know what business the stock belongs to.
📊 Table View:
Compact and responsive table shown on your chart.
Columns: Date | EPS | QoQ | Sales | QoQ | Net Profit | QoQ | Metrics
Metrics column dynamically shows:
Market Cap
Free Float
Sector (Row 4)
Industry (Row 5)
🌗 Appearance:
Supports Dark Mode and Mini Mode toggle.
You can also customize:
Number of data points (last 4+ quarters or years)
Table position and size
🎯 Use Case:
This script is ideal for:
Fundamental-focused traders who use EPS/Sales trends to identify momentum.
Swing traders who combine price action with fundamental tailwinds.
Portfolio builders who want to see sector/industry alignment quickly.
It works best with fundamentally sound stocks where earnings and profitability are a major factor in price movements.
✅ Important Notes:
Script uses request.financial which only works with supported symbols (mostly stocks).
Market Cap and Free Float are calculated in ₹ Crores.
All financial values are rounded and formatted for readability (e.g., 1,234 Cr).
🙏 Credits:
Developed and published by Sameer Thorappa
Built with a clean, minimalist approach for high readability and functionality.

Greer EPS Yield📘 Script Title
Greer EPS Yield – Valuation Insight Based on Earnings Productivity
🧾 Description
Greer EPS Yield is a valuation-focused indicator from the Greer Financial Toolkit, designed to evaluate how efficiently a company generates earnings relative to its current stock price. This script calculates the Earnings Per Share Yield (EPS%), using the formula:
EPS Yield (%) = Earnings Per Share ÷ Stock Price × 100
This yield metric provides a quick snapshot of valuation through the lens of profitability per share. It dynamically highlights when the EPS yield is:
🟢 Above its historical average (potentially undervalued)
🔴 Below its historical average (potentially overvalued)
🔍 Use Case
Quickly assess valuation attractiveness based on earnings yield.
Identify potential buy opportunities when EPS% is above its long-term average.
Combine with other indicators in the Greer Financial Toolkit for a fundamentals-driven investment strategy:
📘 Greer Value – Tracks year-over-year growth consistency across six key metrics
📊 Greer Value Yields Dashboard – Visualizes valuation-based yield metrics
🟢 Greer BuyZone – Highlights long-term technical buy zones
🛠️ Inputs & Data
Uses fiscal year EPS data from TradingView’s built-in financial database.
Tracks a static average EPS Yield to compare current valuation to historical norms.
Clean, intuitive visual with automatic color coding.
⚠️ Disclaimer
This tool is for educational and informational purposes only and should not be considered financial advice. Always conduct your own research before making investment decisions.

Pristine Fundamental AnalysisThe Pristine Fundamental Analysis indicator enables users to perform comprehensive fundamental stock analysis in a fraction of the time! 🏆
For swing/position traders, fundamental analysis is essential—it informs stock selection and strengthens conviction, enabling traders to stay in positions long enough to capture larger moves. Since every ticker represents both a business and a tradable asset, fundamental analysis perfectly complements technical analysis.
💠 Fundamental Analysis Insights - Weekly Timeframe
EPS & sales trends, margins & ratios, and valuation metrics are displayed on the weekly timeframe for in-depth analysis outside market hours.
💠 Fundamental Analysis Insights - Daily Timeframe
A slimmed down version of the fundamental analysis table is displayed on the daily timeframe to provide users quick insights into the fundamentals, while allowing them to focus on technical analysis during market hours.
💠 Fundamental Analysis Metrics to Deepen Understanding of Companies!
EARNINGS & SALES TRENDS
Why does it matter? Company stock prices tend to track the growth trajectory of earnings and sales over time. By analyzing fundamentals, users can gain an edge that pure technical traders do not have. This edge is most pronounced during big market dislocations when investors are forced to liquidate their top holdings.
▪ EPS - Measures year-over-year growth, quarter-over-quarter growth, and the surprise between actuals & analyst estimates
▪ Sales Analysis - Measures year-over-year growth, quarter-over-quarter growth, and the surprise between actuals & analyst estimates
MARGIN ANALYSIS
Why does it matter? Revenue is the lifeblood of a company. Margins measure company profits and expenditures as a percentage of revenue
▪ G% - Gross margin measures the percentage of revenue a company retained after subtracting the direct costs of producing the goods or services it sells, known as the cost of goods sold (COGS)
▪ CFO% - Measures the percentage of a company's revenue that was converted to Cash flow from operations (CFO). CFO, also known as operating cash flow (OCF), is the amount of cash a company generated from its core business activities over a specific period. It reflects the actual cash inflows and outflows resulting from the company’s main operations, such as selling products or providing services, and excludes cash flows from investing and financing activities.
▪ Net% - Net margin measures the percentage of revenue that was converted to net profit
▪ ROE% - Return on Equity measures how much net income a company produced for each dollar of equity invested by shareholders
▪ R&D% - R&D margin measures how much the company invested in research & development as a percentage of revenue
▪ D/E - The Debt to Equity ratio measures how much of a company’s financing comes from creditors (debt) versus owners (equity), providing insight into the company’s financial leverage and risk profile. The indicator tracks changes in the ratio over time
VALUATION METRICS
Why does it matter? Valuation metrics provide users an understanding of the potential risk if the fundamental trajectory of the company, or the broad market, changes! The more highly valued a company is, the more downside risk is present if conditions worsen, and vice versa.
▪ PE - The Price-to-Earnings ratio measures a company’s current share price relative to its trailing twelve-month(TTM) earnings per share (EPS). It helps investors assess how much they are paying for each dollar of a company’s earnings and is often used to gauge whether a stock is overvalued, undervalued, or fairly valued compared to its peers or historical averages.
▪ PS - The Price-to-Sales ratio measures a company’s current share price relative to its trailing twelve-month(TTM) sales per share. It helps investors assess how much they are paying for each dollar of a company’s sales and is often used to gauge whether a stock is overvalued, undervalued, or fairly valued compared to its peers or historical averages.
▪ BB% - Buyback yield measures the annual percentage of stock repurchased by the company. Share buybacks reduce total share count, which directly increases earnings per share!
💠 What Makes This Indicator Unique
There are many fundamental dashboards, however, what makes this indicator unique is customized metrics that were used to achieve back-to-back top finishes in the US Investing Championship. The main purpose of the indicator is to highlight companies with a history of EPS and sales acceleration , rather than focusing on the values in isolation, or even the growth of the values. Our goal is further evolution of the metrics and color signals based on continued backtesting and analysis of real-time market data.
▪ Custom Margin Metrics : Several of the margin metrics are unique and offer significant value beyond EPS and sales data alone.
For example, there are plenty of companies that have negative EPS due to non-cash expenses and/or investments they are making into their business, but that does not by itself mean that the companies are not worthy of an investment. Roblox (RBLX) is a great example. The company has consistently negative EPS, but the CFO% margin is positive! That means the core business throws off significant amounts of cash, and a large amount of it is being allocated to aggressive R&D spend, which is captured by the R&D% metric. This could propel the fundamentals of the business well into the future.
▪ Color Signals Based on Thresholds : The background colors of metrics are based on historical analysis and apply relevant thresholds to help users identify companies with strong fundamentals
▪ Comprehensive Inline Documentation : All headers cells offer detailed information about the relevant calculations/metrics as well as in-depth information on color coding and how to interpret each value. This small, yet important detail, allows users to quickly identify accelerating fundamental trends
💠 Practical Use Case Examples
Analyzing fundamentals to trade a Power Earnings Gap setup 👇
In August 2023, APP reported a +467% YoY increase in EPS, 181% higher than Wall Street estimates! This sparked a generational trading opportunity.👇
After the first earnings report with stellar earnings growth, APP rallied > 1000% in 2 years, following the trajectory of sales and EPS.👇
💠 Settings and Preferences
💠 Tips and Tricks
Fundamentals drive price action during periods of fundamental transition
▪ Pre-revenue companies that are anticipated to start earning revenue
▪ Revenue-generating companies that are anticipated to flip from negative to positive EPS
▪ Revenue-generating companies that are anticipated to flip from negative cash flow to positive cash flow
▪ Major accelerations or decelerations in sales or EPS

EPS and Sales Magic Indicator V2EPS and Sales Magic Indicator V2
EPS and Sales Magic Indicator V2
Short Title: EPS V2
Author: Trading_Tomm
Platform: TradingView (Pine Script v6)
License: Free for public use under fair usage guidelines
Overview
The EPS and Sales Magic Indicator V2 is a powerful stock fundamental visualization tool built specifically for TradingView users who wish to incorporate earnings intelligence directly onto their price chart. Designed and developed by Trading_Tomm, this upgraded version of the original 'EPS and Sales Magic Indicator' includes an enriched and more insightful presentation of company performance metrics — now with TTM EPS support, advanced color-coding, label sizing, and refined control options.
This indicator is tailored for retail traders, swing investors, and long-term fundamental analysts who need to view Quarter-over-Quarter (QoQ) earnings and revenue changes directly on the price chart without switching tabs or breaking focus.
What Does It Display?
The EPS and Sales Magic Indicator V2 intelligently detects quarterly financial updates and displays the following data points via labels:
1. EPS (Earnings Per Share) – Current Quarterly Value
This is the most recent Diluted EPS published by the company, fetched using TradingView’s request.financial() function.
Displayed in the format: EPS: ₹20.45
2. EPS QoQ Percentage Change
Shows the percentage change in EPS compared to the previous quarter.
Highlights improvement or decline using arrows (up for improvement, down for decline).
Displayed in the format: EPS: ₹20.45 (up 15.3 percent)
3. Sales (Revenue) – Current Quarterly Value
Fetches and displays Total Revenue of the company in ₹Crores for easier Indian-market readability.
Displayed in the format: Sales: ₹460Cr
4. Sales QoQ Percentage Change
Measures and presents the quarter-over-quarter percentage change in total revenue.
Uses arrows to indicate growth or contraction.
Displayed in the format: Sales: ₹460Cr (down 3.8 percent)
5. EPS TTM (Trailing Twelve Months)
You now get the TTM EPS — the sum of the last four quarterly EPS values.
This value provides a better long-term earnings snapshot compared to a single quarter.
Displayed in the format: TTM EPS: ₹78.12
All of these values are automatically calculated and displayed only on the bars where a new financial report is detected, keeping your chart clean and insightful.
Customization Features
This indicator is built with user control in mind, allowing you to personalize how and what you want to see:
Show EPS in Label: Enable or disable the display of EPS and EPS QoQ values.
Show Sales in Label: Toggle the visibility of revenue and sales change percentage.
Color Options for Label Themes: The label background color is automatically determined based on performance.
Green: Both EPS and Sales increased QoQ.
Red: Both decreased.
Orange: One increased and the other decreased.
Gray: Default color (if values are unavailable or mixed).
Label Text Size: Choose from Tiny, Small (default), or Normal.
Visual Design
Placement: The labels are positioned just below the candlesticks using yloc.belowbar, so they do not obstruct price action or interfere with technical indicators.
Anchor: Aligned precisely with the financial reporting bars to maintain clarity in historical comparisons.
Background Style: Clean, semi-transparent styling with soft text colors for comfortable viewing.
How It Works
The indicator relies on TradingView’s powerful request.financial() function to extract fiscal quarterly financials (FQ). Internally, it uses detection logic to identify fresh data updates by comparing current vs. previous values, arithmetic to compute QoQ percentage changes in EPS and Sales, logic to build formatted labels dynamically based on user selections, and conditional color and sizing logic to enhance interpretability.
Use Cases
For Long-Term Investors: Quickly identify if a company’s profitability and revenue are improving over time.
For Swing Traders: Combine recent earnings trends with price action to evaluate if post-result momentum has real backing.
For Technical and Fundamental Traders: Layer it with moving averages, RSI, or volume to create a hybrid analysis environment.
Limitations and Notes
Financial data is provided by TradingView’s financial API, and occasional missing values may occur for less-covered stocks.
This tool does not repaint but depends on the timing of the official financial updates.
All values are rounded and formatted to prioritize readability.
Works best on Daily or higher timeframes (weekly or monthly also supported).
License and Fair Use
This script is free to use and share under TradingView’s open-use guidelines. You may copy, fork, and build upon this indicator for personal or educational purposes, but commercial usage requires attribution to the author: Trading_Tomm.
Future Enhancements (Planned)
Addition of Net Profit (QoQ and TTM)
Inclusion of Operating Margin, Profit Margin, and Book Value
Option to switch between numeric and graphical display (table mode)
Alerts on extreme earnings deviation or sales slumps
Final Thoughts
The EPS and Sales Magic Indicator V2 represents a clean, visual, and smart way to monitor a company’s core performance from your chart screen. It helps you align fundamental strength with technical strategies and provides instant financial clarity, which is especially vital in today’s fast-moving markets.
Whether you’re preparing for an earnings season or scanning past performance to pick your next investment, this indicator saves time, enhances insights, and sharpens decisions.

Base Detector Pro [AletheiaTradeLab]This custom Trading View indicator combines William O’Neal “Base” patterns with several complementary tools—David Ryan’s ANT indicator, key pivot‐based price levels, index and earnings lines, relative strength (RS) line, and moving averages—to help you pinpoint base formations and validate whether each one merits a trade.
1. Bases (William O'Neal)
A “base” is simply a period of price consolidation following a significant run-up. During this phase, a stock moves mostly sideways within a defined trading range, forming clear support and resistance lines.
Key Criteria for a Valid Base
- Prior Uptrend
Before a base begins, the stock should already have a healthy advance—typically at least a 30% gain.
- Shapes of Bases
Bases can form in several distinct geometric patterns, each signaling a different kind of consolidation and potential breakout:
Flat Base
Shape : A horizontal rectangle bounded by nearly parallel support (bottom) and resistance (top) trendlines.
Minimum Length : 5 weeks
Maximum Length : 65 weeks
Depth : < 15%
Pivot Point : Left-side high of base
i.ibb.co i.ibb.co
Cup Base
Shape : A smooth, rounded “U” curve.
Minimum Length : 6 weeks
Maximum Length : 65 weeks
Minimum Depth : 8%
Maximum Depth : 50%
Pivot Point : Left-side high of base
i.ibb.co i.ibb.co
Sauce Base
Shape : A very gradual, broad “U” curve, often taking more length than cup bases.
Minimum Length : 6 weeks
Maximum Length : 65 weeks
Minimum Depth : 8%
Maximum Depth : 50%
Pivot Point : Left-side high of base
i.ibb.co i.ibb.co
Cup with Handle Base
Shape : A “U”‐shaped cup followed by a smaller downward-sloping flag or channel (the handle).
Minimum Length : 6 weeks
Maximum Length : 65 weeks
Minimum Depth : 8%
Maximum Depth : 50%
Pivot Point : High of the handle
i.ibb.co i.ibb.co
Saucer with Handle Base
Shape : Similar to cup with handle, but cup looks like the saucer base.
Minimum Length : 6 weeks
Maximum Length : 65 weeks
Minimum Depth : 8%
Maximum Depth : 50%
Pivot Point : High of the handle
i.ibb.co
Ascending Base
Shape : An upward-sloping channel or wedge with 3 pullbacks. Each pullback low should be higher than the previous one. It needs around 20% increase from a base to the other.
Minimum Length : 8 weeks
Maximum Length : 16 weeks
Minimum Depth : 8%
Maximum Depth : 50%
Pivot Point : Left-side high of third base
i.ibb.co i.ibb.co
Consolidation Base
Shape : Similar to flat base, but wider and fails to form any of the above bases.
Minimum Length : 8 weeks
Maximum Length : 16 weeks
Minimum Depth : 8%
Maximum Depth : 50%
Pivot Point : Left-side high of base
i.ibb.co i.ibb.co
- Base Stages
Once a stock has completed its initial 30% run-up and formed its first base, that pattern is labeled Stage 1.
After a breakout from Stage N, the stock must rally at least 20% above the Stage N pivot (the base’s resistance point). If it does, the next valid base becomes Stage N + 1.
When a breakout fails to advance at least 20% a base on base forms. This is considered an extension for the current base stage, and a letter is assigned after the stage number.
When a breakout fails and the price undercuts the low for the previous base, the base stages reset, and a rally of 30% will be needed to form a new stage 1 base.
Note that for IPO stocks, a 30% increase is not required to form the first base. As soon as it meets any of the shape of any of the available bases, it will be drawn.
- Base statistics
To help you determine how healthy is a base, some statistics are available when you hover on the small dot shown above the high-left side of each base.
i.ibb.co
Base : The specific pattern type (Flat, Cup, Sauce, etc.).
Stage : The stage number of the base (1, 2, 3 …) and, in parentheses, how many distinct bases have formed since the very first base (including base-on-base like 1a, 1b, etc.).
Pivot : The resistance level that defines the top of the base. A close above this price often signals a valid breakout and a potential entry point.
Length : The number of bars (days on a daily chart; weeks on a weekly chart) between the start of the base and the bar immediately before breakout. (The initial bar and the breakout bar themselves are not counted.)
Depth : How far, in percentage terms, the low of the base has fallen below its left-side high.
Prior Uptrend : The percent gain from the pivot of the previous base up to the start of the current base.
Blue/Red Count : The number of up days (Blue) and down days (Red) during the base where volume was above the 50-period moving average.
Price % : The percent change from the close at the end of the base to the close at the breakout bar.
Volume % : The percent difference between the volume on the breakout bar and the 50-period average volume at the end of the base.
2. ANT Indicator (David Ryan)
The ANT indicator, developed by David Ryan, is a momentum-based signal used to identify high-potential breakout candidates during a stock’s run-up phase. It complements the base patterns by flagging moments of unusually strong price and volume activity within an uptrend, helping confirm emerging strength before or during a base formation.
i.ibb.co
3. Key Price Levels (Pivots)
Plots recent pivot-based support and resistance levels.
i.ibb.co
4. Index Line Overlay
Overlays a chosen index (e.g. SPX) on the top portion of the chart to compare relative performance.
i.ibb.co
5. Relative Strength (RS) Line
Plots the price ratio of the symbol vs. an index (e.g. SPX) to identify outperformance.
i.ibb.co
6. Moving Averages (SMA & RS-MA)
Allows up to four simple (or exponential) moving averages on price (daily/weekly) and three on the RS line.
7. Earnings Line & EPS Change
Marks earnings events on daily/weekly charts and optionally plots YoY EPS change in a lower portion of the chart. The earnings line also shows a projection to estimated earnings. To maintain alignment with the price chart, the line and YoY EPS data are limited to the most recent 28 quarters on weekly charts and 8 quarters on daily charts. For analyzing older data, you can use the replay feature.
i.ibb.co
8. Bars
Since Trading View displays very thin bars when zoomed out, I added 2-pixel-wide vertical lines over the bars to make them easier to see.
9. Dark Theme
I added this for a quick workaround to adapt colors for dark theme. Enabling this overrides any custom settings. Uncheck to customize colors.
i.ibb.co

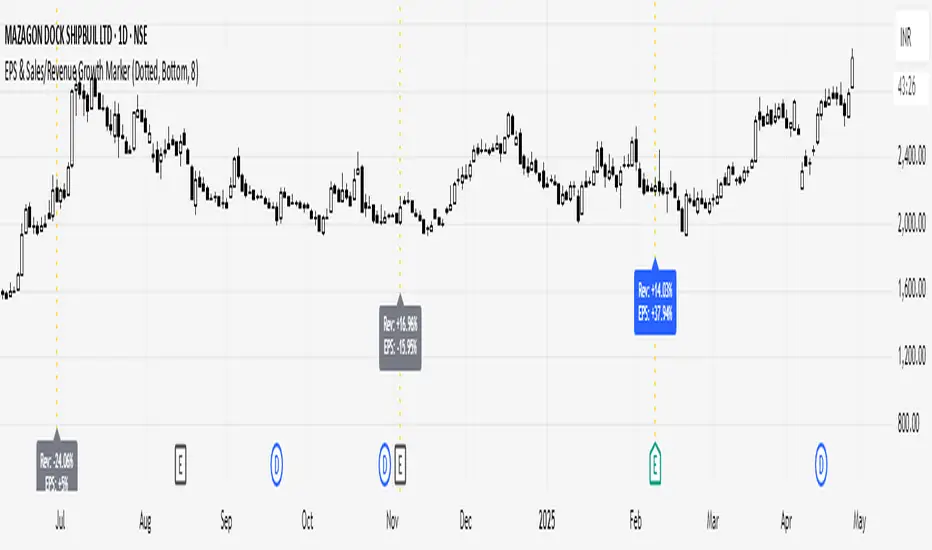
EPS & Sales/Revenue Growth MarkerThis script plots the Revenue Growth and EPS Growth % on Earnings Date.
Idea Credit: Special thanks to @dharmeshrbhatt for inspiring the concept behind this tool.
Developed and Published by learningvitals.
Plots Revenue Growth % and EPS Growth % on earnings date.
Choose label position: Above Bar, Below Bar, Top, or Bottom.
Customizable growth colors based on combined EPS and Revenue performance.
Customizable line style and colors.
Controls max number of labels to keep the chart clean.
Earnings Gap UpsBased on research conducted by John Pocorobba and Jason Thompson, the Earnings Gap Ups Indicator is designed to identify three types of earnings gaps, key levels, and the "alpha window"—a period when stocks often outperform following a gap. These gaps are frequently observed in high-performing stocks.
What is an Earnings Gap?
An earnings gap occurs when a stock's price makes a significant jump, after the company reports earnings signifying the street (institutions) were caught off guard.
The three different types of gaps are as follows: [/b
PEG (Power Earnings Gap)
Price gain of 10% or more
Volume is greater than 200% above the 50-day average
EPS surprise of at least 20%
Monster Gap
Price gain of 20% or more
Volume is greater than 300% above the 50-day average
No fundamental requirement
Monster Peg
Price Gain of 20% or more
Volume is greater than 300% above the 50-day average
EPS surprise of at least 20%
Key Levels and the Alpha Window
In addition to spotting these gaps, the indicator marks key levels on the chart and extends them through the alpha window, which represents the time period when the stock tends to outperform after the gap.
Key levels include:
High volume close: The closing price on a day with unusually high trading volume
High volume close minus 5%: A potential support level below the high volume close
Gap day high: The highest price reached on the gap day
Gap day low: The lowest price reached on the gap day
By understanding and tracking these gaps and levels, traders can map out a playbook for trading earnings gaps.

Earning, Sales, and PriceThis Pine Script indicator is designed to visualize and analyze the growth of Earnings Per Share (EPS) and Sales for a given stock over specified time periods. With a user-friendly interface, it allows traders and investors to monitor key financial metrics, helping them make informed decisions based on company performance.
The script presents earnings, sales, and price growth in a clear tabular format directly on the price chart. It features two distinct tables: one for annual data and another for quarterly metrics. For each financial metric, the script calculates and displays growth figures by comparing the current results with either the previous quarter's numbers or the previous year's figures. Additionally, it showcases the stock price along with the corresponding growth between these two data points, providing a comprehensive view of the stock's performance over time.
How to Use:
Typically, growth stocks will rally for a few quarters. However, after significant rallies, the stock needs rest. During this period, the stock will either consolidate or slide down slowly to take support at the key moving average. Importantly, during this time, sales and earnings may continue to grow while the stock is still consolidating.
Typically, after the stock consolidates significantly—even when sales and earnings numbers are increasing—the stock will finally start the next leg of the rally just before the next earnings date or immediately after the earnings report.
For this purpose, the script shows the EPS and sales growth. Additionally, the script displays the price when the previous earnings were declared along with the price growth. This data can be used to find patterns in the stock's behavior. Utilize this indicator to analyze growth patterns and make informed trading decisions based on historical performance and upcoming earnings expectations.
Key Metrics Analyzed:
Earnings Per Share (EPS): Monitors the diluted earnings per share to evaluate company profitability.
Total Revenue: Analyzes sales performance, providing insights into overall revenue generation.
Price Growth: Tracks changes in stock price alongside EPS and sales for comprehensive performance assessment.
Usage:
Ideal for investors and traders looking to evaluate company growth potential and make data-driven decisions.
Use in conjunction with other technical analysis tools for a holistic approach to stock analysis.

Performance IndicatorsDescription:
The Performance Indicators tool provides traders with a comprehensive overview of both fundamental and technical performance metrics of a security. This dual approach helps traders make informed decisions by evaluating the security's intrinsic value as well as its market behavior.
Fundamental Performance Indicators:
EPS Year Over Year % Growth : Measures the percentage growth in earnings per share (EPS) compared to the same quarter in the previous year. This helps in understanding the company's profitability trends.
EPS 3 Quarters Year Over Year % Growth : Analyzes the percentage growth in EPS over the last three quarters compared to the same quarters in the previous year, providing insight into the company's recent earnings performance.
Sales Year Over Year % Growth : Tracks the percentage growth in sales compared to the same quarter in the previous year, offering a view of the company's revenue trends.
Sales 3 Quarters Year Over Year % Growth : Evaluates the percentage growth in sales over the last three quarters compared to the same quarters in the previous year, helping to assess the company's recent revenue performance.
Return On Equity (ROE) : Measures the company's profitability by comparing net income to shareholder equity. This indicates how effectively the company is using its equity base to generate profits.
Market Capitalization : Represents the total market value of the company's outstanding shares, providing a sense of the company's size and market presence.
Float Shares Outstanding : Refers to the number of shares available for trading by the public, excluding restricted shares. This metric helps in understanding the liquidity and volatility of the stock.
Technical Performance Indicators:
Average Daily Range (ADR) %: Calculates the average range between the high and low prices over a specific period, expressed as a percentage. This helps in understanding the stock's daily volatility.
Average True Range (ATR) $ : Measures market volatility by calculating the average range between the high and low prices, taking into account any gaps in the price. It is expressed in dollar terms.
% Off 52-Week High : Indicates how far the current price is from the highest price achieved over the last 52 weeks, helping to assess the stock's current performance relative to its yearly peak.
Relative Price Strength (RPS) : Compares the stock's price performance to a benchmark index, helping to identify how the stock is performing relative to the broader market.
How it Works:
The fundamental performance indicators provide insights into the company's financial health and growth trends by analyzing key metrics such as EPS, sales growth, ROE, market capitalization, and float shares outstanding.
The technical performance indicators offer a view of the stock's market behavior and volatility through metrics like ADR, ATR, % off 52-week high, and RPS.
By combining these fundamental and technical metrics, traders can gain a well-rounded perspective on the security's overall performance.
How to Use:
Add the Performance Indicators tool to your chart.
Evaluate the fundamental indicators to assess the company's financial health and growth trends.
Analyze the technical indicators to understand the stock's market behavior and volatility.
Use the combined insights from both fundamental and technical indicators to make informed trading decisions.
This tool is particularly useful for traders who want to integrate both fundamental analysis and technical analysis into their trading strategy, providing a holistic view of a security's performance.
Earnings Line Pro - EPS Tracker [LevelUp]Earnings Line Pro plots quarterly earnings data, including earnings surprises and estimates, while also highlighting earnings acceleration. It allows you to track and visualize the trend of earnings across daily, weekly, and monthly timeframes.
🔹—— Key Features ——🔹
▪ Quarterly earnings per share, surprises and estimates.
▪ View earnings based on type: reported (non-GAAP), basic or diluted.
▪ Visualize the estimated trajectory of the next quarter earnings estimate.
▪ Year-Over-Year (YOY) data is included for each quarterly earnings summary.
▪ Visualize earnings acceleration, quarter over quarter.
▪ Plot on daily, weekly and monthly timeframes.
🔹—— Earnings Data ——🔹
Earnings are a foundational concept in stock analysis, often exerting a significant influence on a company's long-term performance. By visualizing earnings data as a plot rather than just a table of statistics, investors can more easily spot patterns of acceleration or deceleration. For instance, a steep upward slope between earnings releases — or a sequence of progressively higher earnings — signals a robust earnings trajectory. The sharper the acceleration, the greater the likelihood that the stock will outperform the broader market.
Historical studies show that top-performing companies consistently deliver steady earnings growth. Whether your focus is short-term trading or long-term investing, recognizing the direction and rate of earnings growth is essential for evaluating potential price movement.
While quarterly earnings data remains consistent across all timeframes, the perspective shifts depending on your goals. A monthly chart highlights multi-year growth and is ideal for investors with a buy-and-hold mindset. In contrast, weekly or daily charts have fewer data points, making them better suited for traders focused on positions lasting weeks or months.
🔹—— Choose Earnings Type ——🔹
With the Earnings Line indicator, you can view reported (non-GAAP), basic and/or diluted earnings.
▪ Reported (non-GAAP) earnings typically refer to a company’s net income as disclosed in its financial statements. This figure represents overall profitability after accounting for all expenses, taxes, and adjustments.
▪ Basic earnings per share (EPS) is calculated by dividing net income by the weighted average number of common shares outstanding during the reporting period. It provides a straightforward measure of earnings attributable to each existing share.
▪ Diluted earnings per share (EPS) goes a step further by incorporating the potential impact of additional shares from convertible securities, stock options, or warrants. This presents a more conservative, “what-if” scenario that assumes all possible dilution has occurred.
Reviewing these various types is important as they provide a bigger picture view of company performance: reported earnings show overall profitability, basic EPS reflects earnings per existing share, and diluted EPS highlights the potential impact of share dilution.
In the Settings dialog, select your preference on the earnings type. Check the box "Show Data For All Earnings Types" to view all types when hovering over an earnings data point.
🔹—— Year-Over-Year Data ——🔹
Viewing year-over-year (YOY) data for earnings is essential because it provides a clear picture of a company's growth trajectory by comparing current earnings to the same period in the prior year, helping to identify sustainable trends rather than short-term anomalies.
This metric helps eliminate seasonal fluctuations, offering a more accurate assessment of operational performance and efficiency improvements over time. Additionally, consistent YOY earnings growth can signal a company's competitive strength and potential for stock price appreciation, aiding in informed investment decisions.
🔹—— Earnings Acceleration ——🔹
Looking for earnings acceleration — where the rate of earnings growth is increasing — helps identify companies with strengthening momentum. This often reflects improving business operations, market expansion, or competitive advantages that can drive outsized returns. Viewing acceleration data can help you spot potential leaders early while avoiding stocks with flat or slowing earnings that may underperform the market.
🔹—— Visualize Earnings Estimate ——🔹
At a glance, view the next-quarter estimate to gauge the likely direction of the earnings trend. These forward-looking insights provide an early view of a company’s expected financial performance and can help anticipate potential stock price movements depending on whether actual results meet, exceed, or miss expectations.
The estimates — often based on analyst consensus — reflect market sentiment and can highlight both growth opportunities and risks.
🔹—— Plot Earnings Line On Main Chart ——🔹
By default, earnings data is plotted in a separate pane below the main chart. Follow the steps below to plot the earnings line on the main chart.
▪ Click on the indicator name on left side of the chart.
▪ Select the "..." option.
▪ Use the "Move-to" option to change the location of the earnings line.
▪ To hide the EPS scale on the left, select the "..." option.
▪ In "Pin to scale" select the "No scale (fullscreen)" option.
🔹—— Best Practices ——🔹
▪ Compare year-over-year, not just quarter-over-quarter as YOY changes help filter out seasonality.
▪ Positive surprises can spark strong price reactions, recurring surprises strengthen confidence.
▪ Look for divergence. If earnings accelerate but price lags, it may signal an early opportunity.
▪ Review daily, weekly, and quarterly charts to align short and long-term trends.
▪ Combine fundamentals with technicals, including volume analysis.
▪ Always define risk before entering a trade — know where you’ll exit.
▪ Size positions based on volatility and conviction, not emotion.
▪ Be patient — trends take time to develop.
Script de pago