Engulfing CandlesticksThe Engulfing Candlesticks indicator is a powerful tool for traders and investors to identify potential reversal patterns in financial markets. This indicator is based on the popular candlestick pattern recognition technique, which has been used for centuries to predict market trends and identify trading opportunities.
The Engulfing Candlesticks indicator specifically looks for two types of patterns: Bullish Engulfing and Bearish Engulfing. A Bullish Engulfing pattern occurs when a small bearish candle is followed by a larger bullish candle that completely engulfs the previous candle, indicating a potential reversal from a downtrend to an uptrend. On the other hand, a Bearish Engulfing pattern occurs when a small bullish candle is followed by a larger bearish candle that completely engulfs the previous candle, indicating a potential reversal from an uptrend to a downtrend.
The Engulfing Candlesticks indicator is designed to be easy to use and understand, even for traders who are new to candlestick pattern recognition. The indicator plots a yellow color for Bullish Engulfing patterns and a purple color for Bearish Engulfing patterns, making it easy to visualize and identify potential trading opportunities.
One of the key benefits of the Engulfing Candlesticks indicator is its ability to identify potential reversal patterns early, allowing traders to enter trades at the beginning of a new trend. This can be especially useful in markets that are highly volatile or subject to sudden changes in direction.
In addition to its ability to identify reversal patterns, the Engulfing Candlesticks indicator can also be used as a confirmation tool for other trading strategies. For example, a trader who is using a moving average crossover strategy may use the Engulfing Candlesticks indicator to confirm the validity of the signal.
The Engulfing Candlesticks indicator is also highly customizable, allowing traders to adjust the sensitivity of the indicator to suit their individual trading style. This can be especially useful for traders who are looking to trade in specific market conditions, such as during times of high volatility or in markets with low liquidity.
Overall, the Engulfing Candlesticks indicator is a powerful tool for traders and investors who are looking to identify potential reversal patterns and trading opportunities in financial markets. Its ease of use, customization options, and ability to identify early reversal patterns make it a valuable addition to any trading strategy.
Here are the settings for the Engulfing Candlesticks indicator:
Length: This setting determines the number of bars used to calculate the engulfing pattern. A higher value will result in more precise signals, but may also reduce the number of signals generated.
Color 0: This setting determines the color used for Bullish Engulfing patterns.
Color 1: This setting determines the color used for Bearish Engulfing patterns.
Bar Color: This setting determines whether the indicator will color the bars based on the engulfing pattern.
Alerts: This setting determines whether the indicator will generate alerts when an engulfing pattern is detected.
Note: These settings may vary depending on the specific trading platform or software being used.
Engulfingbearish

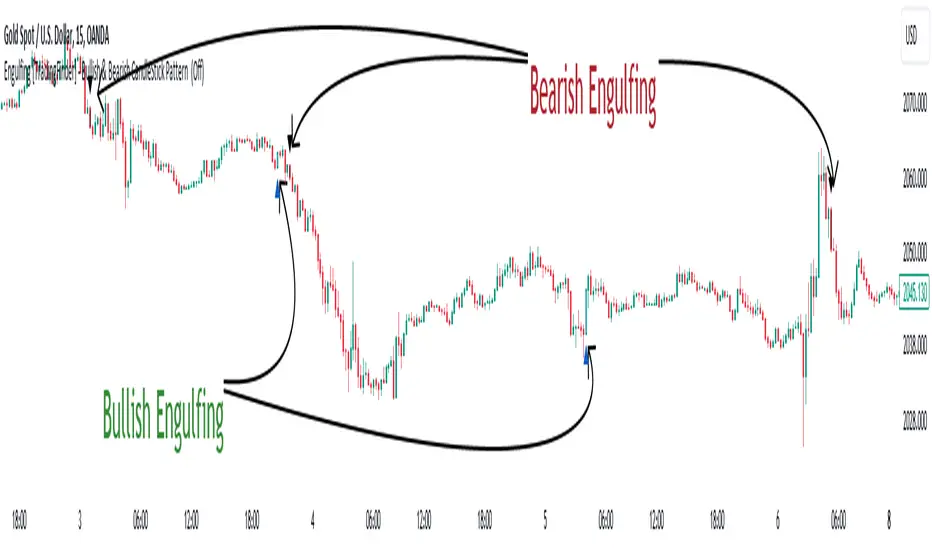
Engulfing [TradingFinder] Bullish & Bearish CandleStick Pattern🔵 Introduction
The candlestick engulfing pattern is important pattern in technical analysis that can be observed in candlestick charts. This pattern occurs when a complete candle engulfs or "engulfs" the body of a previous candle, meaning that the body of the new candle completely covers the body of the previous candle.
The candlestick engulfing pattern has two types: the bullish engulfing pattern and the bearish engulfing pattern.
• Bullish Engulfing Pattern: This pattern occurs when a market candle opens with a larger and higher body than the previous market candle and completely covers the body of the previous candle. This pattern may indicate the presence of strong buying pressure and a potential change in price direction upwards.
• Bearish Engulfing Pattern: This pattern occurs when a market candle opens with a larger and lower body than the previous market candle and completely covers the body of the previous candle. This pattern may indicate the presence of strong selling pressure and a potential change in price direction downwards.
The candlestick engulfing pattern is usually used as a valid signal for a change in price direction in the market and can enhance a combination of crossover investments and technical analysis. However, it should always be evaluated alongside other indicators and market factors, and counter decisions should be made accordingly.
🔵 Recognition Method
Correct, the candlestick engulfing pattern is one of the important patterns in technical analysis that is typically used as a strong signal for a valid change in price direction in the market. This pattern occurs when a candle (usually in the market) opens with a larger and higher (for bullish engulfing pattern) or lower (for bearish engulfing pattern) body than a previous market candle and completely covers the body of the previous candle.
Example of Bullish Engulfing Pattern:
• First Candle: A bearish (downward) candle with a small red body.
• Second Candle: A bullish (upward) candle with a larger body that completely covers the body of the previous candle.
This pattern may indicate a change in price direction from downward to upward.
Example of Bearish Engulfing Pattern:
• First Candle: A bullish (upward) candle with a small green body.
• Second Candle: A bearish (downward) candle with a larger body that completely covers the body of the previous candle.
This pattern may indicate a change in price direction from upward to downward.
The most important point is that the candlestick engulfing pattern should be carefully considered and always evaluated alongside other market indicators and overall conditions. For example, the engulfing pattern near important support or resistance levels, during significant market command changes, or accompanied by other technical signals can have greater signaling power.
🟣 "Bullish Engulfing" Candle
• The first candle is bullish and the second candle is bearish.
• At the end of a downtrend.
• The closing of the first candle is above the opening of the second candle.
• The high of the first candle is higher than the high of the second candle.
Optimal Condition:
• The closing of the first candle is higher than the high of the second candle.
• More than 80% of the first candle is bullish.
🟣 "Bearish Engulfing" Candle
• The first candle is bearish and the second candle is bullish.
• At the end of an uptrend.
• The closing of the first candle is below the opening of the second candle.
• The low of the first candle is lower than the low of the second candle.
Optimal Condition:
• The closing of the first candle is below the opening of the second candle.
• More than 80% of the first candle is bearish.
🔵 Settings
The "Engulf Filter" option allows the "Optimal Condition" to be executed and will show fewer candlesticks.
🔵 Status
Off: Default mode, showing more identifications.
• Green color indicates optimal "Bullish Engulfing" candles.
• Red color indicates optimal "Bearish Engulfing" candles.
On: By changing the default to "On," the number of identifications decreases and the optimal condition is applied.
• Blue color indicates "Bullish Engulfing" candles.
• Black color indicates "Bearish Engulfing" candles.
🟣 Important Note
"Engulfing" candles are very useful signals in the direction of the overall trend, but we do not expect a suitable movement from "Engulfing" candles against the trend.
Engulfing IndicatorThis is an "Engulfing" indicator. The "Engulfing" candle pattern is a reversal pattern that can appear at the end of an uptrend or downtrend.
The indicator includes the following inputs or settings:
1. `tolerance`: This defines the percentage difference in size that there must be between the body of the current candle and that of the previous candle to consider that one candle "engulfs" the other.
2. `tailSizePercentage`: This defines the maximum percentage size of the candle's tail in relation to the body of the candle for it to be considered valid.
3. `hideBuy` and `hideSell`: If set to true, they hide the buy and sell labels on the chart.
4. `checkTailSize` and `checkPrevTailSize`: If set to true, they check the size of the tail of the current and previous candle in relation to the body of the candle. If the tail is too large (as defined by `tailSizePercentage`), it is not considered valid.
The indicator works as follows:
First, it calculates the size of the body of the current and previous candle. Then, it checks if the current candle is green (close greater than open) or red (close less than open).
Next, it checks if the current candle "engulfs" the previous one. This means that, in the case of a green candle, the open must be less than or equal to the previous candle's close and the close must be greater than or equal to the previous candle's open. For a red candle, it's the other way around.
The indicator also checks if the size of the previous candle's body is at least a certain percentage (defined by `tolerance`) of the size of the current candle's body.
If `checkTailSize` or `checkPrevTailSize` is enabled, the indicator also checks the size of the tail of the current and/or previous candle. If the tail is too large in relation to the body of the candle (as defined by `tailSizePercentage`), the candle is not considered valid.
Finally, if all conditions are met, a buy or sell signal is generated and a label is drawn on the chart. An alert is also generated.

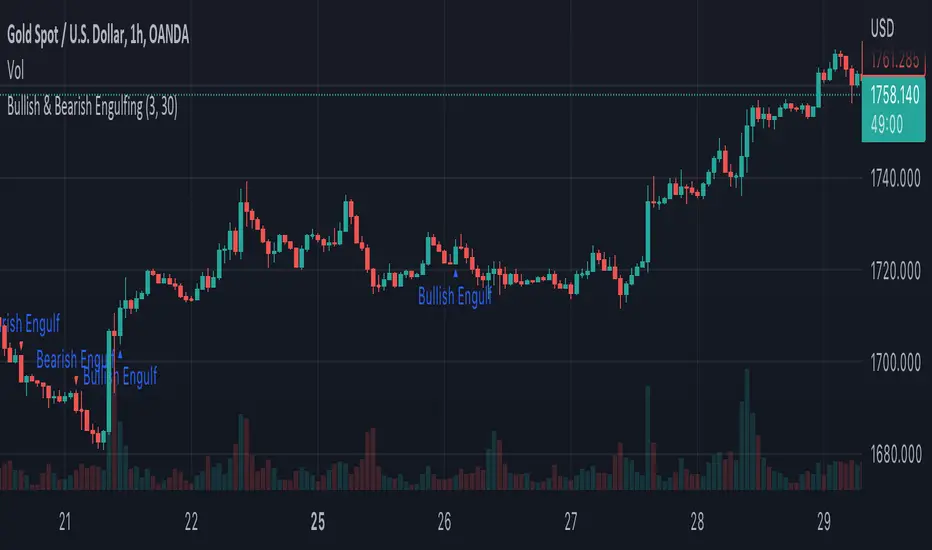
Bullish & Bearish EngulfingA simple script to filter out bullish and bearish engulfing candles. Size of candles can be filtered.
Candlestick PatternsCandlestick Patterns
- Candlesticks are graphical representations of price movements for a given period of time.
- There are candlestick patterns that try to predict the final direction, caused by pressure between buyers and sellers.
As a general recommendation, use the candlestick patterns in the same direction of the current trend (continuations),
for reverse patterns we must expect the price to be over extended, for example,
that it is the highest or lowest value of (20-50) periods,
or that the RSI is overbought or oversold (14-50),
or that the price is far from its standard deviation.
- This indicator allows you to view more than 20 different patterns, some of them:
Doji
Engulfing
Hammer
Shooting Star
Inverted Hammer
Hanging Man
Morning Star
Evening Star
etc...
- The indicator allows displaying the full name of the pattern
- It allows you to view the labels at the top of the chart, to avoid this affecting the technical analysis

CryptoSignalScanner - Double High/Low & Engulfing IndicatorDESCRIPTION:
This script has been designed to show the double high/low candle patterns and the Engulfing candles patterns.
• This scripts is based on RSI length.
• It displays a label when a Double High or Double Low candle pattern is detected.
• It displays a label when a Bullish Engulfing or Bearish Engulfing candle pattern is detected.
• It is also possibility to set a Double High/Low, Double High, Double Low, Bullish/Bearish Engulfing, Bullish Engulfing, or Bearish Engulfing alert.
HOW TO USE:
• When a Double High signal appears it means that we have probably or temporarily stopped the uptrend and could see a reversal. Most likely we will see a downtrend from here.
• When a Double Low signal appears it means that we have probably or temporarily stopped the downtrend and probably could see a reversal. Most likely we will see an uptrend from here.
• When a Bullish Engulfing candle appears it means that we probably made a reversal to the upside. Bullish Engulfing patterns are more likely to signal reversals when they are preceded by three or more red candlesticks.
• When a Bearish Engulfing candle appears it means that we probably made a reversal to the downside. Bearish Engulfing patterns are more likely to signal reversals when they are preceded by three or more green candlesticks.
• Wait for a clear reversal to buy or to sell. Use the Fibonacci tool together with the Eliot Waves to help you with this.
FEATURES:
• You can show/hide the labels based on RSI length and high/low input values.
• You can show/hide the labels based on the % candle match.
• You can show/hide the Double High/Low labels.
• You can show/hide the Bullish/Bearish Engulfing labels.
HOW TO GET ACCESS TO THE SCRIPT:
• Use the link below to subscribe to our indicators.
REMARKS:
• This advice is NOT financial advice.
• We do not provide personal investment advice and we are not a qualified licensed investment advisor.
• All information found here, including any ideas, opinions, views, predictions, forecasts, commentaries, suggestions, or stock picks, expressed or implied herein, are for informational, entertainment or educational purposes only and should not be construed as personal investment advice.
• We will not and cannot be held liable for any actions you take as a result of anything you read here.
• We only provide this information to help you make a better decision.
• While the information provided is believed to be accurate, it may include errors or inaccuracies.
Good Luck,
The CryptoSignalScanner Team
