CryptoverseThis Indicator dynamically generates and charts Pivot Points, Support and Resistance Lines, Trend Channels and even Rsi Divergences in every market and every time period.
While it helps you identify your entry points, stop loss and take positions, it certainly does not include trading signals and trading strategy.
Bonus: the indicator contains ema21, ema50, ema100 and ema200 to support the lines created. If you wish, you can change the EMA values in the settings.
Recommendation: RSI is included in the indicator codes in order to detect divergences dataally, but it is not displayed on the chart. I recommend adding an additional RSI indicator to keep track of past and current potential divergences.
USER MANUAL:
----------------------------------------------
General Settings:
Pivot Period: This field determines how many candles before and after a candle should be controlled in order to be able to determine the top and bottom points on the chart.
Support and Resistance Lines and Trend Channels formed on the chart are created by calculating the Pivot points formed according to the period determined here. (Default value: 6)
Pivot Source: Determines the pivot points to be created according to the value of the relevant candle.
(Default and Recommended: closing)
----------------------------------------------
Support And Resistance Settings:
Custom Bars Back: This area allows you to specify how many pivot points from the current candle to the previous candle to create support resistance lines on the Chart. The default value is the last 500 candles.
*Note: The more old candles are checked, the more support and resistance lines will appear. This may prevent you from making sound determinations on the chart.*
Current Bar Decrease: This field works integrated with Custom Bars Back. By subtracting the current candle by the specified number, it provides the formation of lines without including those candles.
Default value: It is set to 0 to include current data.
Example: If Custom Bars Back: 500 and Current Bar Decrease: 10, Support and Resistance lines are created by considering 500 candles before the last 10 candles without including the last 10 candles on the chart.
Show S/R Lines: This field allows you to show or hide the Support and Resistance lines at any time.
Auto Simplification: This field is marked by default. It allows the Simplification Steps value to be determined automatically within the code according to the time period and current volatility of the relevant parity. (It is recommended to use the default version.)
Simplification Steps: This field allows you to get more understandable lines by simplifying the Support and Resistance lines based on Pivot points. If a simplification is not done, the lines to be formed with only the pivot points will be too many and this creates a dirty and useless appearance on the chart.
Each 1 digit you enter as a step combines the lines that are close to each other at a value of 0.01% and creates a common line.
Example: If you enter the number 10 as Steps, it will form a single common line from lines close together, starting at 0.01% respectively. It will continue to increase by 0.02%, 0.03%, 0.04% in its next steps. For the number 10, it will complete its loop by combining lines within the last remaining lines that are as close as 0.1% to each other and creating new lines from their midpoints.
The deafult value is 14. (Max. simplifies lines with closeness up to 1.4%.)
Important Note: If Auto Simplification is on, the entered value has no meaning. The Indicator performs simplification operations automatically. If you want to manage these steps manually, you can turn off Auto Simplification and enter your own value.
S/R Lines Color: Allows you to specify the color of the lines.
Label Location: Allows you to determine how many candles ahead the information label formed for each line will be positioned.
Line Label Descriptions:
Line: It is the price value that the line coincides with.*
Distance: Shows the percentage distance of the line from the current price.
▲ : Shows the percentage distance from the line above it.
▼ : Shows the percentage distance from the line below it.
Strength: Indicates the total number of steps the process has taken during the simplification process. The height of the number indicates the strength of resistance and support in the close price range.
C. Width: stands for Channel Width. It shows the percentage value between the highest price and the lowest price on the past candle as many candles specified by Custom Bars Back.
S. Steps: stands for Simplification Steps. Indicates the number of simplification steps applied. A value of 150 in the image indicates that a 1.5% simplification range has been applied.
----------------------------------------------
Trend Channels Settings:
Show All Trend Lines: Allows you to show and hide trend channels.
Hide Old Trend Lines: If you enable it, it will hide channels created in the past except for Current Trend channels.
Helper Line Format: Allows the auxiliary line that converts a trendline to a channel to be drawn based on percentage or price.
Note: There may be cases where the auxiliary lines do not provide full parallelism when using large time intervals by preferring a percentage.
Up Trend Color: Indicates the color of the Up Trend channel.
Down Trend Color: Specifies the color of the Downtrend channel.
Show Up Trend Overflow, Show Down Trend Overflow:
When the price closes above or below the trend channels, it provides awareness with the help of a text on the chart. Colors can be adjusted according to preference.
----------------------------------------------
RSI Divergences Settings:
This indicator gives you information about 4 different divergences. You can customize the divergence views with the show and hide options.
Bullish Regular, Bullish Hidden, Bearish Regular and Bearish Hidden.
Green divergences from the bottom of the graph represent bullish, and red divergences above the graph represent bearish.
Important note: Seeing a mismatch label definitely indicates that there is a mismatch between prices and rsi, but a mismatch does not always indicate a change in price.
Potential Divergence:
The indicator not only shows you past divergences, but also informs you of potential divergences based on the current status of the chart.
A potential divergence may not turn into a true one if the price flow continues to increase or decrease in the same direction. But all divergences seen in the past must have been shown as potential divergences beforehand.
Rsi Length, Rsi Source: Allows you to change settings for RSI values typically embedded within the indicator.
Note: Pivot Source and RSI Source using the same type of candle data ensures that divergences are displayed correctly.
----------------------------------------------
EMA Settings:
The indicator allows you to use 4 different EMA data in addition to Support and Resistance lines, Trend Channels and RSI divergences. By default, 21, 50, 100 and 200 are used. You can change the EMA values and colors in the Settings section, or you can use the show hide options in the Style section.
EMAS

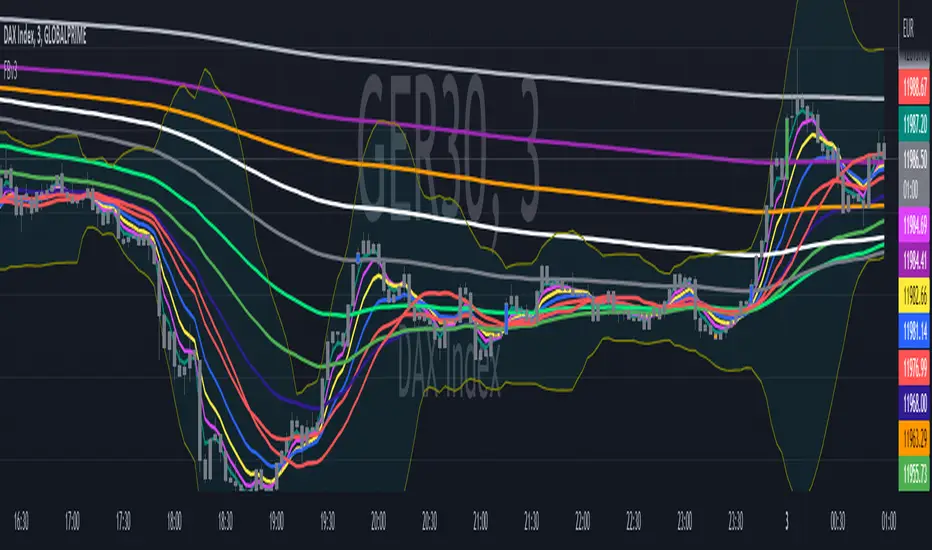
RAINBOW_13thHi Dears!
hereby, I present you one of my indicators which is a kind of artistic indicator.
It calculates different ranks of functions and based on them suggests a buy or sell order which is depicted on right-side separately.
Inputs:
(For calculating)
+Source:
+Length: Number of previous bars in calculation
+Topology:
++EMA
++RMA
++SMA
++RSI
+OVER BOUGHT RSI: Define your boundary for overbought in RSI-TOPOLOGY.
+OVER SOLD RSI: Define your boundary for oversold in RSI-TOPOLOGY.
(Visual)
+Transparency: affect colors of rainbow!
Wish you good deals!
BY USING PLZ DO NOT FORGET TO BOOST IT!
Shakib.

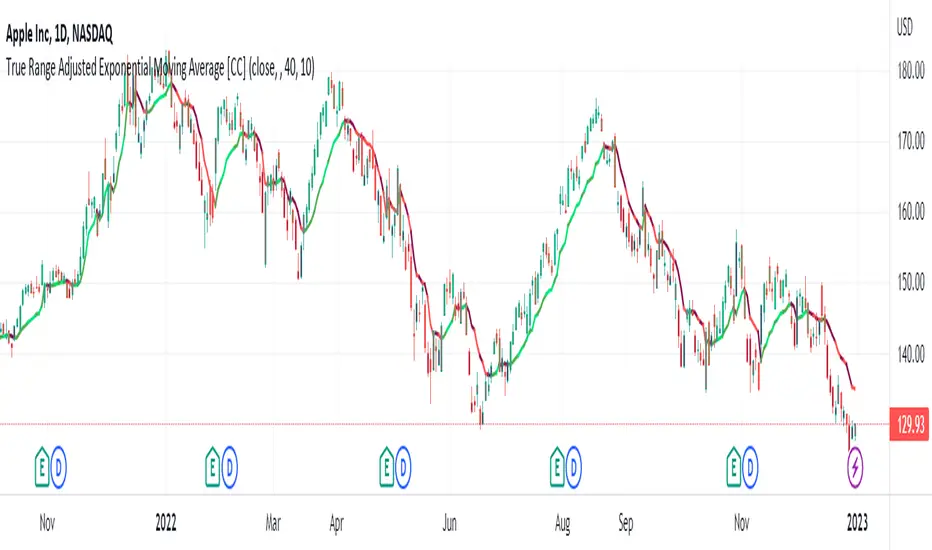
True Range Adjusted Exponential Moving Average [CC]The True Range Adjusted Exponential Moving Average was created by Vitali Apirine (Stocks and Commodities Jan 2023 pgs 22-27) and this is the latest indicator in his EMA variation series. He has been tweaking the traditional EMA formula using various methods and this indicator of course uses the True Range indicator. The way that this indicator works is that it uses a stochastic of the True Range vs its highest and lowest values over a fixed length to create a multiple which increases as the True Range rises to its highest level and decreases as the True Range falls. This in turn will adjust the Ema to rise or fall depending on the underlying True Range. As with all of my indicators, I have color coded it to turn green when it detects a buy signal or turn red when it detects a sell signal. Darker colors mean it is a very strong signal and let me know if you find any settings that work well overall vs the default settings.
Let me know if you would like me to publish any other scripts that you recommend!
Delox EMA CrossThis indicator works with the change of trend of emas
When the fast 14 crosses above the 21 this is an uptrend.
and when the slow ema of 21 crosses below the slow ema of 14 then we have a downtrend.
It is accompanied by the Stochastic indicator that when there is a cross of Emas will give a bullish or bearish signal.
Bearish signal
When the D-stochastic or the Orange line of the stochastic is greater than 60 and there is a trend reversal crossover it will give a bearish signal painted on the background of the chart.
Bullish signal
When the stochastic D which is the orange line of the stochastic is less than 30 and has a line crossing on the lines it will give a bullish signal.
White bar
White bar appears when there is a change in trend between ema 14 and ema 21.
Remember this is not an investment recommendation this script is for educational purposes only.
If you like the script please follow me this helps a lot and you can also follow me this would help me a lot to keep uploading videos and new scripts for the community.

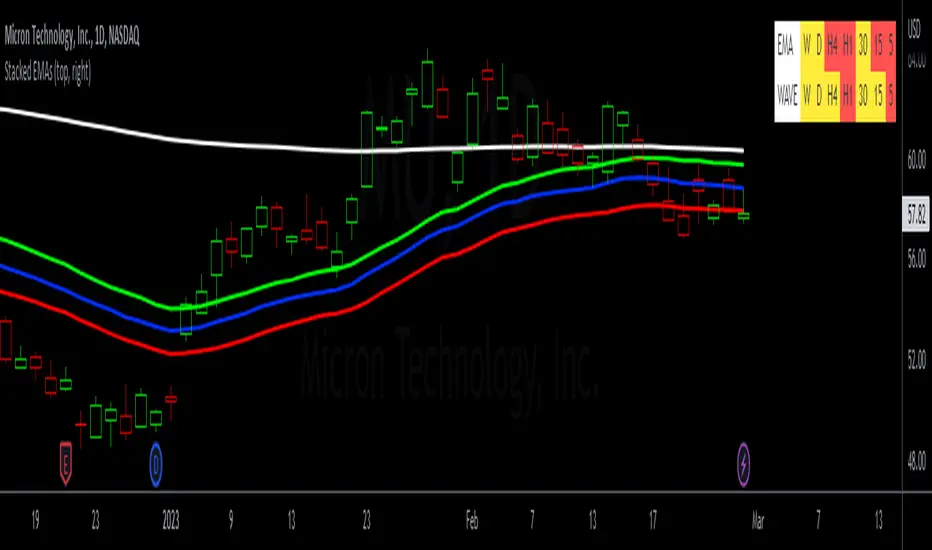
Sembang Kari Traders - EMA & Wave Stacked Labels + EMA 34 LinesThis script is 2 in 1 indicator.
1. Multi Timeframe EMA Labels
- This label indicator shows labels for EMA stacked up or EMA stacked down or EMA in sideway trend.
- EMA used in this script is EMA 8, EMA 21, EMA 34 and EMA 55.
- If the EMA 8 line is above EMA 21 line, and EMA 21 line is above EMA 34 line, and EMA 34 line is above EMA 55 line ( EMA STACKED UP) = the trend is BULLISH and the label will colored to GREEN on that timeframe.
- If the EMA 8 line is below EMA 21 line, and EMA 21 line is below EMA 34 line, and EMA 34 line is below EMA 55 line ( EMA STACKED DOWN) = the trend is BEARISH and the label will colored to RED on that timeframe.
- If either 1 of the EMA 8, or EMA 21, or EMA 34, or EMA 55 is NOT STACKED = the trend is SIDEWAY and the label will colored to YELLOW on that timeframe.
- Timeframe shows in label is Daily, 4 hours, 1 hour, 15 minutes and 5 minutes.
- This indicator labels will be useful to identifying trend in others timeframe without to look or open that other timeframe. Example, if u in 5 minutes timeframe chart, then u see that "D" is colored to GREEN, then straight will know that EMA 8, EMA 21, EMA 34 and EMA 55 is STACKED UP which means BULLISH without to look or open that Daily timeframe .
2. EMA 34 Lines
- This is indicator shows 3 exponential moving average line which is EMA 34 lines.
- This indicator will shows 3 lines which is GREEN, BLUE, and RED.
- The GREEN line is EMA 34 HIGH
- The BLUE line is EMA 34 CLOSE
- The RED line is EMA 34 BLUE
Trade Idea
- The idea using this indicator is we want to take an entry setup when the candle pull back to EMA 34 lines and at the same time using the EMA labels to be confirmation as label will indicates trends in multiple timeframe.
- When price moved far away from EMA 34 lines, then wait till price pullback to EMA lines and confirmed it by trend labels provided to take take a entry setup.
- this indicator can be used on all tickers
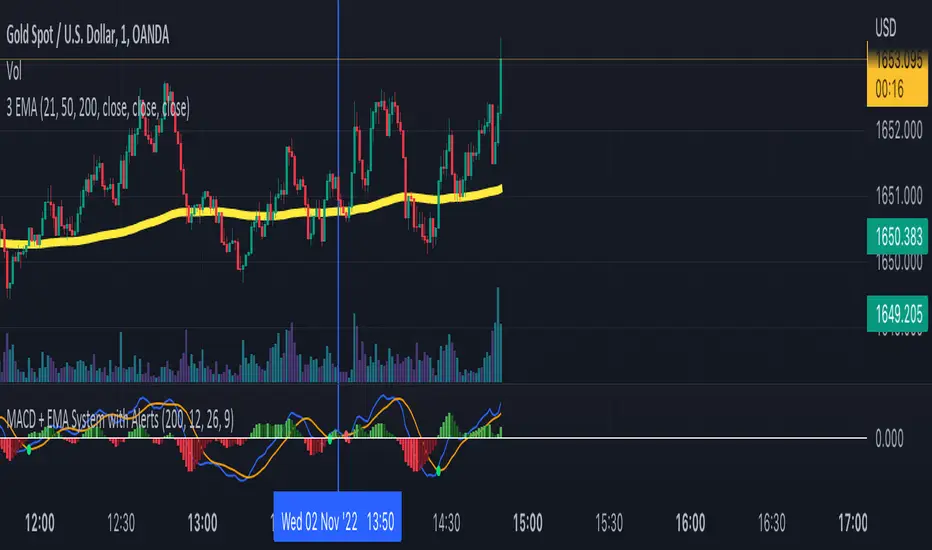
MACD + EMA System with AlertsSo I created the MACD Cross Strategy but not working alone by itself. I added EMA (Exponential Moving Average) filter to improve its winning rate so the MACD Signal only appears when in the same trend direction as Moving Average.
The Main Rules for Long Signal are:
- MACD Main Line Crossover the MACD Signal Line.
- The crossover happens below the MACD center line (0) so the momentum is strong.
- Price above the EMA 200 so it means the market is in a strong uptrend.
The Main Rules for Short Signal are :
- MACD Main Line Crossunder the MACD Signal Line.
- The crossover happens above the MACD center line (0) so the momentum is strong.
- Price below the EMA 200 so it means the market is in a strong downtrend.
The signal crossover & signal alert only generate as per the following rules above.
Abnormal bar % v.1This script helps you find abnormal bars on the charts.
An abnormal bar is a bar that is larger than the adjacent bar by at least 50 percent.
The script can search for bars on any time frame.
The search for an abnormal bar, is possible in two ways:
- on the absolute value, for example - all that is higher than 0.5% is considered an abnormal bar, on different timeframes it is necessary to change the percentage values;
- on the basis of the ATR, in my opinion it is a more objective result.
In the settings available:
- choice of color to display percentages on the screen;
- choice of calculation method;
- Selecting the value - what is considered an abnormal bar.
======
Данный скрипт помогает найти на графиках аномальные бары.
Аномальный бар - это бар который, больше рядом стоящего бара как минимум на 50 процентов.
Скрипт может искать бары на любом тайм-фрейма.
Поиск аномального бара, возможен в двух вариантах:
- по абсолютному значению, например - всё что выше 0.5%, считается аномальным баром, на разных тайм-фреймах нужно менять значения процентов;
- на основание ATR, на мой взгляд это более объективный результат.
В настройках доступно:
- выбор цвета для отображения процентов на экране;
- выбор способа поиска;
- выбор значения - что считаем аномальным баром.
==

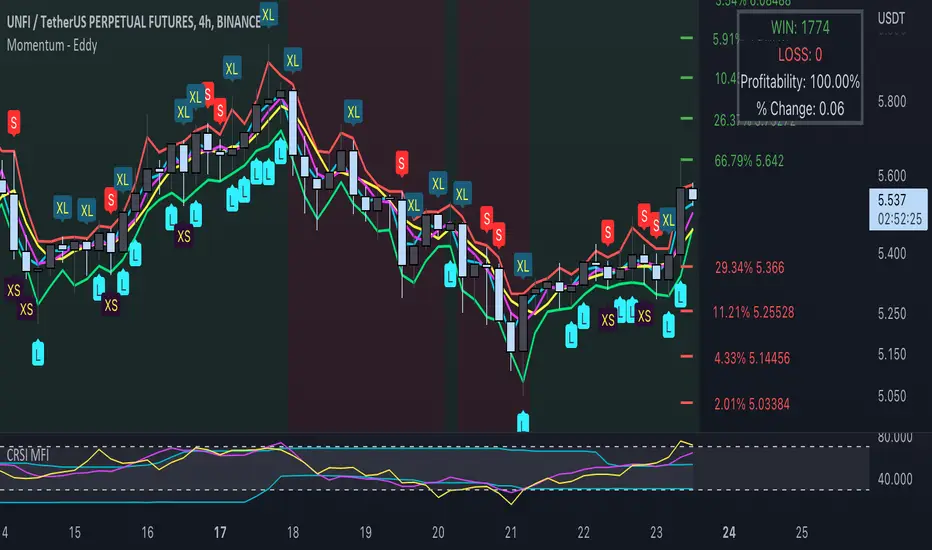
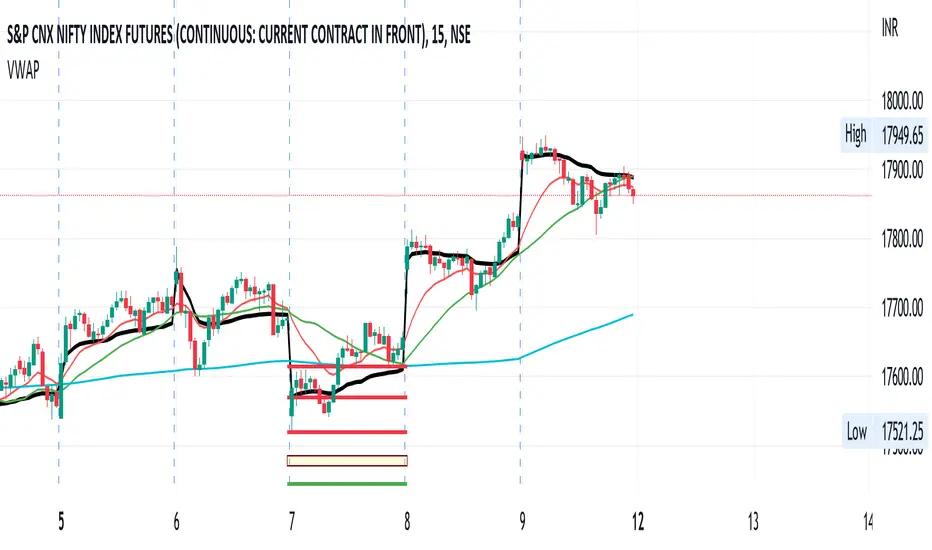
Momentum - EddyThis indicator uses momentum, emas, macd trend, probability to find the best entry for both long and short positions.
L = Long
When the low goes below the green line (ema fast low), close is above open and momentum is up
S = Short
When the high goes above the red line (ema fast high), close is below open and momentum is down
XS = Exit short at potential bullish pivot
When the low is below a red step (probability) and below ema fast low and both ema fast high and low are 0.5 % (can be changed in the settings) spread, and high is below ema fast low and open is at least 0.2 % spread (can be change in the settings).
XL = Exit long
When the high is above ema fast high and above a green step (probability) with at least 0.2 % spread (customizable in the settings)
The win rate changes based on the % change parameter. The lower the % change the higher the win rate will be.
Green and Red background shows you a bull trend or bear trend. It uses the Mac signal (periods are customizable in the settings).
You can add alerts for Long / Short / Exit Long / Exit short.
You can adjust parameters in the settings.
Use your own judgement to place trades. This algorithm helps you remove the stress of trading.
To avoid false signals trade from 4h timeframe +.
Channel SurfingThis is my Channel Surfing indicator. It fires Buy and Sell signals based on multiple conditions. You can use EMAs or LSMAs. You will have to check the box of which moving averages to use once you add it to the chart. It plots EMAs or LSMAs using the different sources Close, Low, and High as the channel to surf. It fires a Buy signal if price crosses the channel up and if there is a pullback into the channel followed by a breakout to the upside. It fires a Sell signal if price crosses the channel down and if there is a pullback into the channel followed buy a breakdown to the down side. I find it works great on the 5 minute SPY chart and the 1 minute chart of ES with the default settings when scalping. You are able to switch between 2 different channels using LSMAs or EMAs. The EMAs has an optional LSMA slope filter for getting rid of some false signals. Let me know if you guys find any other settings or ways to use this and as always I hope it helps.

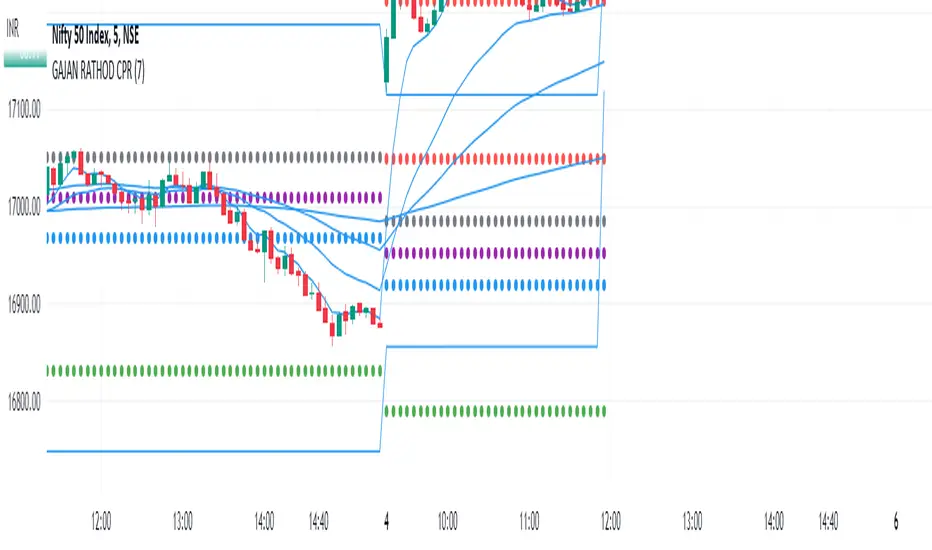
GAJAN RATHOD INTRADAY ( updated )This is purely an Intraday strategy. 5 ema is used for scalping , while 20 ema is for short term trading, 50 ema is for mid term while 200 ema is used for long term trading. Also, 15 min high and low is market. If candle closes above 15 min high then BUY or candle closes below 15 min low then sell.
Fibonacci EMA's with Bollinger Bands [Feniks]Many Fibonacci EMAs are calculated and then tracked using custom-colored candlesticks so that your chart remains very clean. This setup is mainly used for scalping on the 2min. Feniks uses gray candlesticks and then all of the custom-colored candlesticks to know when to react to price action.
WARNING: Do your own due diligence and try it out. Also, the script's default colors were determined with the chart's candlesticks being gray for both bullish/bearish candles. You'll probably have to change some of the colors to make use of the script if your chart's candlesticks are not similarly configured.
The main two strategies involve the 13/55 and 21/233.
The 13 EMA (blue) crosses above or below the 55 EMA (green).
- 13/55 Crossover is shown by the triggering candlestick being blue.
- 55/13 Crossunder is shown by the triggering candlestick being orange.
- (Alerts 1/2)
The 21 EMA (red) crosses above or below the 233 EMA (white).
- 21/233 Crossover is shown by the triggering candlestick being green.
- 233/21 Crossunder is shown by the triggering candlestick being red.
- (Alerts 3/4)
Dynamically Adjusting EMA Crossing
The Exponential Moving Average is the most commonly used indicator in every market. but no one can predict which pair of exponential moving average crossing will work best together. Every instrument require different EMAs crossing. It can be 2 EMA crossings or 3 EMA crossings.
Dynamically Adjusting EMA crossing tries to solve this issue. Algorithm finds the optimal EMA crossing setting for every instrument across all timeframes based on the EMA lengths provided in the settings. It evaluates the most profitable crossing combination for each instrument. The logic backtests the different combinations of EMA crossing based on the EMA lengths provided in the indicator's settings.
There are 3 EMA options in the settings Fact, Slow and Long. Indicator's Settings have the option to choose 2 EMA crossings or 3 EMA crossings.
Default Settings
Fast : 5 to 10
Slow : 13 to 19
Long : 20 to 60
Please do keep in mind that the performance of the indicator reduces as we increase the default settings range.
Please contact me for access

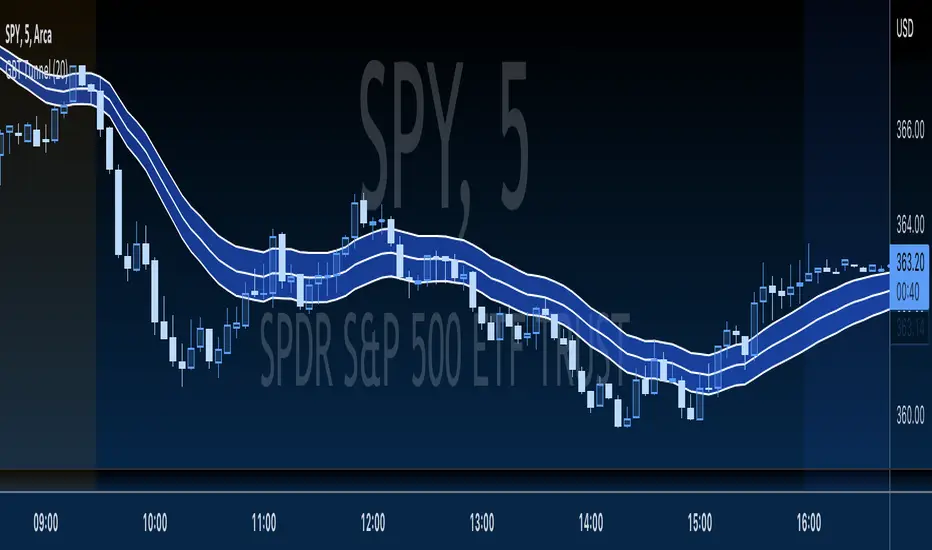
GBT TunnelThis is a channel type tool I created, heavily influenced by LazyBear COG Fibs script and the COG Fibs script by Joy_Bangla which also uses LazyBear COG Fib logic. All credit to those guys, publishing this open source as well since its nothing here is my original work really.
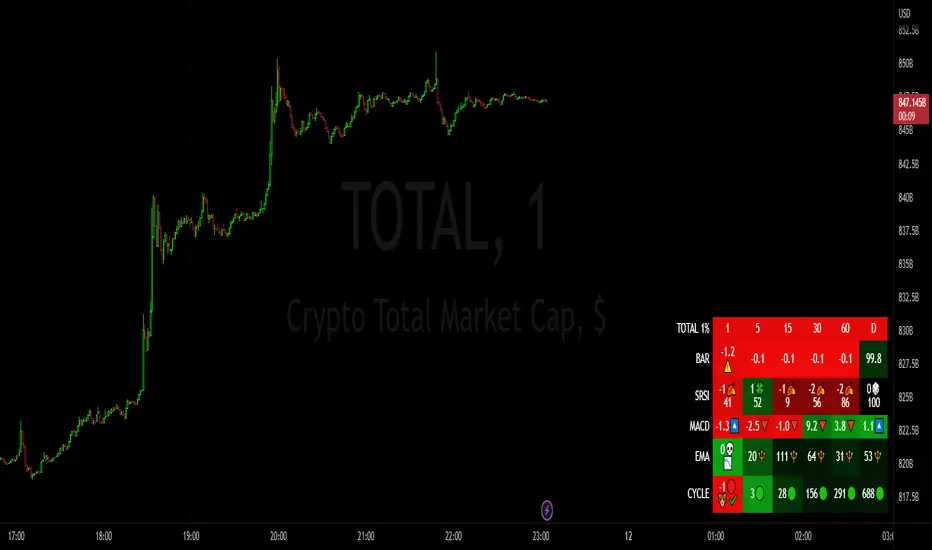
Market StatsIn this exciting new indicator...!
- You are able to select 6 different timeframes: 1 minute, 60 minute, 1 day, weekly, monthly, anything you please!
- With these timeframes, you are able to compare the different tema dema crossing percentages, to know whether the selected or current ticker is in an uptrend or downtrend!
- You are also able to formulate your very own EMA ratios to see in these different timeframes, or use the default, carefully optimized default EMA ratios per timeframe, to ultimately reveal the desired trends and whether these are in your favor for your position!
- Lastly, you have the RSI values at full display, also carefully optimized, for best alignment in indication of the current trend. To top it off, these RSI values are also displayed on the chart as well, should you choose to have it on display.
VWAP+SMA+EMAThis is the only indicator combing the results of VWAP + 2 SMAs + 2 EMAs.
This is a free indicator. Enjoy using it.
Kunal Jain
SBS AlgoHello traders, I am here again with a new and improved indicator.
This indicator is based on a pivot breakout algorithm which gives buy and sell signals according to the breakout of trendline. This is an advanced version of another script. It also takes price action into consideration along with some basic indicators like MACD and ADX to give good entry signals.
NOTE: This indicator is not designed to take entries completely based on signals it gives. Please use it along with your trading strategy to add more confluence to your trading system and maximize your profits.
I hope you guys will like this one too .Enjoy 👍
In case you find any bug, please do report in comment section .Thank you.

BankNifty ScriptsBank Nifty Script
Indicator provides Daily, Hourly and Weekly EMA's Exponential Moving Averages for different scripts of Bank Nifty Composition. You'll have CMP and % change along with cRSI.
Credit to RozaniGhani-RG for cRSI code.
Default length is 50 you can change as per your choice.
Table display can be set Vertically top, right, bottom and horizontally left, centre, right.
cRSI if above > 70 the label will change to Focus on Sell and less than < 30 label will show Focus on Buy
Basically created this script for my personal use to see in one shot what's happening in Bank Nifty Composition individual scripts.
Hope it helps.

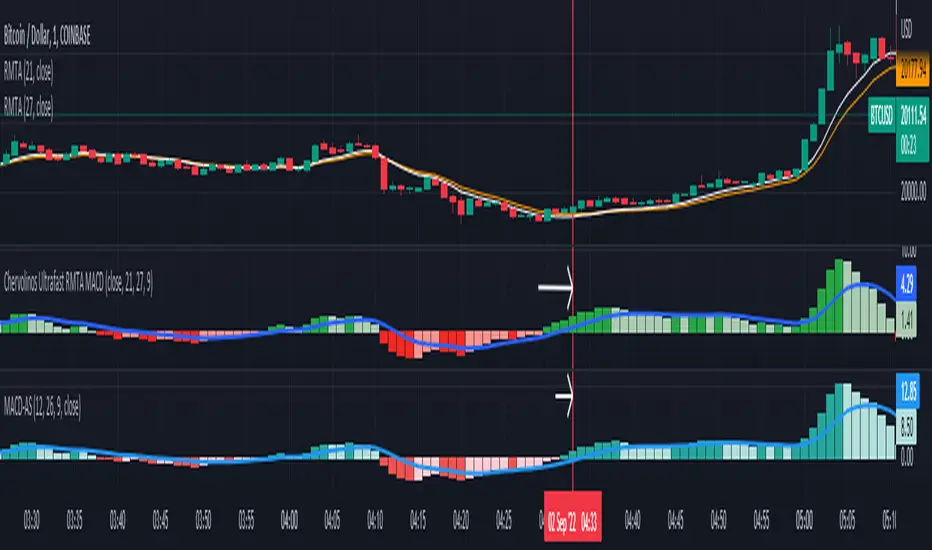
Chervolinos Ultrafast RMTA MACDDescription of a classic MACD:
MACD, short for moving average convergence/divergence, is a trading indicator used in technical analysis of stock prices, created by Gerald Appel in the late 1970s. It is designed to reveal changes in the strength, direction, momentum, and duration of a trend in a stock's price. The MACD indicator (or "oscillator") is a collection of three time series calculated from historical price data, most often the closing price. These three series are: the MACD series proper, the "signal" or "average" series, and the "divergence" series which is the difference between the two. The MACD series is the difference between a "fast" (short period) exponential moving average (EMA), and a "slow" (longer period) EMA of the price series. The average series is an EMA of the MACD series itself. The MACD indicator thus depends on three time parameters, namely the time constants of the three EMAs. The notation "MACD" usually denotes the indicator where the MACD series is the difference of EMAs with characteristic times a and b, and the average series is an EMA of the MACD series with characteristic time c. These parameters are usually measured in days. The most commonly used values are 12, 26, and 9 days, that is, MACD. As true with most of the technical indicators, MACD also finds its period settings from the old days when technical analysis used to be mainly based on the daily charts. The reason was the lack of the modern trading platforms which show the changing prices every moment. As the working week used to be 6-days, the period settings of represent 2 weeks, 1 month and one and a half week. Now when the trading weeks have only 5 days, possibilities of changing the period settings cannot be overruled. However, it is always better to stick to the period settings which are used by the majority of traders as the buying and selling decisions based on the standard settings further push the prices in that direction.
Description of the new Ultrafast RMTA MACD:
Ultrafast RMTA MACD, short for moving average convergence/divergence, is a trading indicator used in technical analysis of stock prices, created by Chervolino. It is designed to reveal changes in the strength,
direction, momentum, and duration of a trend in a stock's price. The RMTA MACD indicator (or "oscillator") is a collection of three time series calculated from historical price data, from the closing price.
The RMTA MACD based on the THE RECURSIVE MOVING TRENDLINE SYSTEM technical.traders.com
and is series is the difference between a "fast" (short period) Recursive Moving Trend Average, and a "slow" (longer period) Recursive Moving Trend Average of the price series. The average series is an EMA of the MACD series itself.
The result is a non laging indicator, depends on the settings.
special thanks to
everget
LonesomeTheBlue
RSI + GDAX EMA ConfluencerHighly customizable RSI + GDAX EMA tool to help you quickly spot levels of confluence
- Displays current RSI levels as a plot
- Displays current 12 + 26 EMA as a plot
- 7 customizable time frames
- Each time frame marks RSI oversold, RSI overbought, 12 EMA, and 26 EMA as a line with label
- Each time frame RSI and EMA have options to toggle visibility and oversold/overbought only so you can choose exactly what you want to see
Planned for future release:
- Further customization for lines (color, size, direction, etc)
- Further customization for labels (location, offset, color, size, etc)
- Highlighting areas of confluence (if 2-3+ lines are within a certain % of each other)

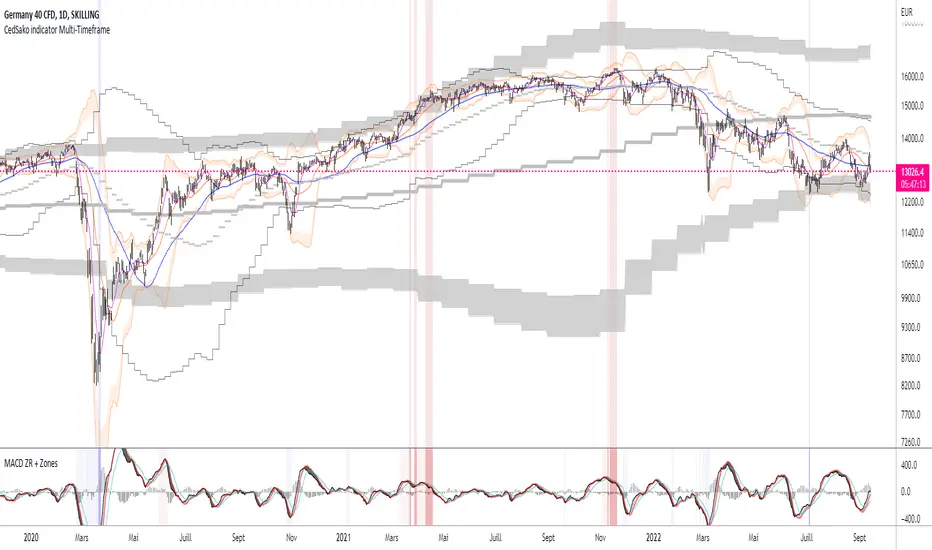
Bollinger + MMA + EMA + Zones ImportantesIndicator for trading volatility.
It includes many options such as:
- up to 3 customizable bollinger bands
- the famous magic bollinger band (only in UT 5min) (I will work on this option to make it even more perfectible)
- up to 5 customizable moving averages (with the possibility of putting a colored backround during crossings)
- up to 3 customizable exponential moving averages.
This indicator, associated with my indicator "MACD ZERO RETARD + ZONES IMPORTANTE" will allow you to draw your attention to areas of interest and thus work on your positions. Works on intraday, medium and long term (to be determined if it also works for scalping).
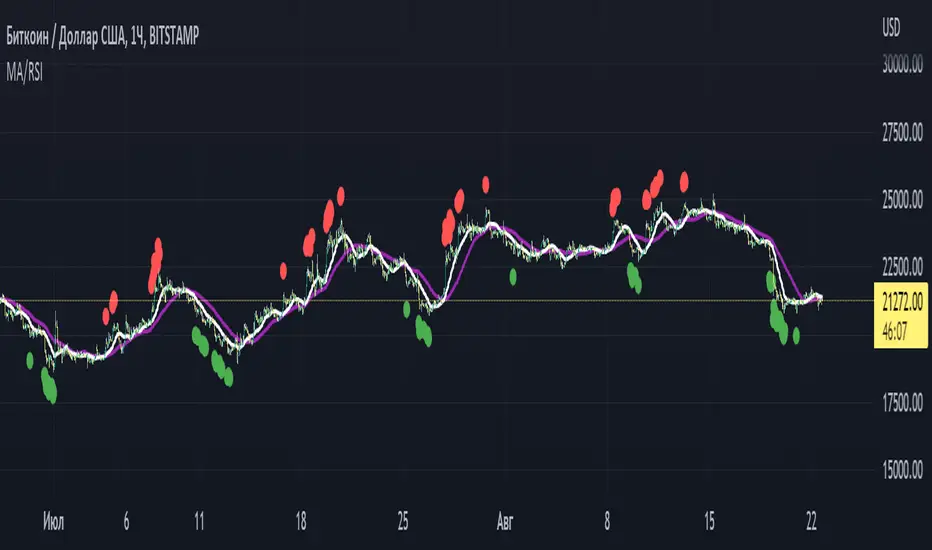
Pranoyama MA/RSI toolEng: The indicator highlights the overbought and oversold RSI levels on the bars. Also draws two moving averages: sma or ema. The RSI levels, the type of moving averages and their period are set by the user.
Rus: Индикатор подсвечивает на барах уровни перекупленности и перепроданности по RSI, а так же рисует две скользящие средние на выбор: sma или ema. Уровни RSI, тип скользящих средних и их период устанавливаются пользователем.
p.s. Это адаптация ранее опубликованного мной индикатора
TradingCube : Moving Average : Data tablePlots moving average both EMA as well as SMA on Multiple timeframes at once in a Tabular Format
for rapid indication of momentum shift as well as slower-moving confirmations.
Displays EMA/SMA 5 8, 13, 21,34,55,89,100,200,400 by default as well as provide the users the flexibility to choose the timeframe as per their set up.

Three Legged Goose FuturesThree-Legged Goose is an all-in-one intraday trading system.
Three-Legged Goose Futures is the same system as our "Three-Legged Goose" indicator, simply optimized for futures trading by working across all futures market sessions.
Three-Legged Goose Futures ONLY works on futures charts, please use our original Three-Legged Goose for equities.
It features a sleek and customizable Opening range overlay with infinitely generating price targets, Average Daily Range Zones, Curated Anchored VWAPs, Total Volume and ATR analysis, as well as our state of the art Market Momentum Trend detection.
Three-Legged Goose also has important Daily levels, including the Previous Day's High and Low and the Current Days Open, three fully customizable Exponential Moving Averages, a customizable ema cloud, and a toggleable standard vwap .
Three-Legged Goose Futures also includes overnight highs and lows as well as previous New York Session highs and lows.
Using this indicator allows you to get rid of any unnecessary indicators that are taking up those valuable slots in TradingView.
AVWAP + ORBS:
The Opening Range Breakout system builds off of our recommended 15min opening range and does all of your price target calculations based on the width of the opening range. These targets are fully customizable within the settings,
to allow fine-tuning from ticker to ticker. We have programmed three Anchored vwaps at different time intervals to act as a dynamic trend-finding instrument. These, along with the opening range breakout system, can help you quickly spot the day's trend and dynamic support and resistance long before your standard moving averages have caught up with price intraday.
Average Daily Range Zones:
We believe these zones to be essential to trading, especially with our system. These zones tend to act as areas of major support and resistance as well as give an idea of the projected volatility of the underlying.
Market Momentum Trend Detection:
We paint our momentum analysis directly on your candles. By taking the overall Market Internals + the underlying's Price movement, we can determine areas where we feel comfortable adding risk on or taking risk off.
This will help those that struggle at identifying trends and valid reversals.
All of the default settings are our recommended settings.
Please check the Author Instructions Below for how to gain access to our indicators.
