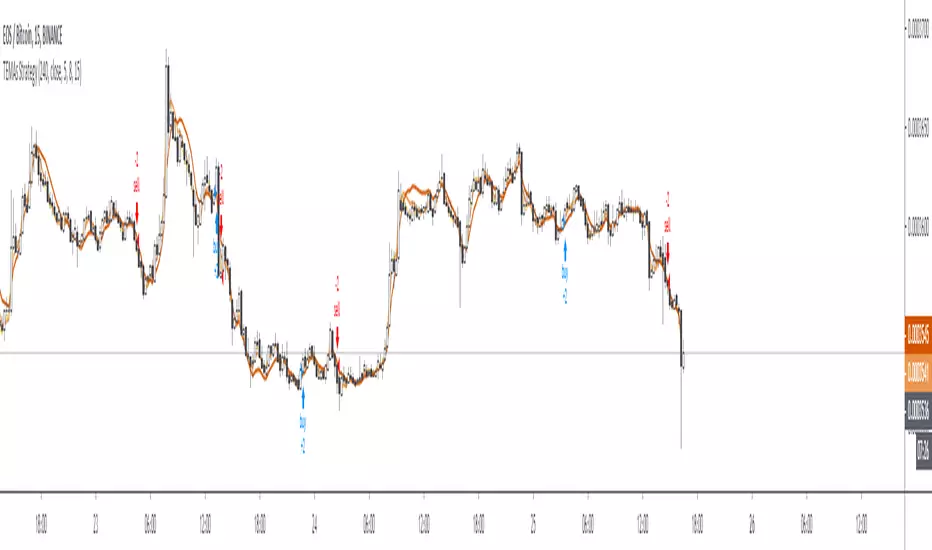
Scripting Tutorial A - TManyMA - StopsThis script is for a triple moving average strategy where the user can select from different types of moving averages, price sources, lookback periods and resolutions.
Features:
- 3 Moving Averages with variable MA types, periods, price sources, resolutions and the ability to disable each individually.
- Crossovers are plotted on the chart with detailed information regarding the crossover (Ex: 50 SMA crossed over 200 SMA )
- Forecasting available for all three MAs. MA values are forecasted 5 values out and plotted as if a continuation to the MA.
- Forecast bias also applies to all forecasting. Bias means we can forecast based on an anticipated bullish, bearish or neutral direction in the market.
- To understand bias, please read the source code, or if you can't read the code just send me a message on here or Twitter. Twitter should be linked to my profile.
- Ribbons added and on by default. Optional setting to disable the ribbons. 5 ribbons between MA1 and MA2 and another 5 between MA2 and MA3.
- Ribbons are alpha-color coded based on their relation to their default MAs.
- Ribbons are only visible between MAs if the MAs being compared share the same Type, Resolution, and Source because there is no way to consolidate those three in a simple manner.
- Ribbon values are calculated based on calculated MA Periods between the MAs.
- Converted the existing study into a strategy.
- Strategy only enters long positions with a market order when MA crossovers occur.
- Strategy exits positions when crossunders occur.
- Trades 100% of the equity with one order/position by default.
- Ability to disable trading certain crosses with input checks.
- Ability to exit trades with a take profit or stop loss.
- User input to allow quick changes to the take profit or stop loss percentages.
This script is meant as an educational script with well-formatted styling, and references for specific functions.
*** PLEASE NOTE - THIS STRATEGY IS MEANT FOR LEARNING PURPOSES. DEPENDING ON IT'S CONFIGURATION IT MAY OR MAY NOT BE USEFUL FOR ACTUAL TRADING. THE STRATEGY IS NOT FINANCIAL ADVICE ***
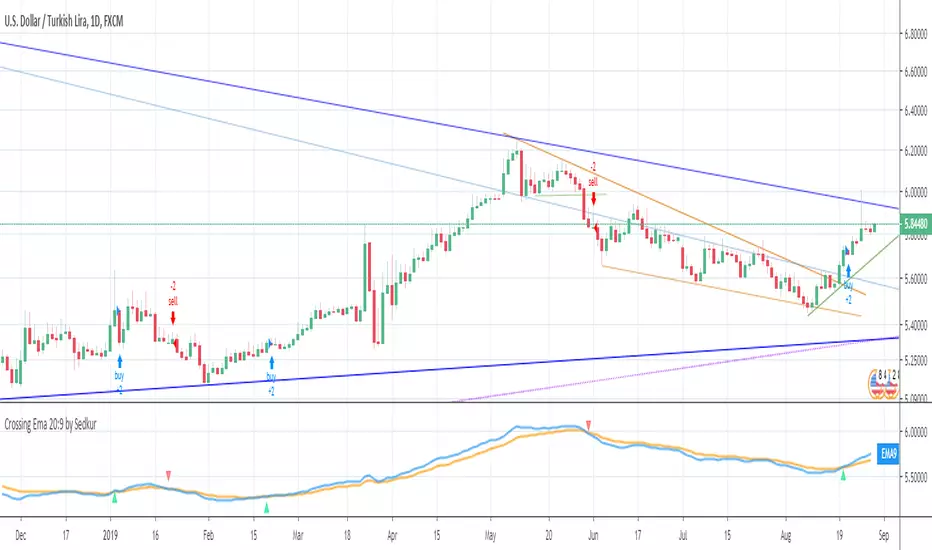
Media Móvil Exponencial (EMA)

35EMA Cross BuyAndSell Strategy + RIBBON [d3nv3r]This strategy allow the user to move the EMA which control the Buy&Sell Strategy and show the EMA ribbon that can be found in the Template area.
Buy showing the ribbon and letting the user to adjust the EMA signaling the B&S strat the user can create an elaborated strategy for buyPoint and sellPoint.
The 35EMA Cross is choosen by default but I recommend to move it to find best Sell point and best Buy point as you would not react on the same EMA for a Buy signal and a Sell Signal..
It would be good to have buy signal on a EMA and the sell signal on another but that's for another Strategy to be shared.
Let me know by commenting what you would like for the next one !
Simple EMA Long Only StrategySimple EMA long only strategy, using ATR on crossings to minimize fake signals.

Scripting Tutorial 9 - TManyMA Strategy - Long Market Order OnlyThis script is for a triple moving average strategy where the user can select from different types of moving averages, price sources, lookback periods and resolutions.
Features:
- 3 Moving Averages with variable MA types, periods, price sources, resolutions and the ability to disable each individually
- Crossovers are plotted on the chart with detailed information regarding the crossover (Ex: 50 SMA crossed over 200 SMA )
- Forecasting available for all three MAs. MA values are forecasted 5 values out and plotted as if a continuation to the MA.
- Forecast bias also applies to all forecasting. Bias means we can forecast based on an anticipated bullish, bearish or neutral direction in the market.
- To understand bias, please read the source code, or if you can't read the code just send me a message on here or Twitter. Twitter should be linked to my profile.
- Ribbons added and on by default. Optional setting to disable the ribbons. 5 ribbons between MA1 and MA2 and another 5 between MA2 and MA3.
- Ribbons are alpha-color coded based on their relation to their default MAs.
- Ribbons are only visible between MAs if the MAs being compared share the same Type, Resolution, and Source because there is no way to consolidate those three in a simple manner.
- Ribbon values are calculated based on calculated MA Periods between the MAs.
- Converted the existing study into a strategy
- Strategy only enters long positions with a market order when MA crossovers occur
- Strategy exits positions when crossunders occur
- Trades 100% of the equity with one order/position by default
- Ability to disable trading certain crosses with input checks
This script is meant as an educational script with well-formatted styling, and references for specific functions.
*** PLEASE NOTE - THIS STRATEGY IS MEANT FOR LEARNING PURPOSES. DEPENDING ON IT'S CONFIGURATION IT MAY OR MAY NOT BE USEFUL FOR ACTUAL TRADING. THE STRATEGY IS NOT FINANCIAL ADVICE ***


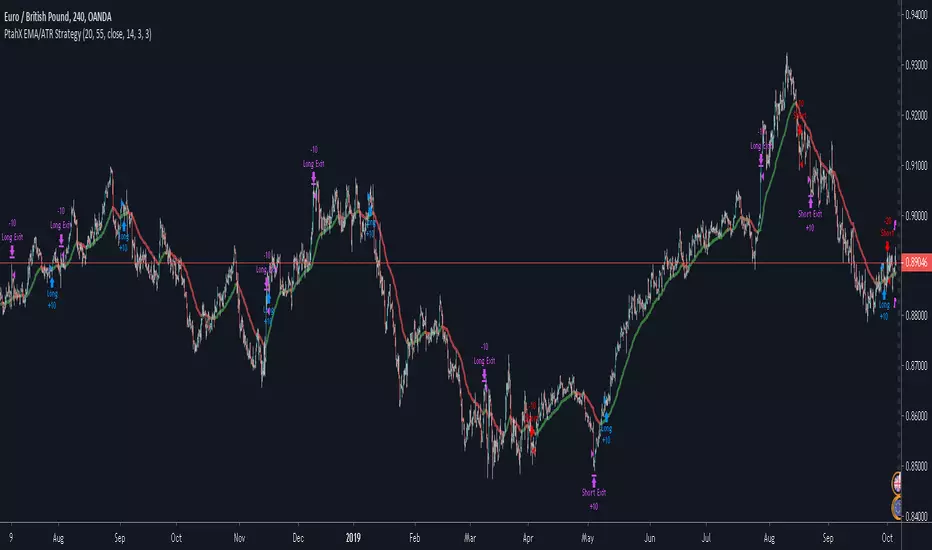
PtahX EMA/ATR StrategyPtahX EMA/ATR Strategy Public Release
written October 2019
EMA Strategy with ATR & "Fear Factor" built in
* modifications welcome
* please let me know if you improve it so I can continue to learn :)
* use at your own risk - I'm a new programmer and still learning
* Best of luck on your trades!!
// Take Profit (TP) option based on ATR or MA Crossover
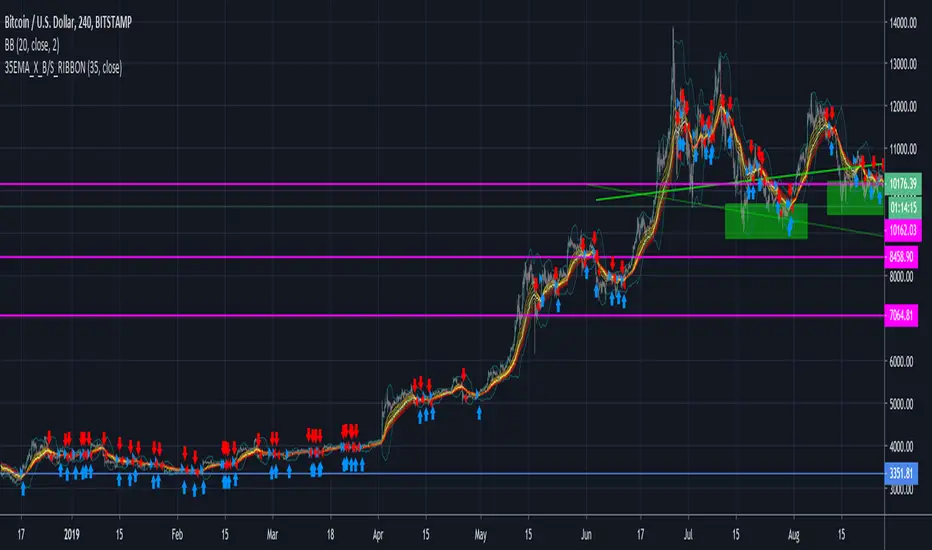
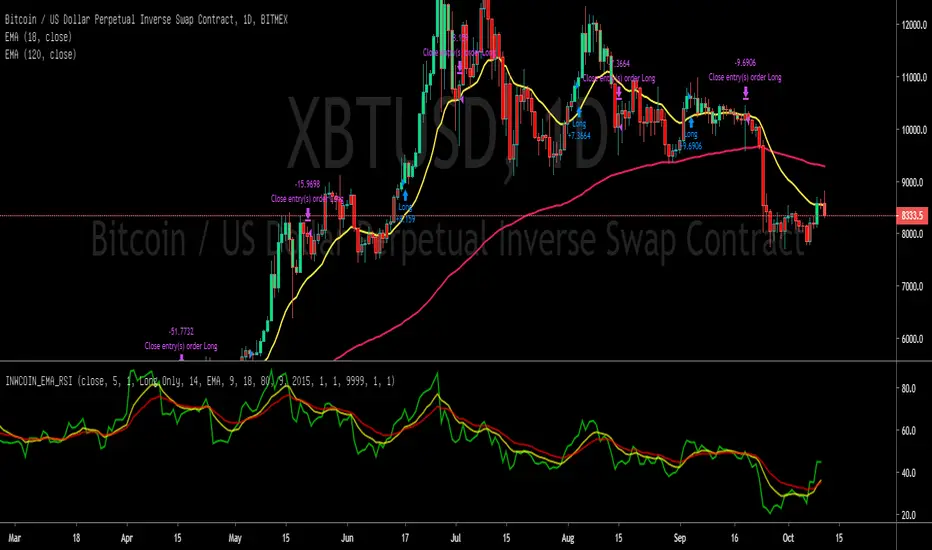
inwCoin Simple EMA Cross Risk% Strategy.=========================
English
=========================
Just very basic simple EMA cross
I'm using EMA 18 and EMA 120 daily
Buy : EMA18 crossover EMA120
Sell : EMA18 crossunder EMA120
this proven profitable for BTC since it likely to hover over EMA120 in bull market.
==========================
Thai
==========================
บางทีกลยุทธ ที่ดูเหมือนง่ายๆ โง่ๆ อย่าง EMA สองเส้น ตัดกัน
ถ้าดูตาม TF ใหญ่ มันก็ทำกำไรได้ ค่อนข้างดีเลยทีเดียวนะเนี่ย
บางที คนเราก็พยายามจะเล่นสั้นกันแทบตาย
หาสูตรพิสดารพันลึก
สุดท้าย เอาเข้าจริงๆ เล่นง่ายๆ ตามระบบง่ายๆ ใน TF ใหญ่ๆ ระดับ Daily หรือ Weekly ขึ้นไป
...ก็ได้ตังเหมือนกัน
ปัญหาคือ คนส่วนใหญ่ ทนกันไม่ได้ และนั่งเฉยๆ ไม่เป็นน่ะ 55555
มันคันมือเหลือเกิน จะต้องทำกำไรให้ได้ทุกวัน ไม่งั้นไม่เท่
สุดท้าย ไปเข้าๆ ออกๆ รัวๆ แทนที่เงินจะงอก ดันเสียเงินอีก
ดีไม่ดีเมาหมัด ยิ่งเทรดยิ่งเสีย เจ๊งกันเข้าไปใหญ่

Ultimate Pullback StrategyWhat is the Ultimate Pullback Strategy?
This strategy script is based on my Ultimate Pullback Indicator which detects pullback trading opportunities by analyzing price action in a very specific manner.
By combining simple trend filters with various advanced candlestick patterns it detects high-probability trend-continuation setups (and optional exits).
If you use this script to set alerts then you will never miss a pullback trading opportunity ever again!
I personally use this indicator to profitably trade pullback signals in the forex markets on multiple timeframes, from the 15-Minute chart to the 4-Hour and Daily chart.
Note: This strategy companion script is only available for subscribers of The Ultimate Pullback Indicator.

inwCoin EMA of RSI Risk% Strategy=========================
English
=========================
Just simple strategy idea using EMA of RSI crossing to define entry and exit.
Looking good for backtest result but I'm not sure will it ok if live trade.
Please make sure to paper trade ( forward test ) for few month if you want to use this strategy.
Also, this is for education purpose and not the investing advise.
Use it as your own risk.
-----------
Concept
-----------
Making slow and fast EMA of RSI and decide when to enter/exit trade
If fast crossover slow = Buy
If fast crossunder slow = Sell
You can using trend filter to filter out downtrend
Recommend value is 80 for Daily TF
This strategy is no good for small TF because EMA of RSI will cross up and down like crazy and I'm sure you'll losing money if you follow this strategy in real trade lol.
==========================
Thai
==========================
มีคนถามในห้อง Bitcoin Thai Club ว่า ถ้าใช้ EMA of RSI แล้วหาจุดเข้าออกจากตรงนั้นจะเป็นไง
ก็เลยลองทำ proof of concept strategy ออกมาดู
กลายเป็นว่า... ให้ผลค่อนข้างดีกว่าไอ้ตัวที่เคยมีซะอีก โว๊ะ!! 555
เท่าที่ไล่กดดูหลายๆ Timeframe พบว่า ยิ่ง TF เล็ก noise ยิ่งเยอะ ทำให้การตัดกันของเส้น EMA ค่อนข้างพันกันไปมา ทำให้มีการเข้าๆ ออกๆ แบบเสียเปล่าเยอะไปหน่อย
ถ้าใครจะใช้ แนะนำให้ใช้ TF daily กับ weekly ขึ้นไปน่าจะให้ผลที่พอเชื่อถือได้
===========
หลักการ
===========
ใช้ EMA สองเส้น คือ EMA fast กับ EMA slow โดยไปหาค่า ema ของ rsi แล้วหาจุดตัดของสอง ema นั้นๆ
ema fast ตัด ema slow ขึ้น = ซื้อ
ema fast ตัด ema slow ลง = ขาย
ง่ายๆ แค่นี้เอง
เท่าที่ไล่ดูด้วยตา มันสามารถออกที่ยอดได้ค่อนข้างสวยอยู่พอสมควร ( ถ้าใช้ TF daily หรือ weekly นะ )
ใครจะเอาไปเล่น ก็อย่าลืม forward test กันก่อนจะไปลงเงินจริงนะ
ตรงนี้เป็นแค่ concept แต่เวลาเทรดจริงมันอีกเรื่องนึงเลย
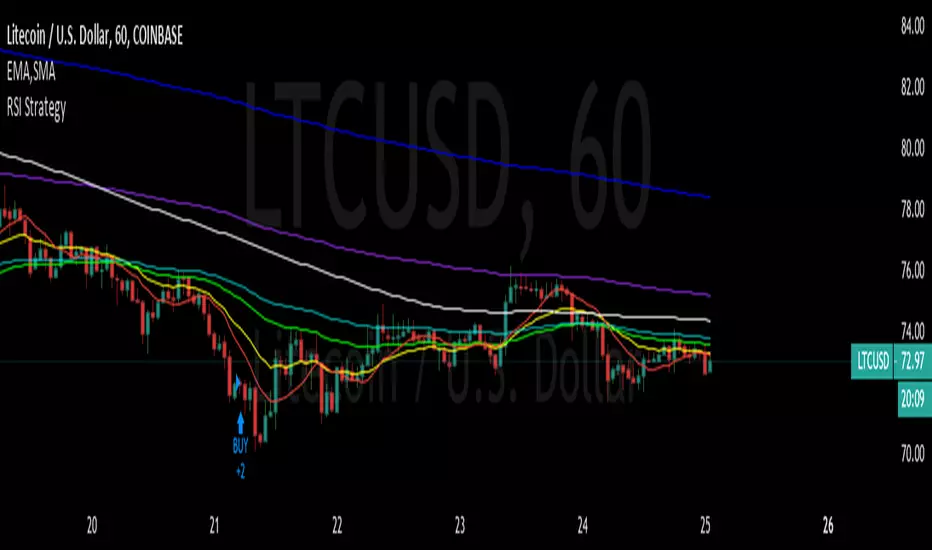
EMA X BF 🚀EMA Crossover Strategy
A simple EMA cross is a useful indication of a change in direction of a trend and is a very popular tool in trading. It can also be useful to judge price action momentum or severity by looking at the angle of the 2 EMAs, or the distance between them.
There are 2 Exponential Moving Averages, one fast and one slow. When the fast EMA crosses above the slow EMA, this can be considered bullish and may signal an upside move. Conversely, a cross to the downside of the fast EMA under the slow EMA can be considered bearish.
This strategy uses the same principle but uses different sources for the 2 EMAs; instead of using close values, we use ohlc4 values for the fast EMA and hlc3 values for the slow EMA.
The idea is that a trader might enter a long position upon a cross up and reverse position and go short upon the next cross down.
We use a simple 6% stop loss for both long and short positions.
This strategy is tuned to a 6hr chart for Bitcoin USD pairs.
INSTRUCTIONS
Go Long when the background is green
Go short when the background is red
White background means sideways market: a no trade zone


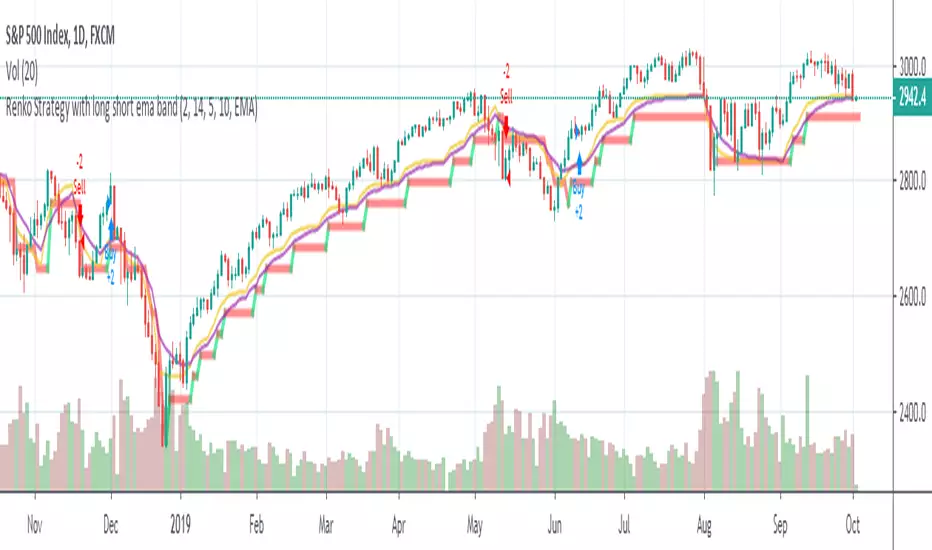
Renko Strategy with Ema against price crossover/underRenko Strategy with Ema against price crossover/under

Makenai Chart Strategy Trial(日本語による説明は こちら から)
Each hourly foot can display the moving average line for the same period of time in the same color.
The average moving line that you want to see is displayed by time leg, as well as the long-term Bollinger band that should be noticed by the time leg.
1. You can get a lot of useful information at a glance by displaying the moving average line of the long-term and period setting that many traders are aware of.
○ The period setting of the moving average line displayed in each time and foot is not fixed as usual, but changed the period by time and foot, and the moving average line of the same color is the same.
It is a moving average line of time (for example, an hourly average line and a four-hour average line).Therefore, the market price is always the same even if the time to see changes
You can see it on a scale.It doesn't happen when you look at it in five minutes, but when you look at it in four hours, it looks like a downward trend.
○ The sensitivity of the rate to the moving average line displayed is very high.
You can see how rate moves, such as trends, are determined, and you can see reality in abstract chart moves
I can feel it.Purple 24 hours (one day) moving average line with 1 minute to 4 hours of foot, Green 1 week moving average line with 5 minute to day.
The sensitivity to the Blue Monthly Movement Average Line, which is displayed from 5 mins to 5 weeks, and Red One Year Movement Average Line, which is displayed from 1 hour to 5 weeks, is very high.
Just look at whether the rates are moving up or down the moving average line and you'll be able to decide what to look for.
○ What is the positional relation between the moving average line of seven (eight in addition to the weekly moving average line) in the short, short, medium, medium, long, and long periods?
To make the direction and intensity of the trend easier to recognize, it is colored between moving averages to be visible as short- and medium-term clouds.
The three clouds changed color to warm rising clouds and cold falling clouds, depending on the relation of the moving averages.
·Strong upward trend rates when all clouds are unified in either upward or downward direction and are arranged in the order of short-term, medium-term or long-term clouds
·The thickness of the clouds is strong, and when the thickness is increased, the trend rate is strong.
·Trendless market when clouds overlap or the colors of the clouds are mixed
• Range price when rates are moving back and forth between clouds
You can visually and intuitively understand the market conditions, such as .
○ Short-term, short-term, medium- and short-term positional relationships will indicate the timing of the entry payment and the direction of the long-short.It's also written.
In conjunction with this, the duration for which the background color should be long changes to light warm color and warm color, and the duration for short changes to light cold and cold color.
2. The long-term Bollinger band is displayed so that you can trade with the higher time base than the time base you see.
○ You can ride on a long-term trend by detecting and entering the trend occurrence of long-term feet with short-term feet.
Buy high prices, sell low prices, relax your trend-follow-style tears, and enable stress-free entries.
○ A light, transparent gray filter is displayed between the long-term foot Bollinger band ±1σ which sets the period suitable for the time and foot.
I understand that while the rate is moving in this zone (called gray zone), it is difficult to trend and the price range is small, so it should not be taken care of.
Yes, you can use this filter to prevent deception when the volatility is not present, and if you are out of the filter, you can use the above sign.
By trading in accordance, you can invest in trend-follow tiles while avoiding losses in range markets.
○ Bolinger bands generally display six of ±1σ, ±2σ and ±3σ, but in this indicator, two are inside ±1σ and two are outside ±3σ.
We have added a total of four bands.The former sets up early entries and the latter sets up new reverse positions, expecting a market shift from overheating.
for tips on how to
○ Expansion period (expansion period) due to characteristics of the Bollinger band is a period when volatility is big for trade, and a squeeze period
(Shrinking period) I understand that the volatility is small and it is not suitable for trade.Also, it's a squeeze period, but it's not
You can seize investment opportunities by making you expect the timing to move from contraction to expansion and by watching.
※Valid time difference by series
Multi Time : 1 minute, 5 minutes, 15 minutes, 30 minutes 1 Hour, 4 Hour, Daily, Week (Total 8 Hours)
Long Time Span : 1 hour, 4 hour, daily, 4 long-term
Short Time Span : 1 minute, 5 minutes, 15 minutes, 30 minutes
Trial (1n & 1h) : 1 min.
※See here for details of the indicator and how to use it.
★ for "Indicator Grant" and "Market Analysis Information and Indicator Signature Distribution Service" by LINE Group (for a fee)
If you wish, please send a message on private chat
Discord:
discord.gg


MavCrossover v2Simple moving average crossover strategy with
SMA and EMA,
a time window and
the possibility to set the 2nd MA as a factor of the 1st one (to quick cycle through them)

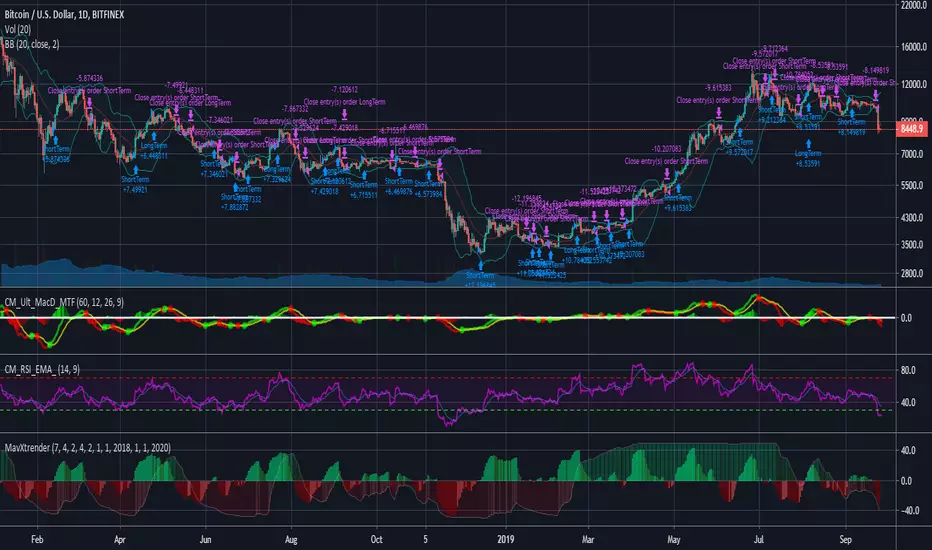
MavXtrenderConverted the B-Xtrender script from Puppytherapy into a strategy script.
B-Xtrender was created by Bharat Jhunjhunwal and published in this IFTA Journal .
I've added the following features:
Ability to use factors instead of individual values for each parameter. This will allow you to quickly check different averages (5 vs 7 for example).
Defaults adjusted for crypto trading (7 days/week).
Switches to use either the short or long term indicator, or both.
Time window
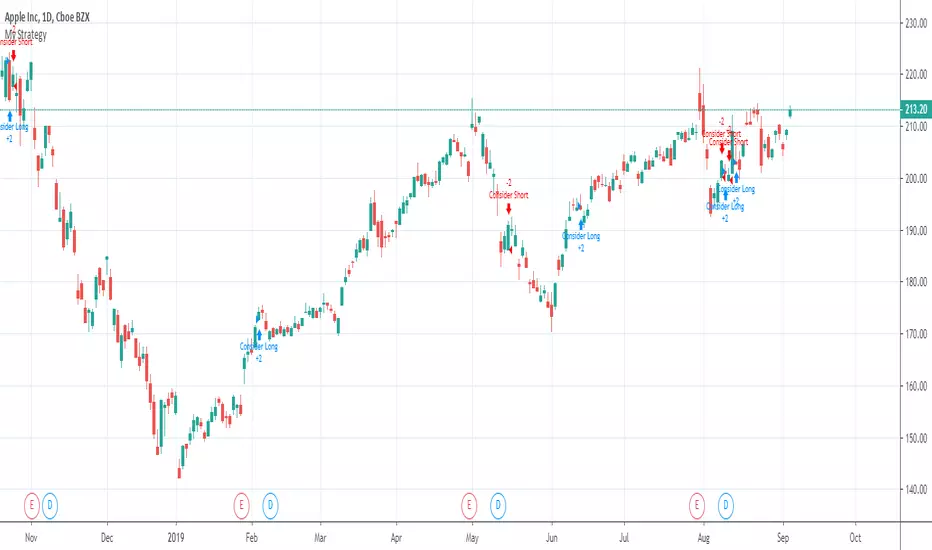
8 On 34 ema'sHi guy's
this simple dude send nice message
consider short/long when 8Ema Cross 34 Ema - If you learn this sutep and clear the false alarms (thats why it's - "consider") you can ride some waves
Enjoy
QuantCat Mom Finder Strategy (1H)QuantCat Momentum Finder Strategy
This strategy is designed to be used on the 1 hour time frame, on all x/btc pairs.
The beautiful thing is it plots the take profit, and stoploss for you for each entry- where I would say use the stoploss for sure and feel with water with how the price action is looking when in profit.
In this strategy, I actually implemented my own trading style into building the strategy. Having to replicate my own trading strategy into an algorithm, I can't make it exactly perfect to how I would trade, but what I can do is try and program the parameters that give it the absolute best chance of making a big move with a small drawdown- which replicates part of my momentum trading style. Here I am using RSI, MACD, EMA and trend filtering values to find moments where there has been a momentum change to play the rest of the move. It only picks the best entries.
There is always a 3-4 R/R move on average with with these trades, meaning 1 in 4 only need to hit to be a break even trader- where most of these strategies have about 35% hit rate.
The stoploss is so crucial to minimise any damage from huge unexpected candles, the strategies can just be used for entries as well, you don't have to stick to the exact formula- of the long and short system, but this by itself is profitable.
The system nets positive results on
-ETH/BTC
-LTC/BTC
-XRP/BTC
-ADA/BTC
-NEO/BTC etc.
We also have a free 15M strategy available too.
You can join our discord server to get live alerts for the strategy as well as speak to our devs! Link in signature below!!!

EMA cross scalp strategy 1m 5m nas100meant for scalping on NAS100 on the 5m and 1m time frames (testing version