EMA Cross + Divergence strategy (Div. signals by The Divergent)A sample strategy demonstrating the usage of The Divergent divergence indicator and The Divergent Library .
The Divergent is an advanced divergence indicator which you can easily incorporate into your own strategies.
In order to use this strategy (and to use the signals in your own strategy), you need to have the Pro version of The Divergent applied to your chart.
For more information, please see the comments inlined in the code.
Media Móvil Exponencial (EMA)

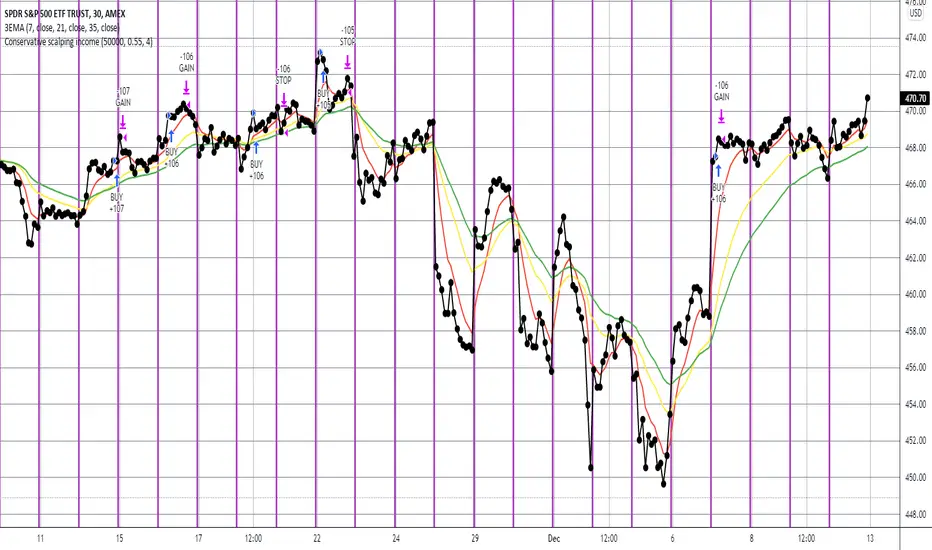
Conservative scalping incomeThis fully automated scalping strategy aims for an 10-12% annual return using LONG positions only (i.e. no SHORTs), with 2 to 1 number of winning trades and 1.5 to 1 avg win amount vs avg loss amount. It should generally make from zero to four trades per day depending on market conditions. It should remain in a position for roughly an hour. It leverages numerous indicators, including multiple moving averages, ADX, and MACD.
Note that this strategy does not try to time tops and bottoms. Rather it waits to clearly identify a trend, and then rides that trend for a short while making a defined profit. Thus it may enter and exit a trade under profitable conditions, but not at the most profitable conditions possible. It gets in when it's sure of the trend, and then generally leaves that trend as soon as a defined profit is made or before a meaningful loss is incurred.
This strategy will work well with any index (e.g. SPY) and most stocks. It works best on a five minute time interval and when the index or stock is either generally increasing over time or bouncing back and forth between a medium to wide range.
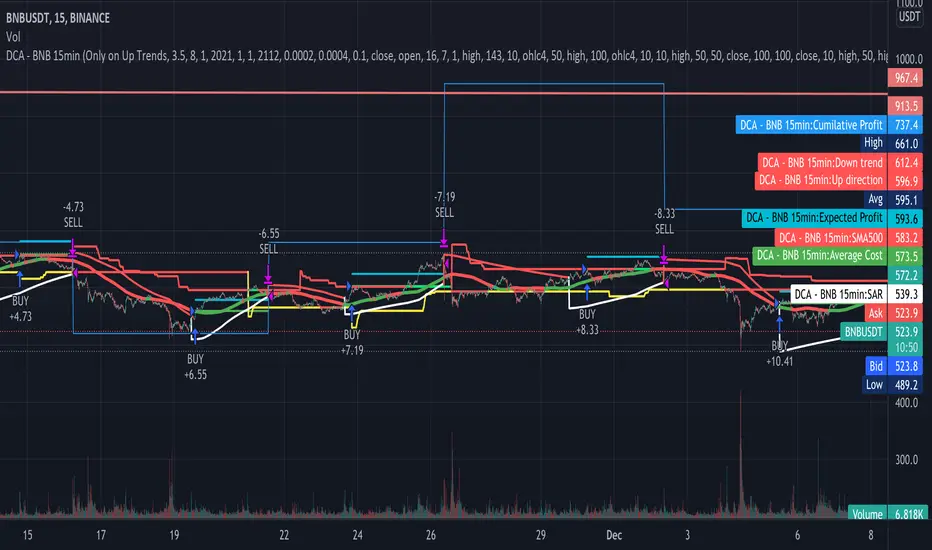
Dollar cost averaging This is a testing startergy based on dollar cost averaging and sell on high points.
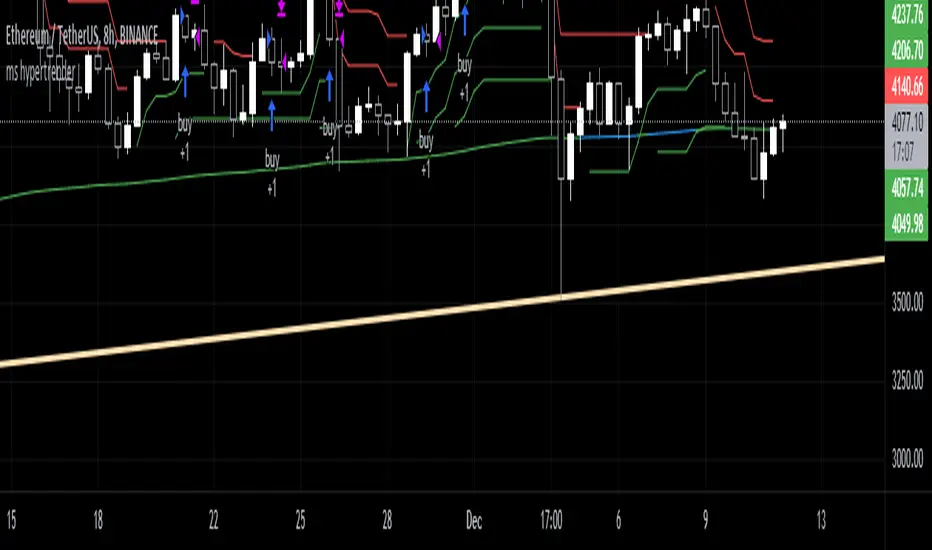
moonshot hypertrender (supertrend strategy)
This is a well-known strategy by using 3 different Supertrends and a trend-defining EMA,
feel free to play around with the settings, a backtest on 8h ETHUSDT pair brought some good results using
the 233EMA and investing 75% of a 10k start capital.
The idea is to have at least 2 Supertrends going green above the trend-EMA to go into a long position. The exit
will be triggered if 2 Supertrends change to red (idea: 1 super trend in red could initialize a take profit).
Taking shorts works vice versa.
The EMA shows in green for uptrends and in red for downtrends, if it is blue (ranging market) no Signal will be taken because
the 3 Supertrends are not all above or below the trendline(EMA).
I heard about this strategy on youtube but I can't get the promised 60% win-rate ;)
any suggestions to improve it are welcome
Hope you find it useful and it would be nice to get your feedback
-theasgard-
(Short)EMA 4H + Stochastic RSI By Nussara (strategy)This is a back test for "(Short)EMA 4H + Stochastic RSI" used for a short position. It uses EMA and stochastic RSI.
The 4-hour EMA is a trend indicator in smaller timeframes. For a short position, EMA slow is above EMA fast and uses stochastic RSI to predict price turning points. Through the formula, traders can identify overbought or oversold.
Default setting
1. The 4-hour EMA defaults to EMA fast =24 and EMA slow = 33.
2. Stochastic RSI defaults K=3, D=3, RSI Length=16, and Stochastic Length = 5.
You should adjust the settings to be suitable for the products that you trade.
(Short)EMA 4H + Stochastic RSI formula
Short Entry :
1. The timeframe of the chart must be less than or equal to 4 hours. If the timeframe is set higher than 4 hours, this strategy will not work.
2. 4-hour slow EMA line must be above fast EMA line, indicating an downtrend.
3. Stochastic RSI K line cross down D line and the intersection must be above 80.
If all three are true, the indicator will have a short signal.
Short Exit: Stochastic RSI K line cross up D line
This indicator is just a tool for technical analysis. It shouldn't be used as the only indication of trade because it causes you to lose your money. You should use other indicators to analyze together.

(Long)EMA 4H + Stochastic RSI By Nussara(strategy)This is a back test for "(Long)EMA 4H + Stochastic RSI " used for a long position. It uses EMA and stochastic RSI.
The 4-hour EMA is a trend indicator in smaller timeframes. For a long position, EMA fast is above EMA slow and uses stochastic RSI to predict price turning points. Through the formula, traders can identify overbought or oversold.
Default setting
1. The 4-hour EMA defaults to EMA fast =24 and EMA slow = 33.
2. Stochastic RSI defaults K=3, D=3, RSI Length=16, and Stochastic Length = 5.
You should adjust the settings to be suitable for the products that you trade.
(Long)EMA 4H + Stochastic RSI formula
Long Entry :
1. The timeframe of the chart must be less than or equal to 4 hours. If the timeframe is set higher than 4 hours, this strategy will not work.
2. 4-hour fast EMA line must be above slow EMA line, indicating an uptrend.
3. Stochastic RSI K line cross up D line and the intersection must be below 20.
If all three are true, the indicator will have a long signal.
Long Exit: Stochastic RSI K line cross down D line
This indicator is just a tool for technical analysis. It shouldn't be used as the only indication of trade because it causes you to lose your money. You should use other indicators to analyze together.

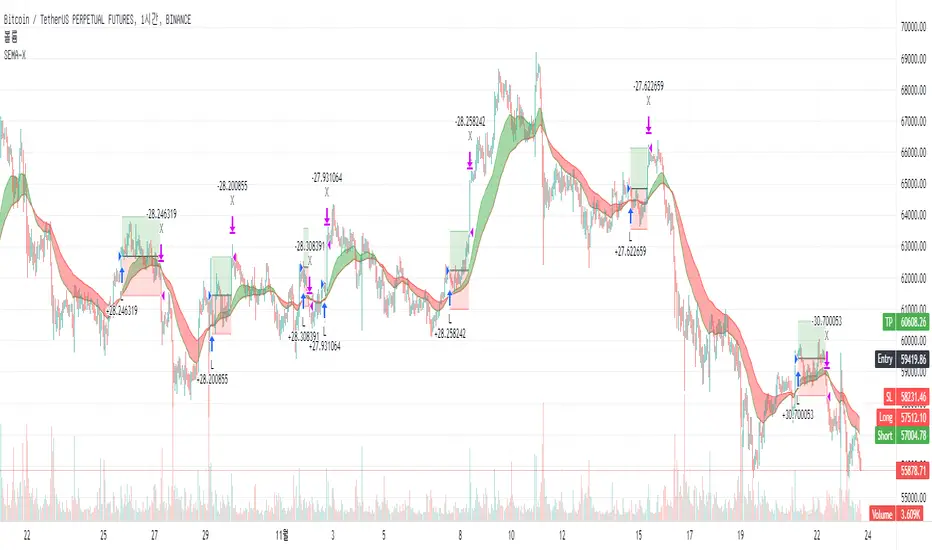
SEMA-XSEMA-X (sema cross)
It's a simple EMA cross strategy
Rules of strategy
1. 2 EMA crossing
2. Long (Golden Cross), Short (Dead Cross)
3. Target profit, stop loss setting
You can also get big trend gains if you set a long target price.
* * *
SEMA-X (세마크로스)
간단한 EMA 교차 전략 입니다.
전략의 규칙
1. 2개의 EMA 교차
2. 매수(골든 크로스), 매도(데드 크로스)
3. 목표가, 손절가 설정
목표가를 길게 설정하면 큰 추세 이익도 얻을 수 있습니다.
5min MACD scalp by JoelThis strategy is inspired by a youtuber called Joel on Crypto. He trades this using Ema, MACD indicators and his own experience. For more information, check out his Best Crypto Scalping Strategy for the 5 Min Time Frame video. I have tried to automate this a little.
Long or Short trades are determined with a crossing of the fast Ema over the slow Ema for Long and the opposite for Short. Trades should only happen close to the crossovers. Then for Long we use the MACD indicator with a 1min TF (I had better results using the 5min) where we look for high peaks in negative values for Long and vice versa for Shorts. These should be significantly higher than other peaks (or if you will lower peaks for a Long).
Hence, the key is to detect high peaks on the histogram, which I try to achieve by checking if the last 2 values were higher than X bars back. If you want to make it even more specific, then you can turn on the additional checkbox which compares the current value to the average value of X bars back, and if it is greater than, say, 50% the value of the average (= 1.5x the average), then it's ok for the trade.
I also noticed that the strategy often bought at the top or bottom, so I added a check that compares whether the last evaluated bar is the first rising bar (for Long) or falling bar (for Short). This can be turned on or off.
Target profit 0,5% and stop loss 0,4% are based on his recommendation. The strategy is set to take only 1 trade at a time , and you can have a back tester table on.
I'm still a pine script beginner, so the strategy is certainly not perfect and could be improved. If you have any tips on how to improve it further, please let me know. I will try to update it when I have time.
I would also like to thank Joel on Crypto for sharing the strategy and @ZenAndTheArtOfTrading for his great library and code (thanks to him we have a back tester table in here), but especially his educational videos on youtube, which taught me a lot about pine script.
Simple EMA20 Strategy + StochasticThis is a Trend Following Strategy.
The intent of this strategy is to catchthe price as it trends higher than the 20-period EMA and sell immediately after the price closes below it.
I have implemented calculations from Stochastic to make sure the price is coming from an oversold area.
There is also a check to see if the 20-period EMA is trending higher than before.

(Short) EMA200+Parabolic SAR+MACD+TP&SL By Nussara (strategy)This indicator is backtest of “ (Short) EMA 200 + Parabolic SAR + MACD + Take Profit and Stop Loss”
You can simulate trading by setting your own funds and trading fees. And you can adjust various parameter settings to get the results you want.
Exponential Moving Average
Moving averages smooth the price data to form a trend following indicator. They do not predict price direction, but rather define the current direction, though they lag due to being based on past prices. Despite this, moving averages help smooth price action and filter out the noise.
EMA=Price(t)×k+EMA(y)×(1−k)
where:
t=today
y=yesterday
N=number of days in EMA
k=2÷(N+1)
Parabolic SAR
The Parabolic SAR is a technical indicator developed by J. Welles Wilder to determine the direction that an asset is moving. The indicator is also referred to as a stop and reverse system, which is abbreviated as SAR . It aims to identify potential reversals in the price movement of traded assets.
MACD
Moving average convergence divergence ( MACD ) is a trend-following momentum indicator that shows the relationship between two moving averages of a security’s price. The MACD is calculated by subtracting the 26-period exponential moving average ( EMA ) from the 12-period EMA . The result of that calculation is the MACD line. A nine-day EMA of the MACD called the "signal line," is then plotted on top of the MACD line, which can function as a trigger for buy and sell signals. Traders may buy the security when the MACD crosses above its signal line and sell—or short—the security when the MACD crosses below the signal line.
EMA 200 + Parabolic SAR + MACD (Short) formula
1. The price closes below the ema200 line.
2. MACD Line cross down Signal Line"
3. Parabolic SAR above the bar means that it is a downtrend.
If all three are true, the indicator will have a Short signal.
Risk to Reward Ratio = 1:1
Stop loss = Parabolic SAR point.
This indicator is just a tool for technical analysis . It shouldn't be used as the only indication of trade because it causes you to lose your money. You should use other indicators to analyze together.

Larry Williams 3 Period EMAs strategyLarry R. Williams explains this strategy in his book "Long-Term secrets to Short-Term trading", it consists of using two 3-period EMAs, one representing the Highs and the other the Lows.
When the price falls below the 3-period Lows EMA we have a long signal.
The trade is closed when the price closes above the 3-period Highs EMA . BINANCE:BTCUSDT

(Long) EMA 200 + Parabolic SAR + MACD By Nussara (strategy)This indicator is backtest of “ (Long) EMA 200 + Parabolic SAR + MACD + Take Profit and Stop Loss”
You can simulate trading by setting your own funds and trading fees. And you can adjust various parameter settings to get the results you want.
Exponential Moving Average
Moving averages smooth the price data to form a trend following indicator. They do not predict price direction, but rather define the current direction, though they lag due to being based on past prices. Despite this, moving averages help smooth price action and filter out the noise.
EMA=Price(t)×k+EMA(y)×(1−k)
where:
t=today
y=yesterday
N=number of days in EMA
k=2÷(N+1)
Parabolic SAR
The Parabolic SAR is a technical indicator developed by J. Welles Wilder to determine the direction that an asset is moving. The indicator is also referred to as a stop and reverse system, which is abbreviated as SAR. It aims to identify potential reversals in the price movement of traded assets.
MACD
Moving average convergence divergence (MACD) is a trend-following momentum indicator that shows the relationship between two moving averages of a security’s price. The MACD is calculated by subtracting the 26-period exponential moving average (EMA) from the 12-period EMA. The result of that calculation is the MACD line. A nine-day EMA of the MACD called the "signal line," is then plotted on top of the MACD line, which can function as a trigger for buy and sell signals. Traders may buy the security when the MACD crosses above its signal line and sell—or short—the security when the MACD crosses below the signal line.
EMA 200 + Parabolic SAR + MACD (Long) formula
1. The price closes above the ema200 line.
2. MACD Line above Signal Line
3. Parabolic SAR below the bar means that it is an uptrend.
If all three are true, the indicator will have a buy signal.
Risk to Reward Ratio = 1:1
Stop loss = Parabolic SAR point.
This indicator is just a tool for technical analysis. It shouldn't be used as the only indication of trade because it causes you to lose your money. You should use other indicators to analyze together.

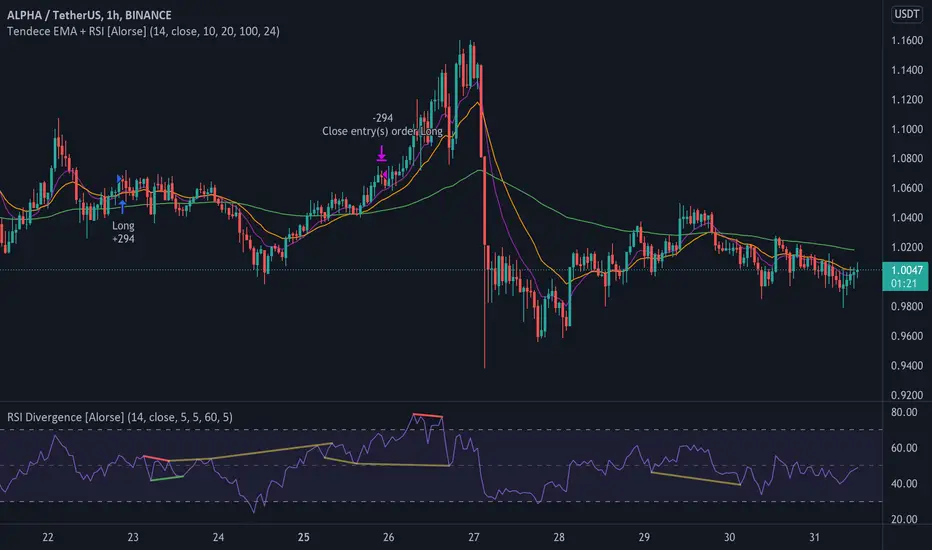
Tendency EMA + RSI [Alorse]A very simple and highly effective strategy LONG & SHORT that combines only 2 indicators:
RSI
3 Moving Average Exponential (EMA)
LONG Entry conditions are:
EMA 20 cross over EMA 10
EMA 10 is above EMA 100
LONG Exit conditions are:
RSI greater than 70
Or when X number of candles have passed and the trade is in profit. (Check Settings)
SHORT Entry conditions are:
EMA 20 cross under EMA 10
EMA 10 is below EMA 100
SHORT Exit conditions are:
RSI is less than 30
Or when X number of candles have passed and the trade is in profit. (Check Settings)
Forex Fractal EMA ScalperThis is a forex scalper designed for very short timeframes 1-5 min max.
At the same time due to the short timeframe, is recommend to re optimize it weekly .
Its components are
Fractals
Triple EMA with different lengths
Rules for entry:
For long : we have an up fractal and all 3 ema are in ascending order
For short: we have a down fractal and all 3 ema are in descending order.
Rules for exit
We exit when we either get a reverse order or when we hit the take profit or stop loss calculated in fixed pips.

Arch1tect's New Toy (Strategy Tester Version)Description:
The version of Arch1tect's New Toy indicator with Strategy Tester added.
This indicator tries to predict market trends by simply utilising 2 moving averages crossovers.
How it works:
Buy signals are triggered when the faster MA crosses over the slower MA from the downside to the upside.
Sell signals are triggered when the faster MA crosses under the slower MA from the upside to the downside.
How to use:
Take buys when buy signal is triggered AND close existing sell position
Take sells when sell signal is triggered AND close existing buy position
Note:
Settings are optimised for XAUUSD on the M1 chart.
Extra:
Alerts are included.
You can toggle between EMA, WMA and SMA to your liking.
Indicator version:

GEMA-Estrategia por neil-------------------
DESCRIPTION
GEMA-STRATEGY is a strategy generator based on SMA, EMA, WMA, RMA that considers elements such as ADX, DMI, RSI, stochastic, Stoploss, Takeprofit, angles and values at present point.
HOW DOES IT WORK
The component works as an assistant to which you configure the previous elements and you see the performance that it offers you, in such a way that you pass that configuration to GEMA-INDICATOR so that you can receive alerts and do visual trading with notifications or automated trading by sending messages to platforms like 3Commas.
WHY USE IT
The resource operates with one of the most important strategies in the market, which is the price tracking line, which means that if prices go up, we follow it, if prices go down, we follow it; in this way you do not need to make large investments as is often the case with pure BOTs, which require large reserves for security orders.
HOW TO USE IT
Press the "Indicators" option, go to the "Public Library" segment, write the name "GEMA-Estategia por Neil", double click on the record in question and you will have it added in your work panel, now, it only remains to use it and configure its parameters.
-------------------
DESCRIPCIÓN
GEMA-ESTRATEGIA en un generador de estrategias basado en SMA, EMA, WMA, RMA que considera elementos como ADX, DMI, RSI, Estocastico, Stoploss, Takeprofit, ángulos y valores a punto presente.
COMO FUNCIONA
El componente funciona como un asistente al que vas configurando lo elementos anteriores y vas viendo el rendimiento que te ofrece, de manera tal, que pases esa configuración a GEMA-INDICADOR para que puedas recibir alertas y hagas trading visual con notificaciones o trading automatizado enviando mensajes a plataformas como 3Commas.
POR QUÉ USARLO
El recurso opera con una de las estrategias mas importantes del mercado, que es la linea de seguimiento de precio, lo que significa que si los precios suben, lo seguimos, si los precios bajan, lo seguimos; de esta manera no necesita realizar grandes inversiones como suele ocurrir con los BOT puros, que exigen grandes reservas para las ordenes de seguridad.
COMO USARLO
Presione la opción "Indicadores", ubíquese en el segmento "Libreria Publica", escriba el nombre "GEMA-Estrategia por Neil", haga doble clic sobre el registro en cuestión y lo tendrá agregado en su panel de trabajo, ahora, solo resta usarlo y configurar sus paramertos.

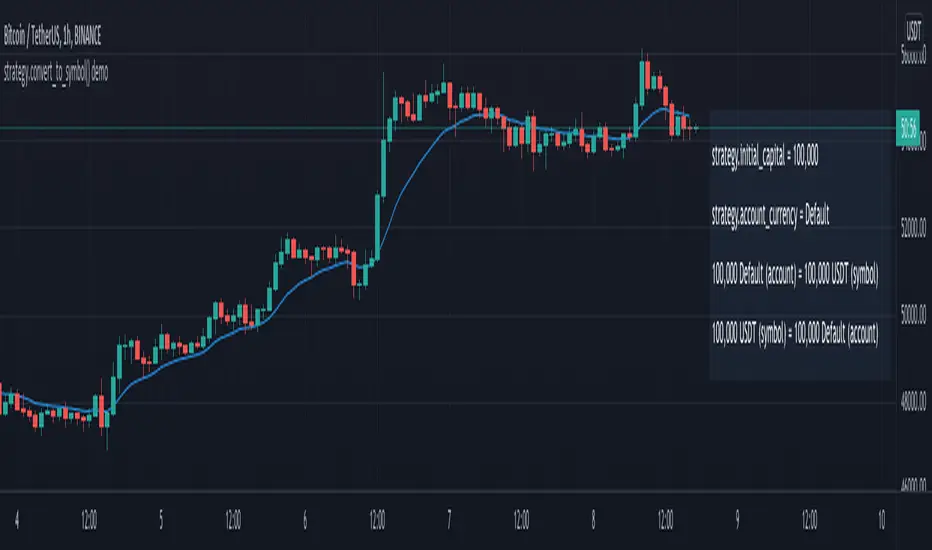
strategy.convert_to_symbol() demoA strategy demonstrating the new strategy.convert_to_symbol() and strategy.convert_to_account() functions introduced in Pine v5.
Try selecting a custom "Base Currency" under Properties to see how the conversion works.
Note: The conversion functions seem to work as expected on BTCUSD, but not on BTCUSDT. This is likely because USDT is not recognized as a currency.
AMRS_LongOnly_PartTimerThis Script is created to back-test the data starting 01/01/2000 based on AMRS strategy.
AMRS is long only strategy. It is based on unique calculation around moving averages and 2 year high price.
There are few strategies for moving average crossovers but AMRS strategy is unique compared to other moving averages strategies as it has very specific below mentioned calculations evolving around moving average and stock price.
AMRS strategy is unique one to generate buying signals when stock price creates new 2 year high and retraces back to 13 day EMA value.
AMRS strategy is unique one having specific calculation for entry signal and exit signal as mentioned below. This strategy gives back testing results to help build conviction on entry/exits if trades were taken in past as per the AMRS rules.
As per AMRS strategy this script generates green arrow on each time when new 2 year high is made and also generates long signal indicated by white arrow when stock price retraces back to 13 day EMA value and price is within 10% range from 2 year high.
This strategy will generate white arrow on the chart for each buy signal when stock price reaches 13 day EMA after first Long signal is generated. These subsequent buy signals can be used for pyramiding.
Entry Signal Logic : 1. Stock should be trading near 2 year high.
2. Stock price should be within 10% range from 2 year high
3. Stock price should be less than or equal to 13 day EMA and grater than equal to 21 day EMA
This AMRS strategy also generates exit signal for already generated buy signal (open position).
Exit signal generated when stock price closes 5% below 21 day EMA or when stock price closes below 20% from most recent 2 year high price.
Exit Signal Logic : 1. Stock price closes 5% below 21 day EMA or stock price closes below 20% from most recent 2 year high price.
2. Since exit logic is based on closing price it is plotted on the chart next day.
3. So when exit signal is plotted on the chart, previous days stock price is either closed below 5% of 21 day EMA or corrected 20% from recent 2 year high.
Note : To Calculate last entry positions % return, by default all positions are getting closed on mentioned end date.
Script parameters :
start date as 01/01/2000 - Constructed from Start Year - 2000, Start Month - 1 Start Date - 1
End date (mostly current date) Constructed from Values in End Year, End Month, End Date.
Initial Capital - Defaulted to 100000
Order Size - 5% of Equity
Pyramiding - 3 orders
Commission - 0.2%
Slippage - 1 tick (Since this strategy exit is on close basis mostly there wont be any slippages)

Williams Fractals StrategyThis indicator made with using Williams Fractals, 20 50 100 Moving Averages and Relative Strength Index. You can easily find entry points by using Long (L), Short (S) signals.
Note : Settings are optimized for BTC:USDT Perpetual 15min TF. For use different pairs or TFs you may need to change settings.

Dagger V1 strategyThe "Dagger V1 strategy" strategy is used for the backtest of the "Dagger V1 indicator & alerter" indicator. Their algorithm is identical. Further, all descriptions of the settings are the same for the strategy and the indicator.
Dagger is used for trading on the cryptocurrency spot market, but it can also be used for any other fairly volatile pairs.
Dagger shows the best results on the H1 timeframe, but you can experiment with other timeframes.
The logic of Dagger's work is based on the search for the optimal entry point into the market and the best moment to close a deal. Stochastic oscillator and exponential moving EMA are used for this. Also, the exit from the transaction can be optimized using several parameters.
The strategy can use trailing up to one or more red bars in order not to miss the sharp growth of the currency.

TemaVWAPRSI StrategyExchange: Kraken
Timeframe: 5m
Pair: ETH/USD
If you use this for any other exchange or pair, you'll have to tweak the settings, most importantly are the trailing stop ticks. This strategy is currently in what I would call beta mode. It uses the volume weighted average price indicator, rate of change, two triple exponential moving averages and the relative strength index to find buy and sell signals.

Moving Average Band - Taylor V1A Very Simple Strategy From Moving Average
- Price Breakout Upper Band = Long
- Price Breakout Lower Band = Short
Moving Average Type = Able to Change RMA, EMA, SMA, WMA
Moving Average Period = Able to Change
Upper Band & Lower Band Gap = Able to Change
With Stop Lose & Take Profit = Able to Change

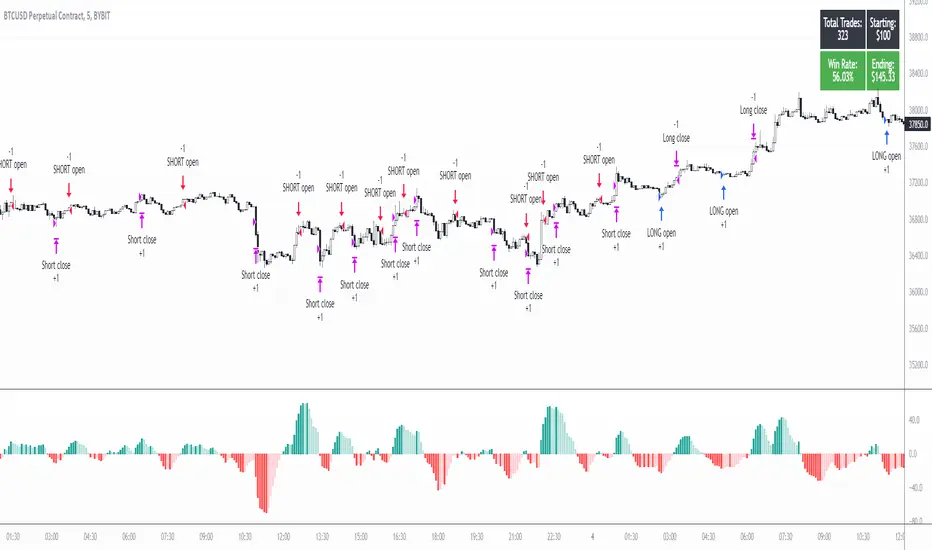
Take Profit On Trend (by BHD_Trade_Bot)The purpose of strategy is to detect long-term uptrend and short-term downtrend so that you can easy to take profit.
The strategy also using BHD unit to detect how big you win and lose, so that you can use this strategy for all coins without worry about it have different percentage of price change.
ENTRY
The buy order is placed on assets that have long-term uptrend and short-term downtrend:
- Long-term uptrend condition: ema200 is going up (rsi200 greater than 51)
- Short-term downtrend condition: 2 last candles are down price (use candlestick for less delay)
CLOSE
The sell order is placed when take profit or stop loss:
- Take profit: price increase 1 BHD unit
- Stop loss: price decrease 2 BHD units
The strategy use $15 and trading fee is 0.1% for each order. So that, in the real-life, if you are using trade bot, it will need $1500 for trading 100 coins at the same time.
Pro tip : The 1-hour time frame for altcoin/USDT has the best results on average.
