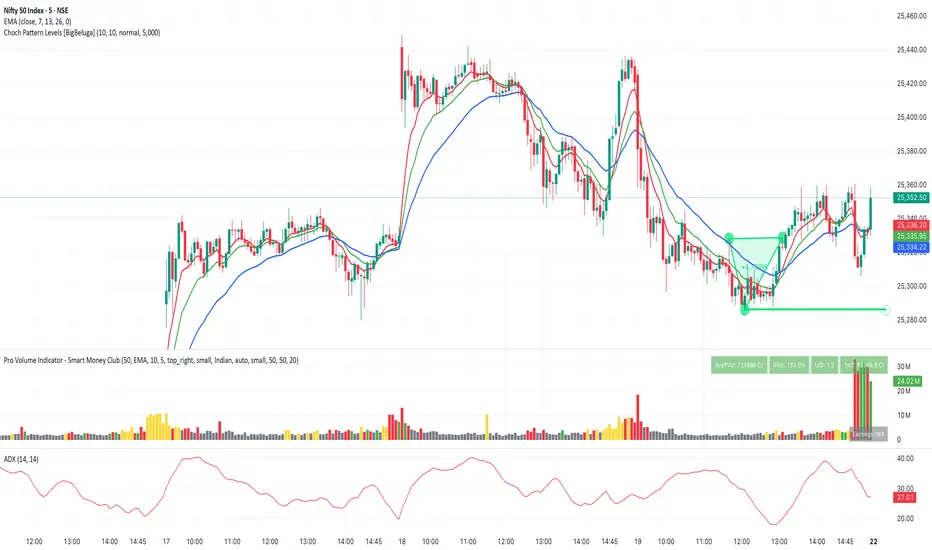
AI Trading Alerts v6 — SL/TP + Confidence + Panel (Fixed)Overview
This Pine Script is designed to identify high-probability trading opportunities in Forex, commodities, and crypto markets. It combines EMA trend filters, RSI, and Stochastic RSI, with automatic stop-loss (SL) & take-profit (TP) suggestions, and provides a confidence panel to quickly assess the trade setup strength.
It also includes TradingView alert conditions so you can set up notifications for Long/Short setups and EMA crosses.
⚙️ Features
EMA Trend Filter
Uses EMA 50, 100, 200 for trend confirmation.
Bull trend = EMA50 > EMA100 > EMA200
Bear trend = EMA50 < EMA100 < EMA200
RSI Filter
Bullish trades require RSI > 50
Bearish trades require RSI < 50
Stochastic RSI Filter
Prevents entries during overbought/oversold extremes.
Bullish entry only if %K and %D < 80
Bearish entry only if %K and %D > 20
EMA Proximity Check
Price must be near EMA50 (within ATR × adjustable multiplier).
Signals
Continuation Signals:
Long if all bullish conditions align.
Short if all bearish conditions align.
Cross Events:
Long Cross when price crosses above EMA50 in bull trend.
Short Cross when price crosses below EMA50 in bear trend.
Automatic SL/TP Suggestions
SL size adjusts depending on asset:
Gold/Silver (XAU/XAG): 5 pts
Bitcoin/Ethereum: 100 pts
FX pairs (default): 20 pts
TP = SL × Risk:Reward ratio (default 1:2).
Confidence Score (0–4)
Based on conditions met (trend, RSI, Stoch, EMA proximity).
Labels:
Strongest (4/4)
Strong (3/4)
Medium (2/4)
Low (1/4)
Visual Panel on Chart
Shows ✅/❌ for each condition (trend, RSI, Stoch, EMA proximity, signal now).
Confidence row with color-coded strength.
Alerts
Long Setup
Short Setup
Long Cross
Short Cross
🖥️ How to Use
1. Add the Script
Open TradingView → Pine Editor.
Paste the full script.
Click Add to chart.
Save as "AI Trading Alerts v6 — SL/TP + Confidence + Panel".
2. Configure Inputs
EMA Lengths: Default 50/100/200 (works well for swing trading).
RSI Length: 14 (standard).
Stochastic Length/K/D: Default 14/3/3.
Risk:Reward Ratio: Default 2.0 (can change to 1.5, 3.0, etc.).
EMA Proximity Threshold: Default 0.20 × ATR (adjust to be stricter/looser).
3. Read the Panel
Top-right of chart, you’ll see ✅ or ❌ for:
Trend → Are EMAs aligned?
RSI → Above 50 (bull) or below 50 (bear)?
Stoch OK → Not extreme?
Near EMA50 → Close enough to EMA50?
Above/Below OK → Price position vs. EMA50 matches trend?
Signal Now → Entry triggered?
Confidence row:
🟢 Green = Strongest
🟩 Light green = Strong
🟧 Orange = Medium
🟨 Yellow = Low
⬜ Gray = None
4. Alerts Setup
Go to TradingView Alerts (⏰ icon).
Choose the script under “Condition”.
Select alert type:
Long Setup
Short Setup
Long Cross
Short Cross
Set notification method (popup, sound, email, mobile).
Click Create.
Now TradingView will notify you automatically when signals appear.
5. Example Workflow
Wait for Confidence = Strong/Strongest.
Check if market session supports volatility (e.g., XAU in London/NY).
Review SL/TP suggestions:
Long → Entry: current price, SL: close - risk_pts, TP: close + risk_pts × RR.
Short → Entry: current price, SL: close + risk_pts, TP: close - risk_pts × RR.
Adjust based on your own price action analysis.
📊 Best Practices
Use on H1 + D1 combo → align higher timeframe bias with intraday entries.
Risk only 1–2% of account per trade (position sizing required).
Filter with market sessions (Asia, Europe, US).
Strongest signals work best with trending pairs (e.g., XAUUSD, USDJPY, BTCUSD).
Media Móvil Exponencial (EMA)

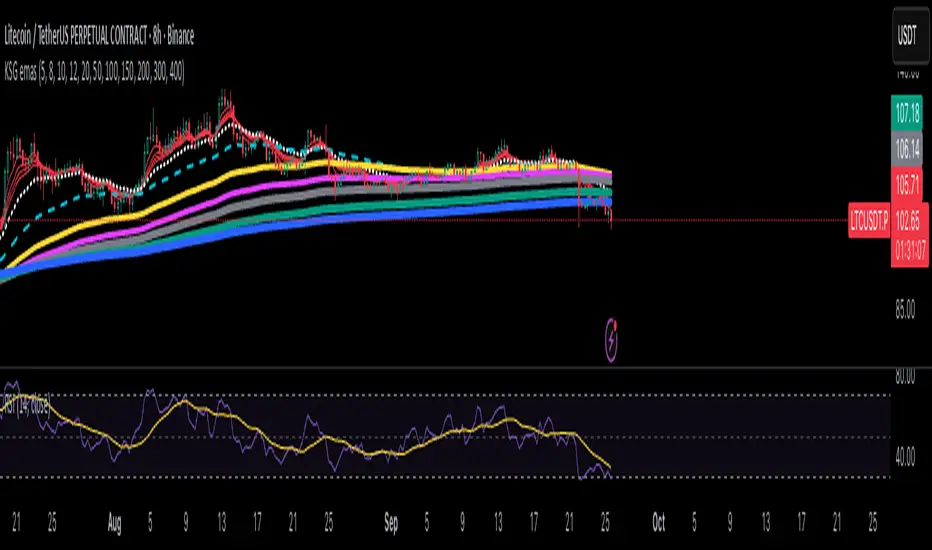
KSG emasThis script plots 10 customizable Exponential Moving Averages (EMAs). Each EMA length and color can be adjusted in the settings. It’s designed for traders who want to track multiple EMAs at once for trend analysis and strategy development.
Anchored EMA/VWAP### Anchored EMA/VWAP Indicator
**Description:**
The **Anchored EMA/VWAP Indicator** is a powerful and versatile tool designed for traders seeking to analyze price trends and momentum from a user-defined anchor point in time. Built for TradingView using Pine Script v6, this indicator calculates and displays multiple **Exponential Moving Averages (EMAs)**, **Volume-Weighted Exponential Moving Averages (VWEMAs)**, and a **Volume-Weighted Average Price (VWAP)**, all anchored to a specific date and time chosen by the user. By anchoring these calculations, traders can focus on price action relative to significant market events, such as news releases, earnings reports, or key support/resistance levels.
The indicator supports multi-timeframe (MTF) analysis, allowing users to compute EMAs, VWEMAs, and VWAP on a higher or custom timeframe (e.g., 5-minute, 1-hour, daily) while overlaying the results on the current chart. It also includes customizable cross signals for EMA and VWEMA pairs, marked with distinct shapes (circles, diamonds, squares) to highlight potential trend changes or reversals. These features make the indicator ideal for trend-following, momentum trading, and identifying key price levels across various markets, including stocks, forex, cryptocurrencies, and commodities.
**Key Features:**
- **Anchored Calculations**: EMAs, VWEMAs, and VWAP start calculations from a user-specified anchor time, enabling analysis relative to significant market moments.
- **Multi-Timeframe Support**: Compute indicators on any timeframe (e.g., 60-minute, daily) and display them on the chart’s timeframe for flexible analysis.
- **Customizable EMAs and VWEMAs**: Four EMAs and four VWEMAs with adjustable lengths (default: 9, 21, 50, 100) and colors, with options to show or hide each.
- **Volume-Weighted Metrics**: VWAP and VWEMAs incorporate volume data, providing a more robust representation of market activity compared to standard EMAs.
- **Cross Signals**: Visual markers (circles, diamonds, squares) for crossovers between EMA and VWEMA pairs, with customizable visibility to highlight bullish (up) or bearish (down) signals.
- **User-Friendly Interface**: Organized input groups for General, EMA, VWEMA, VWAP, Arrow Settings, and Cross Visibility, with intuitive inline inputs for length and color customization.
- **Visual Clarity**: Overlaid on the price chart with distinct colors and line styles (dotted for EMAs, dashed for VWEMAs, solid for VWAP) to ensure easy interpretation.
**How to Use:**
1. **Set the Anchor Time**: Click a specific bar or enter a date/time (default: June 1, 2025) to start calculations from a significant market event.
2. **Select Timeframe**: Choose a timeframe (e.g., "5" for 5-minute, "D" for daily) to compute the indicators, allowing alignment with your trading strategy.
3. **Customize EMAs and VWEMAs**: Adjust lengths and colors for up to four EMAs and VWEMAs, and toggle their visibility to focus on relevant lines.
4. **Enable VWAP**: Display the anchored VWAP to identify volume-weighted price levels, useful as dynamic support/resistance.
5. **Monitor Cross Signals**: Enable cross visibility for specific EMA or VWEMA pairs to spot potential trend changes. Bullish crosses (e.g., shorter EMA crossing above longer EMA) are marked with green shapes below the bar, while bearish crosses are marked with red shapes above the bar.
6. **Interpret Signals**: Use EMA/VWEMA crossovers for trend confirmation, VWAP as a mean-reversion level, and volume-weighted VWEMAs for momentum analysis in high-volume markets.
**Use Cases:**
- **Trend Trading**: Identify trend direction using EMA and VWEMA crossovers, with shorter lengths (e.g., 9, 21) for faster signals and longer lengths (e.g., 50, 100) for trend confirmation.
- **Mean Reversion**: Use the anchored VWAP as a dynamic support/resistance level to trade pullbacks or breakouts.
- **Event-Based Analysis**: Anchor the indicator to significant events (e.g., earnings, economic data releases) to analyze price behavior post-event.
- **Multi-Timeframe Strategies**: Combine higher timeframe EMAs/VWAPs with lower timeframe price action for high-probability setups.
**Settings:**
- **Anchor Time**: Set the starting point for calculations (default: June 1, 2025).
- **Timeframe**: Choose the timeframe for calculations (default: 5-minute).
- **EMA/VWEMA Lengths**: Default lengths of 9, 21, 50, and 100 for both EMAs and VWEMAs, adjustable per user preference.
- **Colors**: Customizable colors with slight transparency for visual clarity.
- **Cross Visibility**: Toggle specific EMA and VWEMA cross signals (e.g., EMA1/EMA2, VWEMA1/VWEMA3) to reduce chart clutter.
- **Arrow Colors**: Green for bullish crosses, red for bearish crosses.
**Notes:**
- The indicator is overlaid on the price chart, ensuring seamless integration with price action analysis.
- VWEMAs and VWAP are volume-sensitive, making them particularly effective in markets with significant volume fluctuations.
- Ensure the anchor time is set to a valid historical or future bar to avoid calculation errors.
- Cross signals are conditional on non-NA values to prevent false positives during initialization.
**Author**: NEPOLIX
**Version**: 6 (Pine Script v6)
**Published**: For TradingView Community
This indicator is a must-have for traders looking to combine anchored, volume-weighted, and multi-timeframe analysis into a single, customizable tool. Whether you're a day trader, swing trader, or long-term investor, the Anchored EMA/VWAP Indicator provides actionable insights for informed trading decisions.

Sols Day Trading Signals (5m / 10m)This indicator is designed for day trading on the 5-minute and 10-minute charts.
Includes:
EMA 9 & EMA 21 crossover signals
MACD momentum confirmation
RSI trend filter (50+)
Buy/Sell labels directly on the chart
💡 How to Use:
Go long when EMA 9 crosses above EMA 21, MACD is positive, and RSI is above 50
Go short when EMA 9 crosses below EMA 21, MACD is negative, and RSI is below 50
Best used with proper risk management (1-2% per trade)
⚠️ Disclaimer: This is for educational purposes only — always backtest and trade responsibly.

Multi EMA and Key Levels IndicatorKey Features:
Daily and Previous Day Levels
Plots today’s high and low.
Plots the previous day’s high (Y HOD) and low (Y LOD), with labels anchored to the price axis.
Premarket (Globex) High and Low
Tracks premarket session highs and lows (defined as 5:00 PM to 8:30 AM Chicago time).
Updates dynamically during the session and plots “GLOBEX HIGH” and “GLOBEX LOW” lines with labels.
Exponential & Simple Moving Averages
User can select 3 EMAs (default 8, 21, 200).
Plots EMAs with distinct colors.
Plots the 200-day SMA for longer-term trend context.

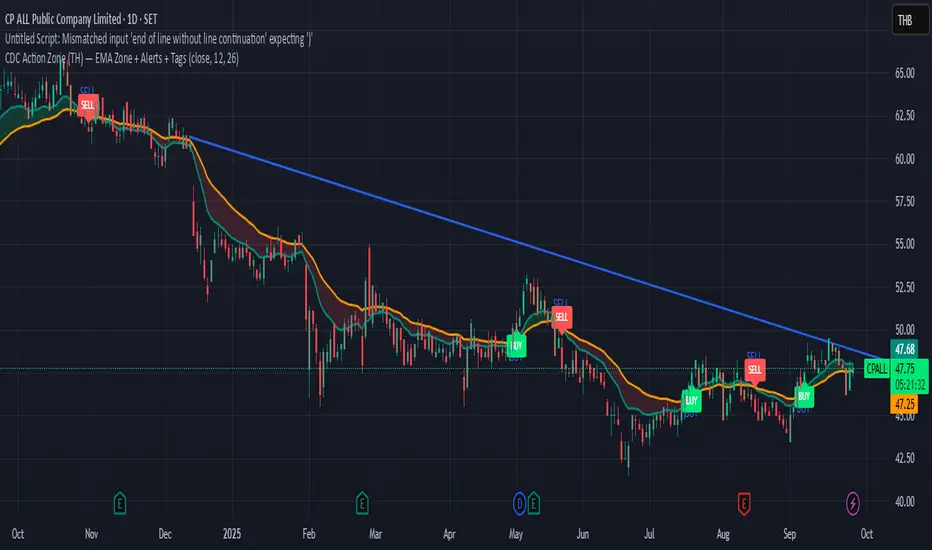
CDC Action Zone (TH) by MeowToolsThe CDC Action Zone indicator is like a stock market traffic light — it tells you when it’s green to go and when it’s red to stop. By combining just two EMAs (12 and 26), it highlights Buy and Sell zones clearly, cutting through market noise and keeping you on the right side of the trend. Think of it as a radar that spots the big moves before most people notice, giving you the confidence to ride the trend and exit before getting trapped. Meow 😺 give it a try and see how it can help your portfolio take off 🚀📈
Trend Pro V2 [CRYPTIK1]Introduction: What is Trend Pro V2?
Welcome to Trend Pro V2! This analysis tool give you at-a-glance understanding of the market's direction. In a noisy market, the single most important factor is the dominant trend. Trend Pro V2 filters out this noise by focusing on one core principle: trading with the primary momentum.
Instead of cluttering your chart with confusing signals, this indicator provides a clean, visual representation of the trend, helping you make more confident and informed trading decisions.
The dashboard provides a simple, color-coded view of the trend across multiple timeframes.
The Core Concept: The Power of Confluence
The strength of any trading decision comes from confluence—when multiple factors align. Trend Pro V2 is built on this idea. It uses a long-term moving average (200-period EMA by default) to define the primary trend on your current chart and then pulls in data from three higher timeframes to confirm whether the broader market agrees.
When your current timeframe and the higher timeframes are all aligned, you have a state of "confluence," which represents a higher-probability environment for trend-following trades.
Key Features
1. The Dynamic Trend MA:
The main moving average on your chart acts as your primary guide. Its color dynamically changes to give you an instant read on the market.
Teal MA: The price is in a confirmed uptrend (trading above the MA).
Pink MA: The price is in a confirmed downtrend (trading below the MA).
The moving average changes color to instantly show you if the trend is bullish (teal) or bearish (pink).
2. The Multi-Timeframe (MTF) Trend Dashboard:
Located discreetly in the bottom-right corner, this dashboard is your window into the broader market sentiment. It shows you the trend status on three customizable higher timeframes.
Teal Box: The trend is UP on that timeframe.
Pink Box: The trend is DOWN on that timeframe.
Gray Box: The price is neutral or at the MA on that timeframe.
How to Use Trend Pro V2: A Simple Framework
Step 1: Identify the Primary Trend
Look at the color of the MA on your chart. This is your starting point. If it's teal, you should generally be looking for long opportunities. If it's pink, you should be looking for short opportunities.
Step 2: Check for Confluence
Glance at the MTF Trend Dashboard.
Strong Confluence (High-Probability): If your main chart shows an uptrend (Teal MA) and the dashboard shows all teal boxes, the market is in a strong, unified uptrend. This is a high-probability environment to be a buyer on dips.
Weak or No Confluence (Caution Zone): If your main chart shows an uptrend, but the dashboard shows pink or gray boxes, it signals disagreement among the timeframes. This is a sign of market indecision and a lower-probability environment. It's often best to wait for alignment.
Here, the daily trend is down, but the MTF dashboard shows the weekly trend is still up—a classic sign of weak confluence and a reason for caution.
Best Practices & Settings
Timeframe Synergy: For best results, use Trend Pro on a lower timeframe and set your dashboard to higher timeframes. For example, if you trade on the 1-hour chart, set your MTF dashboard to the 4-hour, 1-day, and 1-week.
Use as a Confirmation Tool: Trend Pro V2 is designed as a foundational layer for your analysis. First, confirm the trend, then use your preferred entry method (e.g., support/resistance, chart patterns) to time your trade.
This is a tool for the community, so feel free to explore the open-source code, adapt it, and build upon it. Happy trading!
For your consideration @TradingView

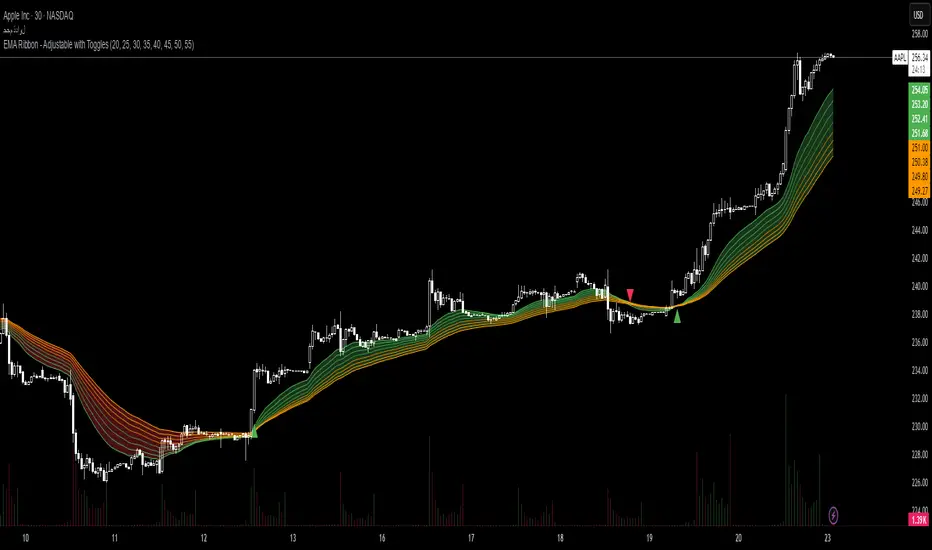
EMA Ribbon - Adjustable with Toggles📌 Script Name:
EMA Ribbon - Adjustable with Toggles
🧠 Primary Function:
This script plots a customizable Exponential Moving Average (EMA) Ribbon on Trading View charts. It allows the user to enable or disable any of the 8 EMAs individually and shows buy/sell signals based on the crossover between the fastest and slowest EMAs.
⚙️ Key Features:
✅ User Controls:
Toggle ON/OFF each of the 8 EMAs independently.
Set the length of each EMA (from 1 upward).
EMA colors vary based on their speed (green for faster, orange for slower).
📈 EMA Calculation:
Calculates 8 separate EMAs using the closing price (close).
🎨 Chart Visualization:
Plots each EMA with a unique color and transparency.
Draws a colored ribbon between the highest and lowest active EMAs to visualize trend zones.
📊 Trend Direction Logic:
The trend is determined solely based on EMA 1 (fastest) and EMA 8 (slowest).
A bullish trend is when EMA 1 > EMA 8, and bearish when EMA 1 < EMA 8.
📍 Buy/Sell Signals:
Buy Signal: When the trend shifts from bearish to bullish (EMA 1 crosses above EMA 8).
Sell Signal: When the trend shifts from bullish to bearish (EMA 1 crosses below EMA 8).
Signals are displayed as green (buy) and red (sell) triangles on the chart.
🔔 Alerts:
Built-in alert conditions for buy and sell signals.
Custom alert messages in Arabic (can be modified if needed).
🌟 Additional Highlights:
Well-structured and easy to expand.
Great for trend-following strategies using EMA ribbons.
Helps identify consolidation zones and trend confirmation.
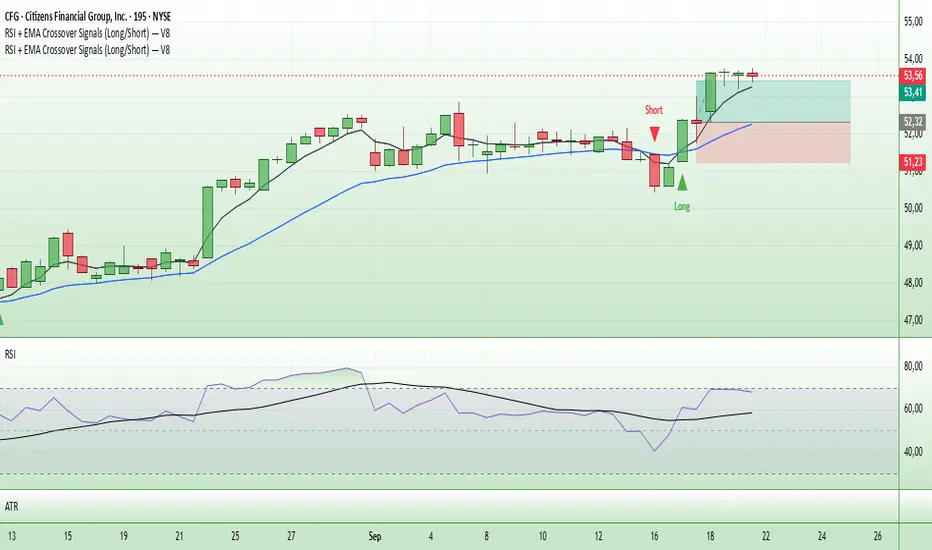
Entry Signals (Long/Short)The indicator visualizes precise entry signals for long and short setups directly on the price chart. Long is marked with a green triangle-up, short with a red triangle-down. To contextualize trend structure, the Fast EMA (5) is plotted in black and the Slow EMA (20) in blue (line width 1). Signals print only at bar close for reproducible execution. Applicable across all timeframes—ideal for top-down analysis from the 195-minute chart through daily to weekly.
QTrade Golden, Bronze & Death, Bubonic Cross AlertsThis indicator highlights key EMA regime shifts with simple, color-coded triangles:
- Golden / Death Cross — 50 EMA crossing above/below the 200 EMA.
- Bronze / Bubonic Cross — 50 EMA crossing above/below the 100 EMA.
- Early-Warning Proxy — tiny triangles for the 4 EMA vs. 200 EMA (4↑200 and 4↓200). These often fire before the 50/100 and 50/200 crosses.
No text clutter on the chart—just triangles. Colors: gold (50↑200), red (50↓200), darker-yellow bronze (50↑100), burgundy (50↓100), turquoise (4↑200), purple (4↓200).
What it tells you (in order of warning → confirmation)
- First warning: 4 EMA crosses the 200 EMA (proxy for price shifting around the 200 line).
- Second warning: 50 EMA crosses the 100 EMA (Bronze/Bubonic).
- Confirmation: 50 EMA crosses the 200 EMA (Golden/Death).
Alerts included
- Golden Cross (50↑200) and Death Cross (50↓200)
- Bronze Cross (50↑100) and Bubonic Cross (50↓100)
- 4 EMA vs. 200 EMA crosses (up & down) — early-warning proxy
- Price–100 EMA events (touch/cross, if enabled in settings)

Anrazzi - EMAs/ATR - 1.0.2The Anrazzi – EMAs/ATR indicator is a multi-purpose overlay designed to help traders track trend direction and market volatility in a single clean tool.
It plots up to six customizable moving averages (MAs) and an Average True Range (ATR) value directly on your chart, allowing you to quickly identify market bias, dynamic support/resistance, and volatility levels without switching indicators.
This script is ideal for traders who want a simple, configurable, and efficient way to combine trend-following signals with volatility-based position sizing.
📌 Key Features
Six Moving Averages (MA1 → MA6)
Toggle each MA on/off individually
Choose between EMA or SMA for each
Customize length and color
Perfect for spotting trend direction and pullback zones
ATR Display
Uses Wilder’s ATR formula (ta.rma(ta.tr(true), 14))
Can be calculated on current or higher timeframe
Adjustable multiplier for position sizing (e.g., 1.5× ATR stops)
Displays cleanly in the bottom-right corner
Custom Watermark
Displays symbol + timeframe in top-right
Adjustable color and size for streamers, screenshots, or clear charting
Compact UI
Organized with group and inline inputs for quick configuration
Lightweight and optimized for real-time performance
⚙️ How It Works
MAs: The script uses either ta.ema() or ta.sma() to compute each moving average based on the user-selected type and length.
ATR: The ATR is calculated using ta.rma(ta.tr(true), 14) (Wilder’s smoothing), and optionally scaled by a multiplier for easier use in risk management.
Tables: ATR value and watermark are displayed using table.new() so they stay anchored to the screen regardless of zoom level.
📈 How to Use
Enable the MAs you want to track and adjust their lengths, type, and colors.
Enable ATR if you want to see volatility — optionally select a higher timeframe for broader context.
Use MAs to:
Identify overall trend direction (e.g. price above MA20 = bullish)
Spot pullback zones for entries
See when multiple MAs cluster together as support/resistance zones
Use ATR value to:
Size your stop-loss dynamically (e.g. stop = entry − 1.5×ATR)
Detect volatility breakouts (ATR spikes = market expansion)
🎯 Recommended For
Day traders & swing traders
Trend-following & momentum strategies
Volatility-based risk management
Traders who want a clean, all-in-one dashboard

EMA RSI CrossThe EMA RSI Cross (ERC) indicator combines exponential moving average (EMA) crossovers with relative strength index (RSI) momentum signals to highlight potential bullish and bearish trading opportunities.
It works in two layers:
EMA Cross Layer: Tracks short‑term vs. mid‑term trend shifts using EMA(5) crossing above/below EMA(20), while also displaying EMA(50) and EMA(200) for longer‑term structure.
RSI Confirmation Layer: Confirms momentum by requiring RSI(14) to cross its moving average (SMA 14) within a recent lookback window.
Only when both conditions align, and the price confirms the setup in relation to EMA20, a signal is generated:
Bullish Signal (green triangle): EMA5 crosses above EMA20 + RSI crosses up + close above EMA20
Bearish Signal (red triangle): EMA5 crosses below EMA20 + RSI crosses down + close below EMA20
Features
Customizable timeframe input for multi‑timeframe analysis
Adjustable lookback period for RSI confirmation
Clear charting with EMA overlays and arrow signals when confirmed setups occur
RSI panel with dynamic background and overbought/oversold visualization
How to Use
Add the script to your chart, select your preferred signal timeframe.
Look for green arrows as bullish entry confirmation and red arrows for bearish setups.
Use additional filters (trend direction, support/resistance, volume) to refine trades.
Avoid relying on signals in sideways/choppy markets where EMA and RSI may give false triggers.

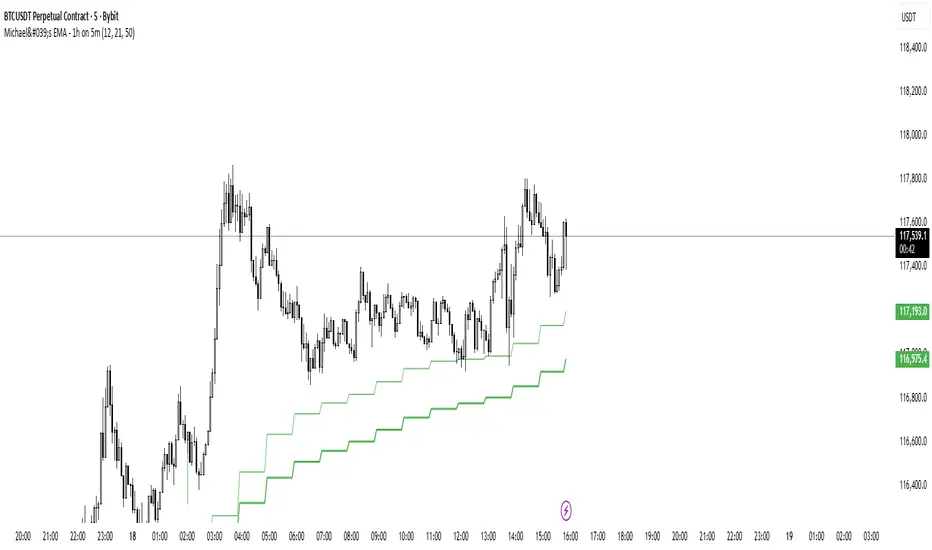
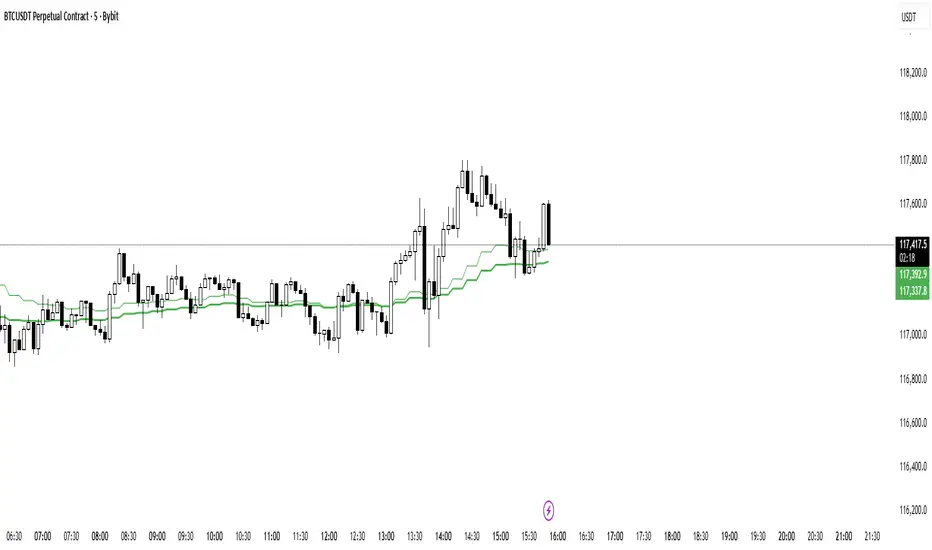
Michael's EMA - 1h on 5mMichael's EMA - 1h You can use this indicator on all time frame and be able to see the H4 Bands, that help you with less layout and better view
GM
Michael's EMA - 15m on 5mMichael's EMA - 15m on 5m You can use this indicator on all time frame and be able to see the H4 Bands, that help you with less layout and better view
GM
Michael's EMA - 4h on 5mH4 Michael's EMA on all TF, You can use this indicator on all time frame and be able to see the H4 Bands, that help you with less layout and better view
GM

Dual EMA (EMA Average)Simple EMA visual with 2 EMAs + Average
Includes:
2 EMAs with timeframe settings
EMA Midline - an average of EMAs
shaded space between EMA lines

MAxRSI Signals [KedArc Quant]Description:
MAxRSI Indicator Marks LONG/SHORT signals from a Moving Average crossover and (optionally) confirms them with RSI. Includes repaint-safe confirmation, optional higher-timeframe (HTF) smoothing, bar coloring, and alert conditions.
Why combine MA + RSI
* The MA crossover is the primary trend signal (fast trend vs slow trend).
* RSI is a gate, not a second, separate signal. A crossover only becomes a trade signal if momentum agrees (e.g., RSI ≥ level for LONG, ≤ level for SHORT). This reduces weak crosses in ranging markets.
* The parts are integrated in one rule: *Crossover AND RSI condition (if enabled)* → plot signal/alert. No duplicated outputs or unrelated indicators.
How it works (logic)
* MA types: SMA / EMA / WMA / HMA (HMA is built via WMA of `len/2` and `len`, then WMA with `sqrt(len)`).
* Signals:
* LONG when *Fast MA crosses above Slow MA* and (if enabled) *RSI ≥ Long Min*.
* SHORT when *Fast MA crosses below Slow MA* and (if enabled) *RSI ≤ Short Max*.
* Repaint-safe (optional): confirms crosses on closed bars to avoid intrabar repaint.
* HTF (optional): computes MA/RSI on a higher timeframe to smooth noise on lower charts.
* Alerts: crossover alerts + state-flip (bull↔bear) alerts.
How to use (step-by-step)
1. Add to chart. Set MA Type, Fast and Slow (keep Fast < Slow).
2. Turn Use RSI Filter ON for confirmation (default: RSI 14 with 50/50 levels).
3. (Optional) Turn Repaint-Safe ON for close-confirmed signals.
4. (Optional) Turn HTF ON (e.g., 60 = 1h) for smoother signals on low TFs.
5. Enable alerts: pick “MAxRSI Long/Short” or “Bullish/Bearish State”.
Timeframe guidance
* Intraday (1–15m): EMA 9–20 fast vs EMA 50 slow, RSI filter at 50/50.
* Swing (1h–D): EMA 20 fast vs EMA 200 slow, RSI 50/50 (55/45 for stricter).
What makes it original
* Repaint-safe cross confirmation (previous-bar check) for reliable signals/alerts.
* HTF gating (doesn’t compute both branches) for speed and clarity.
* Warning-free MA helper (precomputes SMA/EMA/WMA/HMA each bar), HMA built from built-ins only.
* State-flip alerts and optional RSI overlay on price pane.
Built-ins used
`ta.sma`, `ta.ema`, `ta.wma`, (HMA built from these), `ta.rsi`, `ta.crossover`, `ta.crossunder`, `request.security`, `plot`, `plotshape`, `barcolor`, `alertcondition`, `input.*`, `math.*`.
Note: Indicator only (no orders). Test settings per symbol. Not financial advice.
⚠️ Disclaimer
This script is provided for educational purposes only.
Past performance does not guarantee future results.
Trading involves risk, and users should exercise caution and use proper risk management when applying this strategy.

Anrazzi - EMAs/ATR - 1.0.2Description:
The Anrazzi - EMAs/ATR indicator is a versatile tool for technical traders looking to monitor multiple moving averages alongside the Average True Range (ATR) on any chart. Designed for simplicity and customization, it allows traders to visualize up to six moving averages with configurable type, color, and length, while keeping real-time volatility information via ATR directly on the chart.
This indicator is perfect for spotting trends, identifying support/resistance zones, and gauging market volatility for intraday or swing trading strategies.
Key Features:
Supports up to six independent moving averages (MA1 → MA6)
Each MA is fully customizable:
Enable/disable individually
Type: EMA or SMA
Length
Color
ATR Display:
Custom timeframe
Color and position configurable
Adjustable multiplier
Compact and organized settings for easy configuration
Lightweight and efficient code for smooth chart performance
Watermark
Inputs / Settings:
MA Options: MA1 → MA6 (Enable/Disable, Type, Length, Color)
Additional Settings: ATR (Enable, Timeframe, Color, Multiplier)
How to Use:
Enable the moving averages you want to track
Configure type, length, and color for each MA
Enable ATR if needed and adjust settings
Watch MAs plotted dynamically and ATR in bottom-right corner
Recommended For:
Day traders and swing traders
Trend-following strategies
Volatility analysis and breakout detection
Traders needing a compact multi-MA dashboard

Dynamic EMA Stack Support & ResistanceEvery trader needs reliable support and resistance — but static zones and lagging indicators won't cut it in fast-moving markets. This script combines a Fibonacci-based 5-EMA stacking system and left/right pivots that create dynamic support & resistance logic to uncover real-time structural shifts & momentum zones that actually adapt to price action. This isn’t just a mashup — it’s a complete built-from-the-ground-up support & resistance engine designed for scalpers, intraday traders, and trend followers alike.
🧠 🧠 🧠What It Does🧠 🧠 🧠
This script uses two powerful engines working in sync:
1️⃣ EMA Stack (5-EMA Framework)
Built on Fibonacci-based lengths: 5, 8, 13, 21, 34, (configurable) this stack identifies:
🔹 Bullish Stack: EMAs aligned from fastest to slowest (uptrend confirmation)
🔹 Bearish Stack: EMAs aligned inversely (downtrend confirmation)
🟡 Narrowing Zones: When EMAs compress within ATR thresholds → possible breakout or reversal zone
🎯 Labels identify key transitions like:
✅"Begin Bear Trend?"
✅"Uptrend SPRT"
✅"RES?" (resistance test)
2️⃣ Pivot-Based Projection Engine
Using classic Left/Right Bar pivot logic, the script:
📌 Detects early-stage swing highs/lows before full confirmation
📈 Projects horizontal S/R lines that adapt to market structure
🔁 Keeps lines active until a new pivot replaces them
🧩 Syncs beautifully with EMA stack for confluence zones
🎯🎯🎯Key Features for Traders🎯🎯🎯
✅ Trend Detection
→ EMA order reveals real-time bias (bullish, bearish, compression)
✅ Dynamic S/R Zones
→ Historical support/resistance levels auto-draw and extend
✅ Smart Labeling
→ “SPRT”, “RES”, and “Trend?” labels for live context + testing logic
✅ Custom Candle Coloring
→ Choose from Bar Color or Full Candle Overlay modes
✅ Scalper & Swing Compatible
→ Use fast confirmations for scalping or stack consistency for longer trends
⚙️⚙️⚙️How to Use⚙️⚙️⚙️
✅Use Top/Bottom (trend state) Line Colors to quickly read trend conditions.
✅Use Pivot-based support/resistance projections to anticipate where price might pause or reverse.
✅Watch for yellow/blue zones to prepare for volatility shifts/reversals.
✅Combine with volume or momentum indicators for added confirmation.
📐📐📐Customization Options📐📐📐
✅EMA lengths (5, 8, 13, 21, 34) — fully configurable - try 21,34,55, 89, 144 for longer term trend states
✅Left/Right bar pivot settings (default: 21/5)
✅Label size, visibility, and color themes
✅Toggle line and label visibility for clean layouts
✅“Max Bars Back” to control how deep history is scanned safely
🛠🛠🛠Built-In Safeguards🛠🛠🛠
✅ATR-based filters to stabilize compression logic
✅Guarded lookback (max_bars_back) to avoid runtime errors
✅Works on any asset, any timeframe
🏁🏁🏁Final Word🏁🏁🏁
This script is not just a visual tool, it’s a complete trend and structure framework. Whether you're looking for clean trend alignment, dynamic support/resistance, or early warning labels, this system is tuned to help you react with confidence — not hindsight.
Rembember, no single indicator should be used in isolation. For best results, combine it with price action analysis, higher-timeframe context, and complementary tools like trendlines, moving averages etc Use it as part of a well-rounded trading approach to confirm setups — not to define them alone.
💡💡💡Turn logic into clarity. Structure into trades. And uncertainty into confidence.💡💡💡

Dual Best MA Strategy AnalyzerDual Best MA Strategy Analyzer (Lookback Window)
What it does
This indicator scans a range of moving-average lengths and finds the single best MA for long crossovers and the single best MA for short crossunders over a fixed lookback window. It then plots those two “winner” MAs on your chart:
Best Long MA (green): The MA length that would have made the highest total profit using a simple “price crosses above MA → long; exit on cross back below” logic.
Best Short MA (red): The MA length that would have made the highest total profit using “price crosses below MA → short; exit on cross back above.”
You can switch between SMA and EMA, set the min/max length, choose a step size, and define the lookback window used for evaluation.
How it works (brief)
For each candidate MA length between Min MA Length and Max MA Length (stepping by Step Size), the script:
Builds the MA (SMA or EMA).
Simulates a naïve crossover strategy over the last Lookback Window candles:
Long model: enter on crossover, exit on crossunder.
Short model: enter on crossunder, exit on crossover.
Sums simple P&L in price units (no compounding, no fees/slippage).
Picks the best long and best short lengths by total P&L and plots those two MAs.
Note: Long and short are evaluated independently. The script plots MAs only; it doesn’t open positions.
Inputs
Min MA Length / Max MA Length – Bounds for MA search.
Step Size – Spacing between tested lengths (e.g., 10 tests 10, 20, 30…).
Use EMA instead of SMA – Toggle average type.
Lookback Window (candles) – Number of bars used to score each MA. Needs enough history to be meaningful.
What the plots mean
Best Long MA (green): If price crosses above this line (historically), that MA length produced the best long-side results over the lookback.
Best Short MA (red): If price crosses below this line (historically), that MA length produced the best short-side results.
These lines can change over time as new bars enter the lookback window. Think of them as adaptive “what worked best recently” guides, not fixed signals.
Practical tips
Timeframe matters: Run it on the timeframe you trade; the “best” length on 1h won’t match 1m or 1D.
Step size trade-off: Smaller steps = more precision but heavier compute. Larger steps = faster scans, coarser choices.
Use with confirmation: Combine with structure, volume, or volatility filters. This is a single-factor tester.
Normalization: P&L is in raw price units. For cross-symbol comparison, consider using one symbol at a time (or adapt the script to percent P&L).
Limitations & assumptions
No fees, funding, slippage, or position sizing.
Simple “in/out” on the next crossover; no stops/targets/filters.
Results rely on lookback choice and will repaint historically as the “best” length is re-selected with new data (the plot is adaptive, not forward-fixed).
The script tests up to ~101 candidates internally (bounded by your min/max/step).
Good uses
Quickly discover a recently effective MA length for trend following.
Compare SMA vs EMA performance on your market/timeframe.
Build a playbook: note which lengths tend to win in certain regimes (trending vs choppy).
Not included (by design)
Alerts, entries/exits, or a full strategy report. It’s an analyzer/overlay.
If you want alerts, you can add simple conditions like:
ta.crossover(close, plotLongMA) for potential long interest
ta.crossunder(close, plotShortMA) for potential short interest
Changelog / Notes
v1: Initial release. Array-based scanner, SMA/EMA toggle, adaptive long/short best MA plots, user-set lookback.
Disclaimer
This is educational tooling, not financial advice. Test thoroughly and use proper risk management.

Trend ChannelThis Trend Channel is designed to simplify how traders view trends, while also keeping track of potential shifts in trends with signals. It is designed for traders that prefer less over more.
The indicator can be used for trend following, trend reversals and confirmation in combination with price or other indicators.
At the core is one EMA and a smoothed volatility based channel around it.
The purpose of the channel is to avoid false signals on trend reclaim or trend loss and instead identify trend deviations.
The indicator also incorporates long and short EMA cross-over signals to recognize possible shifts in trend without having to overlay multiple EMAs and keep the chart cleaner.
Additionally the indicator fires warnings for potential false signals on golden/death crosses with a letter "W" above/below the signal candle. Those warnings are based on the distance between price and the crossover. When the distance is above a certain threshold the indicator fires a warning that price might mean revert.
Traders can customize all inputs in the settings.

Extremum Range MA Crossover Strategy1. Principle of Work & Strategy Logic ⚙️📈
Main idea: The strategy tries to catch the moment of a breakout from a price consolidation range (flat) and the start of a new trend. It combines two key elements:
Moving Average (MA) 📉: Acts as a dynamic support/resistance level and trend filter.
Range Extremes (Range High/Low) 🔺🔻: Define the borders of the recent price channel or consolidation.
The strategy does not attempt to catch absolute tops and bottoms. Instead, it enters an already formed move after the breakout, expecting continuation.
Type: Trend-following, momentum-based.
Timeframes: Works on different TFs (H1, H4, D), but best suited for H4 and higher, where breakouts are more meaningful.
2. Justification of Indicators & Settings ⚙️
A. Moving Average (MA) 📊
Why used: Core of the strategy. It smooths price fluctuations and helps define the trend. The price (via extremes) must cross the MA → signals a potential trend shift or strengthening.
Parameters:
maLength = 20: Default length (≈ one trading month, 20-21 days). Good balance between sensitivity & smoothing.
Lower TF → reduce (10–14).
Higher TF → increase (50).
maSource: Defines price source (default = Close). Alternatives (HL2, HLC3) → smoother, less noisy MA.
maType: Default = EMA (Exponential MA).
Why EMA? Faster reaction to recent price changes vs SMA → useful for breakout strategies.
Other options:
SMA 🟦 – classic, slowest.
WMA 🟨 – weights recent data stronger.
HMA 🟩 – near-zero lag, but “nervous,” more false signals.
DEMA/TEMA 🟧 – even faster & more sensitive than EMA.
VWMA 🔊 – volume-weighted.
ZLEMA ⏱ – reduced lag.
👉 Choice = tradeoff between speed of reaction & false signals.
B. Range Extremes (Previous High/Low) 📏
Why used: Define borders of recent trading range.
prevHigh = local resistance.
prevLow = local support.
Break of these levels on close = trigger.
Parameters:
lookbackPeriod = 5: Searches for highest high / lowest low of last 5 candles. Very recent range.
Higher value (10–20) → wider, stronger ranges but rarer signals.
3. Entry & Exit Rules 🎯
Long signals (BUY) 🟢📈
Condition (longCondition): Previous Low crosses MA from below upwards.
→ Price bounced from the bottom & strong enough to push range border above MA.
Execution: Auto-close short (if any) → open long.
Short signals (SELL) 🔴📉
Condition (shortCondition): Previous High crosses MA from above downwards.
→ Price rejected from the top, upper border failed above MA.
Execution: Auto-close long (if any) → open short.
Exit conditions 🚪
Exit Long (exitLongCondition): Close below prevLow.
→ Uptrend likely ended, range shifts down.
Exit Short (exitShortCondition): Close above prevHigh.
→ Downtrend likely ended, range shifts up.
⚠️ Important: Exit = only on candle close beyond extremes (not just wick).
4. Trading Settings ⚒️
overlay = true → indicators shown on chart.
initial_capital = 10000 💵.
default_qty_type = strategy.cash, default_qty_value = 100 → trades fixed $100 per order (not lots). Can switch to % of equity.
commission_type = strategy.commission.percent, commission_value = 0.1 → default broker fee = 0.1%. Adjust for your broker!
slippage = 3 → slippage = 3 ticks. Adjust to asset liquidity.
currency = USD.
margin_long = 100, margin_short = 100 → no leverage (100% margin).
5. Visualization on Chart 📊
The strategy draws 3 lines:
🔵 MA line (thickness 2).
🔴 Previous High (last N candles).
🟢 Previous Low (last N candles).
Also: entry/exit arrows & equity curve shown in backtest.
Disclaimer ⚠️📌
Risk Warning: This description & code are for educational purposes only. Not financial advice. Trading (Forex, Stocks, Crypto) carries high risk and may lead to full capital loss. You trade at your own risk.
Testing: Always backtest & demo test first. Past results ≠ future profits.
Responsibility: Author of this strategy & description is not responsible for your trading decisions or losses.
