dmn's ICT AMD-Goldbach█ OVERVIEW
This script is built on ICT time & price theory and the theory of algorithmic market maker models, and visualizes the intraday divided using powers of three into accumulation, manipulation and distribution cycles.
It also includes an automatically calculated and plotted Goldbach level (a.k.a. IPDA level or Huddleston level) overlay, to help visualize where in the current market maker profile price is in relation to the AMD cycles, and where it might trade to.
█ CONCEPTS
Accumulation, Manipulation, Distribution Cycles
A 24 hour day, with the default set to start at 20:00 CET (the start of the Forex CLS Settlement operational timeline) is split in three parts - 9, 6 and 9 hours for the three cycles (roughly corresponding with Asia, London Open and New York + London Close sessions).
Since charts are fractals, there's also intra-cycle time fibs available in the script, to highlight the smaller fractal equivalents in each cycle.
These cycles are used to visualize the three phases (AMD) for easier identification of the current daily profile by analyzing during what cycle highs and lows of the day are made.
An example of a bullish day could be price rallying before making a low during the accumulation cycle, being manipulated higher and retracing to form an optimal trade entry during the manipulation cycle, expanding and creating the high of the day before selling off during the distribution cycle, with a potential reversal before it ends.
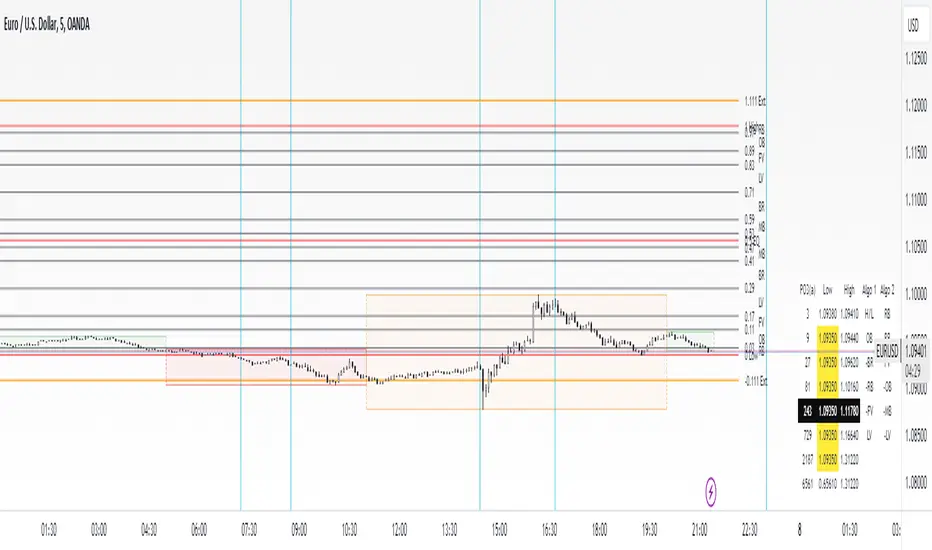
Goldbach levels
The Goldbach levels are based on the size of a price range (or price swing, if you will) expressed as a factor of power of three (3^n).
To decide what number to tell the script to use for the calculation, we look at what 3^n number best fits an average swing on the preferred timeframe we're trading.
For example; PO3 27 (3^3)might be fit for scalping, while PO3 243 (3^5) may correspond to the daily or weekly range, depending on the asset.
The script then calculates a range high and a range low using a power of three formula based on the current price and divides it into levels using Goldbach numbers.
At these levels one might expect to see price form various "blocks" as defined in concept by Michael J. Huddleston.
The blocks that correspond to the Goldbach levels are labeled with abbreviations as follows:
Ext = External range
Low = Range low
High = Range high
FVG = Fair value gap
RB = Rejection block
OB = Order block
LV = Liquidity void
BR = Breaker
MB = Mitigation block
Using these levels and said blocks we identify where in the current running market maker profile price is offered, and trade the preferred timeframe in line with the AMD cycles accordingly.
█ FEATURES
Custom AMD time cycles session times.
Custom time fib for fractal cycles.
Color and style customization.
Show only current or also historical cycles.
Equilibrium mode for Goldbach levels (show only high/low and midpoint)
Autodetection of asset type, with manual override.
█ NOTE
The default timings for the AMD cycles are set up for Forex pairs. For other asset types, such as indices, other timings are nessecary for optimal results.
Goldbach levels requires the correct symbol type setting for the calculation to work properly. Disable the script's autodetection and enable/disable the Forex option according to the type of chart if it fails.
DMN
dmn's ICT ToolkitThis is my quality of life indicator for forex trading using the methods and concepts of ICT.
The idea is to automate marking up important price levels and times of the day instead of doing it manually every day.
Killzones
Marks the most volatile times of the day on the chart, during which the intraday high/low usually takes place.
Particularly impactful when there's news released during these times.
London Open (02:00-05:00 EST)
New York Open (08:30-11:00 EST)
London Close (10:00-11:30 EST)
True Day delineation
Vertical line at the start of the "true day" (00:00 EST), start of the algorithmic trading day and aids in visualizing the intraday direction.
New York midnight price level
Noteworthy price level at the start of the "true day".
This price level is referenced by the interbank trading algorithms during the day. Buy below it on bullish days, sell above it on bearish days.
Daily open price level
Reference level for optimal trade entries. Buy below it on bullish days, sell above it on bearish days.
Central Banks Dealers Range (CBDR) (14:00-20:00 EST) &
Central Banks Dealers Flout (CBDF) (15:00-24:00 EST) &
Asian Range (AR) (20:00-24:00 EST)
The standard deviation lines available are used to make predictions for short-term future highs/lows when the CBDR and AR are smaller than 40 pips.
Trade them by looking for 5/15min key levels that converge with the projection levels.
X days Average Daily Range (ADR)
Default to 5 days back, gives an idea of how much movement to expect intraday when the ADR high/low is converging with CBDR/CBDF/AR standard deviations.
Current Daily Range (CDR)
Used for comparison against the ADR to help determine if there's enough intraday range left to enter a trade.
Dynamically changes color based on percentage of the ADR. Green below 50% of ADR, orange between 50 and 100%, red when CDR exceeds ADR.
All of the above are used in conjunction with each other and higher timeframe levels of importance to find entries and target.
Note: Preferably use New York's time zone for your charts.
