ADX DMI 3x - Dingue- ADX DMI DINGUE -
Français (bottom) / English
The best baddest - The Ultimate ADX DMI indicator for you to use.
Good to clearly see who's in control. Bear Bull
Includes :
- 3x ADX
- 3x DMI
- 3 line system which uses DMI calculation and put it in a single line instead of positive / negative.
Manual or Auto settings which adjusts length based on time frame used on screen.
Color coded for clear direction.
Squeeze shows when both sides are close together and this is when the trend might change or keep going.
Suggestions are welcome, ask below for any questions.
Try my other "DINGUE" indicators.
Thanks.
----------------- Français -----------------
Le meilleur, le plus génial - L'ultime indicateur ADX DMI pour votre utilisation
Très bon pour voir qui est en contrôle.
Inclu :
- 3x ADX
- 3x DMI
- 3 lignes qui remplace les lignes positives négatives du DMI pour une visualisation plus simple.
Paramétrage manuel ou automatique qui ajuste les valeurs selon la grandeur de chandelles utilisée à l'écran.
Codé avec des couleurs pour une visibilités de la direction claire.
Squeeze qui montre quand les 2 côtés sont près l'un de l'autre et quand un changement de contrôle ou une continuation de la tendance se produit.
Suggestions appréciées, pour toutes questions, écrire dans les commentaires plus bas.
Essayez les autres indicateurs "DINGUE".
Merci.
DMI
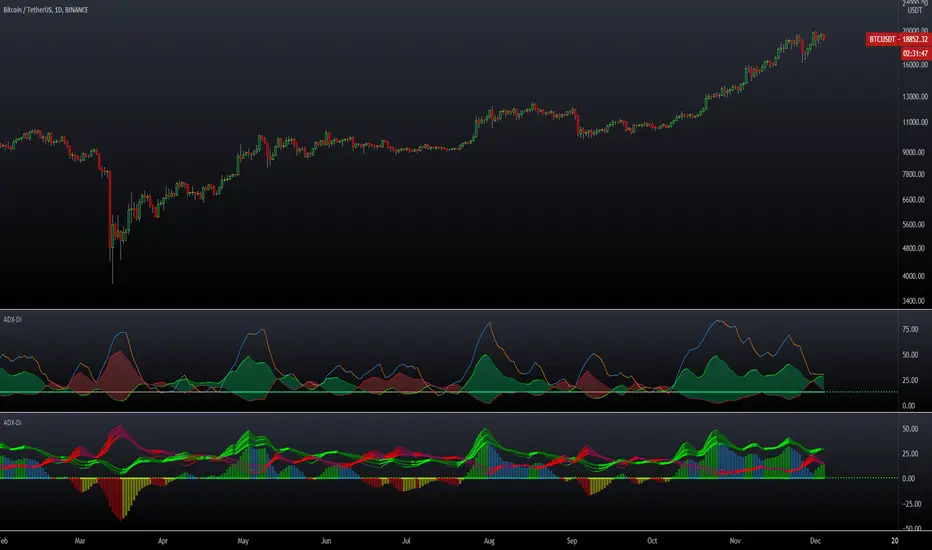
DMI-ADX HistogramThe Average Direction Index (ADX) coupled with the Direction Movement Index (DMI), developed by J. Welles Wilder, is a popular indicator that measures trend direction and strength.
The AX line (blue) is used to show the strength of the current trend. It does not tell you the trend direction. The under laid histogram shows relative movements of the price with green showing positive momentum and red showing negative momentum. Use these ADX and DMI together to find trend strength and direction.
- ADX line below 20 indicates that the underlying is in accumulation/distribution.
- ADX line above 20 mean that the underlying is trending with over 60 being very strong.
*When the ADX line is below 20 it is likely to see many reversal signals on the DMI Histogram. It is best to use the DMI signals when the ADX line is above 20 or higher. This is also a good level to play around with.
Motivation
Normally the direction movements are plotted as lines with the DI+ being green and the DI- being red. When the DI+ (green) crosses over DI- (red) this may indicate a buy signal, and vice versa. I found this visual representation made it difficult to see signals as well as lacked the ability to easy see the relative strength of other moves.
I have also noticed that the histogram values will periodically cross the ADX line, but not for very long periods. This could be a useful signal to explore further in the future.
In this image the top indicator is using the normal DI+/- lines, where the bottom indicator is using an absolute histogram.

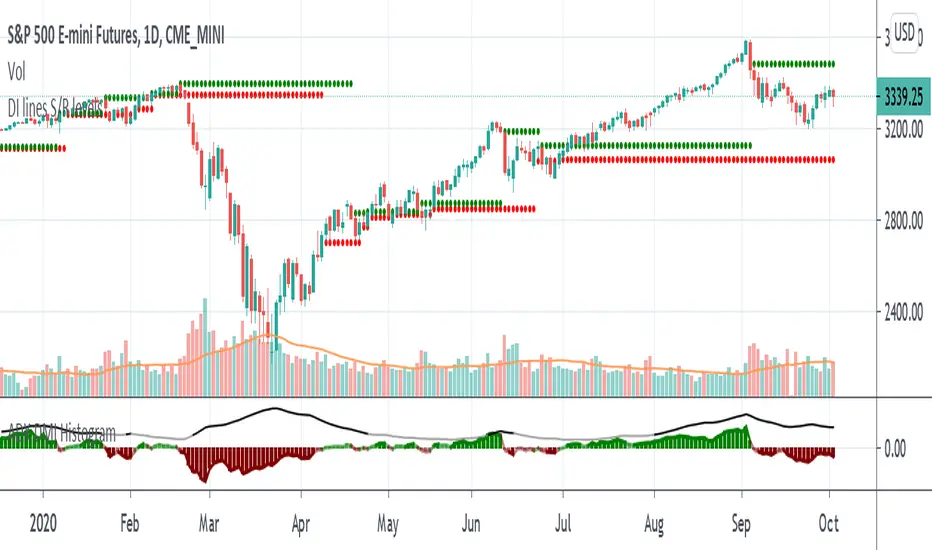
Support and Resistance levels - DMI - DI trailing stop linesThis can be used to compliment the Directional Movement Index if used as a standalone trading system. In addition to using the ADX and DI lines, a trailing stop can be used when the DI lines cross. If the plus line is above to show a buy signal, then the low of the price of when which the cross took place is used as a trailing stop. If the minus line is above to show a sell signal, then the high of the price of when which the cross took place is used as a trailing stop. This helps cut losses sooner whenever the price would end up going through these trailing stops or support/resistance levels yet the DMI system would show an upward or downward move.
[blackcat] L1 Composite RSI-DMI Reversal IndicatorLevel: 1
Background
The Relative Strength Index (RSI) developed by J. Welles Wilder is a pulse oscillator that measures the speed and change of price movements. The RSI hovers between zero and 100. Traditionally, the RSI is considered overbought when it is above 70 and oversold when below 30. Signals can be generated by looking for divergences and error fluctuations. RSI can also be used to identify the general trend.
The Directional Movement Index (DMI) is an indicator developed by J. Welles Wilder in 1978 that indicates the direction in which the price of an asset is moving. The indicator compares previous highs and lows and draws two lines: a positive directional movement line (+ DI) and a negative directional movement line (-DI). An optional third line called Directional Movement (DX) shows the difference between the lines. When + DI is above -DI there is more upward pressure than downward pressure in price. When -DI is above + DI, the price continues to fall. This indicator can help traders estimate the direction of the trend. Crossovers between the lines are also sometimes used as trading signals to buy or sell.
Function
L1 Composite RSI-DMI Reversal Indicator combines J. Welles Wilder's RSI and DMI indicators together to identify trend reversals.
Key Signal
swinglow --> swing signal
trend --> trend signal to identify top reversal
Pros and Cons
Pros:
1. it exhibit leading character
2. it can disclose top and bottom reversals
Cons:
1. noise exists
2. depends on market and trading pairs
Remarks
Composite J. Welles Wilder indicator
Readme
In real life, I am a prolific inventor. I have successfully applied for more than 60 international and regional patents in the past 12 years. But in the past two years or so, I have tried to transfer my creativity to the development of trading strategies. Tradingview is the ideal platform for me. I am selecting and contributing some of the hundreds of scripts to publish in Tradingview community. Welcome everyone to interact with me to discuss these interesting pine scripts.
The scripts posted are categorized into 5 levels according to my efforts or manhours put into these works.
Level 1 : interesting script snippets or distinctive improvement from classic indicators or strategy. Level 1 scripts can usually appear in more complex indicators as a function module or element.
Level 2 : composite indicator/strategy. By selecting or combining several independent or dependent functions or sub indicators in proper way, the composite script exhibits a resonance phenomenon which can filter out noise or fake trading signal to enhance trading confidence level.
Level 3 : comprehensive indicator/strategy. They are simple trading systems based on my strategies. They are commonly containing several or all of entry signal, close signal, stop loss, take profit, re-entry, risk management, and position sizing techniques. Even some interesting fundamental and mass psychological aspects are incorporated.
Level 4 : script snippets or functions that do not disclose source code. Interesting element that can reveal market laws and work as raw material for indicators and strategies. If you find Level 1~2 scripts are helpful, Level 4 is a private version that took me far more efforts to develop.
Level 5 : indicator/strategy that do not disclose source code. private version of Level 3 script with my accumulated script processing skills or a large number of custom functions. I had a private function library built in past two years. Level 5 scripts use many of them to achieve private trading strategy.

ADX + DI x Upgraded to Pine v4 x KingThiesAverage Directional Movement Index
Momentum based tool to measure trend strength on scale of 1-100
Similar to the aroon but incorporates a 3rd measure, while aroon uses two
The majority of these calculations were pre-existing in older pine scripts but have since been updated
signals are given when -DI and +DI cross, ADX illustrates corresponding strength at time of cross
Full Intro
ADX can help investors to identify trend strengths, as di - di determines the trend direction, while d - d is an impulse indicator. If the ADX is below 20, it can be considered impulsive, while it is above 25 on a trend line.
A trading signal can be generated when the di - DI line is switched to d - d and vice versa. If the di-line crosses and the ADX is above 20 (ideally 25), a potential buy signal could ebb away.
If the ADX is above 20, there is the possibility of potential short selling if the DI crosses over DI. You can also use crosses to get out of the current deal if you need it for a long time.
If the di-line is crossed and the Adx is below 20 (or 25), there may be opportunities to enter the potential for short trading, but only if di are above or below DI or if the price is trendy and may not prove to be the ideal time to start trading.
Up/Down Trend MarkerA simple indicator of trend by using 3 EMAs of multiplies of 2, 5 and 10, filtered by standard positive/negative directional movements (DM) which are the base of Average Directional Index (ADX).
The "Trend Strength" option is included to set the EMA multipliers and also the variation between DM+ and DM- which interpret the trend as a weak or a strong one.
Note that the markers only point to almost the beginning of the trends and just change the direction when the opposite trend is detected.
Feel free to send me your opinions.

indicatorenindicatoren is one non-overlaying indicator with multiple oscillators combined.
indicatoren provides the following functions:
- RSI (Relative Strength Index)
- Stochastics (representation of mathematically calculated momentum)
- Configurable MAcd (Moving Average Convergence Divergence) visually compressed to 0-100 range
- DMI & ADX (Directional Movement Index & Average Directional indeX) with visual lowering option
- Bollinger Bands direction
- COMBI Average
- Hourly, 4Hourly, Daily and Weekly time-indications
The length and appearance for each element can be adjusted. The MAcd has several modes and the brightness
of its elements can be adjusted with one single control.
The COMBI Average consists of a weighted average of the RSI, Stochastics, MAcd, DMI and the BB Direction.
It has its own definable length. Depending on the timeframe used, a visual indication of Hours, 4 Hours,
Days and Weeks might prove handy, especially on shorter timeframes.
Displaying this number of oscillators all at once may look like a carnival, therefore, each function can easily
be switched on or off. indicatoren can be used as just an advanced MAcd for example, or have it show the
combination of functions suiting you the most.
In order to combine a MAcd (+/- infinite scale) with Stochastics or RSI (0-100 scale), the MAcd is being visually
compressed and a Visual Multiplier parameter is provided to make it fit under any circumstances on any timeframe.
The DMI +/- and ADX scale are divided by 2.5 by default. Having the DMI’s on the lower portion of the indicator
does still provide decent info at a glance while it is not in the way of the other oscillators.
Books have been written and many articles and videos have been made about the meaning and possible applications
of these oscillators in trading.
The unique combination of these oscillators within indicatoren , together with the simple, yet useful,
visual options, make it to quite a versatile indicator on every timeframe on any chart.
GuidoN - November 2019, July 2020

[WJ] - ADX v2 [DMI, Alerts, Histogram, Customizable]A handy all-in-one package for DMI and ADX
Color-coordinated line for DMI with an EMA and histogram to gauge momentum, mark potential reversals, and quickly gather all the information you need to make your decisions.
Quick take-aways:
- Color of the ADX line indicates the current trend
- An ADX below the EMA indicates a potentially falling/reversing trend
- Customizable line w/ alerts for ADX crossovers
- Histogram to help catch potential reversals faster, and to gauge the momentum
Please let me know what you think, and in any features you think would increase the effectiveness of this amazing tool.

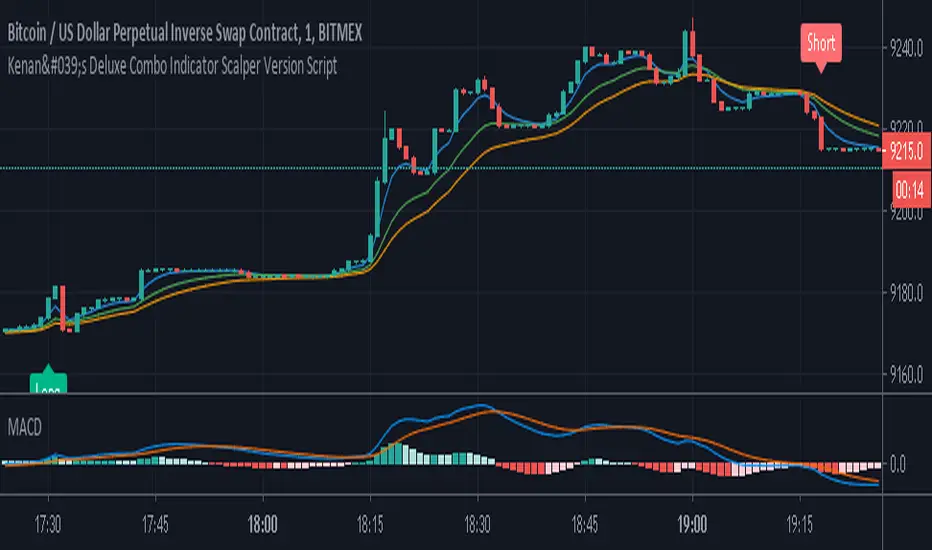
Kenan's Deluxe Combo Indicator Scalper Version ScriptThis is a combo strategy of sorts. I've been able to come up with this strategy after a lot of research.
Under Normal circumstances, when people look at dozens of indicators and they all signal, they open positions. So I decided to save people the trouble and put the major indicators together in a strategy.
All of the classic cross strategies usually give a lot of signal. Some of these signals are unnecessary and incorrect signals. Combining leading indicators. I tried to avoid the faulty signals.
Indicators and oscillators included in this strategy are:
1. Ema 5/13/21
2. Macd
3. Macd Dema
4. Ichimoku
5. Dmi
6. Stochastic
7. Aroon
8. Bollinger Band
9. Rsi
10. Chande Momentum Oscillator
11. Exponential Ease of Movement ( Eom )
12. Klinger Oscillator
13. Stochastic RSI
14. Ultimate Oscillator
15. Woodies CCI
16. Rate Of Change Lenght( Roc ) oscillator
17. WaveTrend Oscillator . It was created by @fskrypt.
18. Ehlers Adaptive CG Indicator . It was created by @LazyBear
19. Insync Index. It was created by @LazyBear
This script works by listening to the indicators and oscillators above. Opens new position after receiving signal verification signal from all
So how does this strategy close your position (optional).
1. You can close the position with the trailing stop option.
2. You can close the position according to the Rsi limits. To give an example. After a long position is opened, you can close the position after the rsi has risen above 70.
3. You can close the position according to the Bollinger Band . After a position is opened, you can close the position after the price moves out of the bollinger Band .
You can also change the values of indicators as desired. If you get better results. I would appreciate it if you could contact me via comment or private message.
I set the commission rate at 0.075 percent. If you want, you can change the settings yourself and make backtest.I changed the default settings for some indicators.
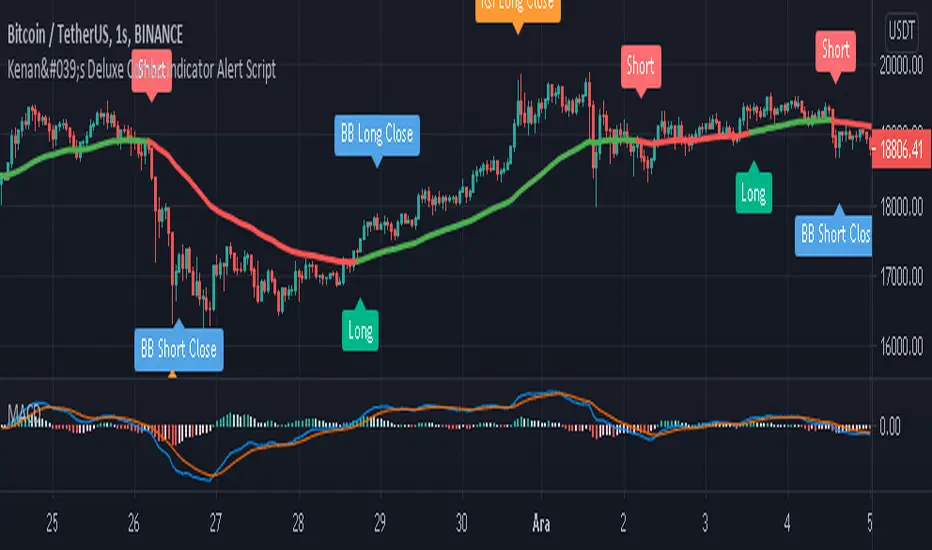
Kenan's Deluxe Combo Indicator Alert ScriptThis is a combo strategy of sorts. I've been able to come up with this strategy after a lot of research.
Under Normal circumstances, when people look at dozens of indicators and they all signal, they open positions. So I decided to save people the trouble and put the major indicators together in a strategy.
All of the classic cross strategies usually give a lot of signal. Some of these signals are unnecessary and incorrect signals. Combining leading indicators. I tried to avoid the faulty signals.
Indicators and oscillators included in this strategy are:
1. Ema 5/13/21
2. Macd
3. Macd Dema
4. Ichimoku
5. Dmi
6. Stochastic
7. Aroon
8. Bollinger Band
9. Rsi
10. Chande Momentum Oscillator
11. Exponential Ease of Movement ( Eom )
12. Klinger Oscillator
13. Stochastic RSI
14. Ultimate Oscillator
15. Woodies CCI
16. Rate Of Change Lenght( Roc ) oscillator
17. WaveTrend Oscillator . It was created by @fskrypt.
18. Ehlers Adaptive CG Indicator . It was created by @LazyBear
19. Insync Index. It was created by @LazyBear
This script works by listening to the indicators and oscillators above. Opens new position after receiving signal verification signal from all
So how does this strategy close your position (optional).
1. You can close the position with the trailing stop option.
2. You can close the position according to the Rsi limits. To give an example. After a long position is opened, you can close the position after the rsi has risen above 70.
3. You can close the position according to the Bollinger Band . After a position is opened, you can close the position after the price moves out of the bollinger Band .
You can also change the values of indicators as desired. If you get better results. I would appreciate it if you could contact me via comment or private message.
I set the commission rate at 0.075 percent. If you want, you can change the settings yourself and make backtest.I changed the default settings for some indicators.
Directional Movement IndexThis is a standard ADX DMI indicator with Background colour and the option to draw the Background colour of the next higher timeframe.

Directional Movement Oscillator (DMI)The DMI Oscillator is a technical indicator which uses values of DMI in order to predict miscellaneous sides of market behavior.
Two components of DMI are used in calculation: DI+ and DI-; the DMI oscillator calculates the difference between these components and represents it as both a line and a histogram.
According to the rules described by Barbara Star in her article "The DMI Stochastic", the following market conditions can be predicted:
When the oscillator is positive and decreasing, a consolidation or pullback might take place. When price is in uptrend and the oscillator is positive but makes lower highs, a bearish divergence might be identified.
Conversely, when price is in downtrend and the oscillator is negative but keeps moving up, a bullish divergence might take place.
Trend continuation might be identified when the oscillator moves to the zero line and then rebounds from it.
In quiet markets, oscillator values fluctuating near the zero line (approx. -10 to +10 range) might signify sideways or rangebound price action.

LIZ ADX+DMIThe thick lines represent ADX .
When the volatility increases, it faces up and the color changes from gray to green.
When the background is gray and starts to turn green from below the horizontal line of reference value of 20, the volatility increases, indicating that the environment is becoming easier to trade.
When ADX rises and then peaks out, the line goes down and the previously green line changes to gray.
This means that the trend that was going on before is now over.People who hold positions use them to sign off their hands.
Also, those who want to see the trend change and build a new position with a backstop can use it to sign their entries.
When the background is gray (due to the deterioration of ADX ), it indicates that the volatility is low, there is no value width, and the direction is unclear, so it's not a good time to trade.
The two thin lines, red and blue, are DMI.A red line at the top and a blue line at the bottom indicates that the buying power is dominant, and the gap between the two lines is painted red.
On the other hand, if the blue line is up and the red line is down, it shows that the selling power is superior and it is painted blue.
When the two ADX lines intersect, and the color between the lines is changing from red to blue or blue to red, it indicates that the buyer's advantage has changed.
You can look at when the line crosses, and then enter in the new direction of dominance and build a position.
You can also determine that your position is in line with the market flow if it is in line with your current predominance.
However, in the opposite case, it suggests that the position you have is not in the right direction.
When two DMI lines are crossed frequently, it indicates a range or random rate.
In such cases, the background is often gray, indicating that it is difficult to make a profit in trade.
If you are interested in the invitation-only indicator, please contact us on private chat.
太い線はADXを表してます。
ボラティリティーが上昇すると上を向き、色がグレーから緑に変化します。
背景がグレーの期間で、水平線で示す基準値20より低い位置から上を向き緑に変化し始める時、ボラティリティーが上昇し、トレードしやすい環境になりつつある事を示唆しています。
ADXが上昇し、やがてピークアウトするとラインが下を向き、それまで緑だったラインの色がグレーに変わります。これは、それまで続いていたトレンドが一旦終了した事を意味します。
ポジションを持っていた人は、手仕舞いのサインに使います。
また、トレンドの転換を確認し、逆張りで新規ポジションの構築を狙っている人はエントリーのサインに使えます。
ADXが低下しているせいで,背景がグレーになっている時は,ボラティリティーが低下しており、値幅がなく、方向性がはっきりしないという理由で取引に向いていない時期である事を示します。
赤、青2本の細いラインはDMIです。赤いラインが上、青いラインが下の時は買い勢力が優勢である事を示し、2本の線の間が赤に塗られます。
反対に青いラインが上、赤いラインが下の時は売り勢力が優勢である事を示し、青に塗られます。
2本のADXラインが交差し、線の間に塗られた色が、
赤から青、または青から赤に変化する時、買い方売り方の優劣が入れ替わった事を示唆します。
ラインがクロスするタイミングを見て、新しく優勢になった方向にエントリーし、ポジションを構築できます。
また、自分が既に持っているポジションが、現在優勢である方向と一致している時はマーケットの流れに合っていると判断できます。
しかし反対の時は、あなたが持っているポジションの方向が合っていない事を示唆しています。
2本のDMIラインが頻繁にクロスしている時は、レンジ相場やランダム相場である事を示唆します。
そのような時は背景もグレーになっている時が多く、トレードで利益を出すのが難しい環境である事を表しています。
招待専用インジに興味ある方はプライベートチャットに連絡をください。

Bullish and Bearish Engulfing and RSI, DMI and PSAR confirmationThe study combines Bearish and Bullish Engulfing pivot strategy with strong trend confirmative indicators:
Directional Movement Index (DMI)
Parabolic SAR
RSI Bands
Engulfing patterns in market provide a useful way for traders to enter the market in anticipation of a possible reversal in the trend. Engulfing candles tend to signal a reversal of the current trend in the market. This specific pattern involves two candles with the latter candle "engulfing" the entire body of the candle before it. The engulfing candle can be bullish or bearish depending on where it forms in relation to the existing trend
The indicator can be applied to trading pairs with USD, USDT, ETH and BTC quote currencies. Indicator supports spot, futures and marginal trading exchanges. It calculates and compares values of the price action candles to define is there an engulfing and what type it is: bullish or bearish:
If there is a bullish engulfing the indicator fills price action candle with yellow color
If there is a bearish engulfing the indicator fills price action candle with purple color
Advantages of this indicator:
1. This indicator reveals presence of both types of engulfing simultaneously
2. Weak engulfment signals and market noises are filtered by RSI bands, DMI and PSAR confirmations. This allows to receive only strong and confirmed engulfments
3. This indicator includes both
Study with built-in custom alerts to use with your own software through web hook connection.
Strategy with configurable risk management settings (order size, commission, take profit, stop loss and trailing). This provides you opportunity of direct broker connection and allows to conduct backtests before applying the strategy to real account
At the chart you can see the historical price action of XBTUSD at BitMEX exchange from 9th of May 2020 till 17th of May 2020 indicator. Moments when the indicator triggered to enter a position are described with message clouds. Moments when a certain position should be closed are highlighted with circles and commented with clouds
How to use?
Long signals:
1. Apply indicator to the trading pair your are interested in
2. Once bullish engulfing conditions are met price action candle will be colored yellow.
3. Once price action breaks RSI resistance band, retraces and closes below the band the signal is finished and the position should be closed
Short signals:
1. Apply indicator to the trading pair your are interested in
2. Once bearish engulfing conditions are met price action candle will be colored purple.
3. Once price action breaks RSI support band, retraces and closes above the band the signal is finished and the position should be closed
Automatic strategy:
When conditions of long or short position from the strategy are met the script opens position.
Strategy.exit closes the position once risk management settings are met.
Strategy.close closes the position once RSI band rejection is confirmed
If you want to obtain access to the indicator please send us a personal message
Best regards,
SkyRock Signals team

unRekt - KISS AddieKISS Addie is the ADX and DI+- indicator and is part of the 'keeping it simple' series. ADX is your Average Directional Index and DI is you Directional Movement Indicator.
ADX - Will show the strength of the trend regardless of direction.
00 - 10 : No trend
10 - 20 : Transitioning trend
20 - 40 : Trending
40 - 99 : Exhausted (Can also be considered a stronger trend the higher it goes, but look to exit position once it begins to downward slope and pay attention to DI spread)
DI - Will show the direction of movement. This indicator includes two views of the DI. the DI+ and DI- crossover and a histogram of the spread between the two.
Bullish : Green crosses over red.
Bearish : Red crosses over green.

Directional Movement Index TrendThis DMI I modified to see the trend more clearly, and the ADX line changes according to the trend force, which is perfectly configurable, the configuration I left my default configuration, in case you want to modify it because you see the trend in different values, feel free, and basically the columns are the average of DI and also indicate the trend more clearly.
/////////////////////////////////////////////////////////////////////////////////////////////////////////////////////////////////////////////////////////////////////////////////////
Esse DMI eu modifiquei para ver a tendência com maior clareza, e a linha do ADX ela muda de acordo com a força de tendência, a qual é perfeitamente configurável, a configuração eu deixei a minha configuração padrão, caso você queira modificar porque você vê a tendência em valores diferentes, sinta-se livre, e basicamente as colunas são a média de DI e indicam também com mais clareza a tendência.

Wolfs ADX + DII have created an alternative visualisation of the ADX + DI indicator created by MasaNakamura, credits to them for providing the source code! :-)
The histogram represents the distance between the DI+ and the DI-. The crossing of the histogram is equal to the crossing of the DI lines.
The ADX line is coloured based on the threshold.
This creates a clean representation of the ADX + DI.

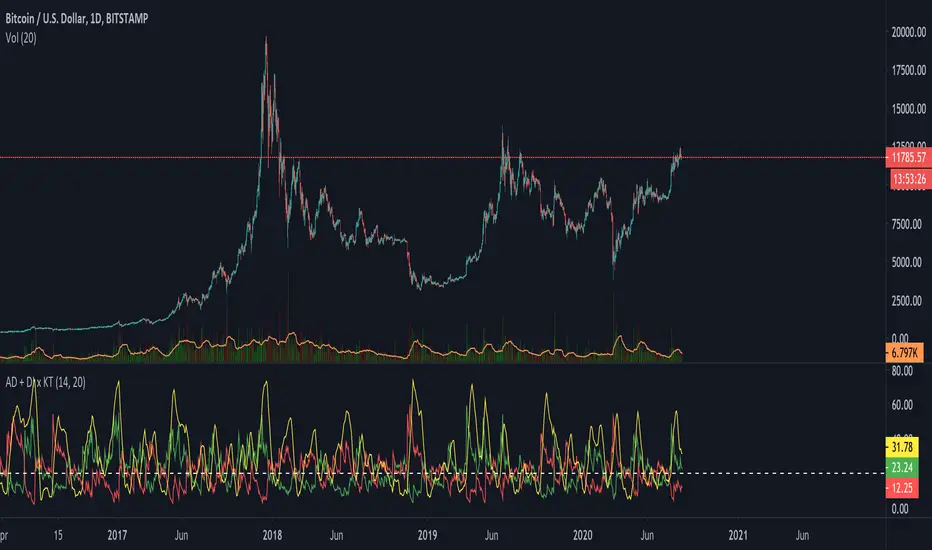
DMI + ADX + OBVThis trend following indicator is made up of 3 parts.
A normalized (OBV) On Balance Volume (the gray line) which ranges between -100 and 100 and has a 55 period SMA overlayed (the orange line) to give an indication of the overall trend as far as volume goes.
- If the volume decreases without a drop in price, it might indicate a move down.
- If volume increases without a rise rise in the price, it might indicate a move up.
The (DMI) Directional Movement Indicator which shows the strength of the bulls versus the bears.
- The red line measures how strongly price moves downwards.
- The green line measures how strongly price moves upwards.
One way to trade this is on crossovers e.g.when the green line crosses the red; although it's best to combine this with another indicator or pattern for confirmation.
Another useful feature of the DMI is the ability to see strength of buyers and sellers pressure at the same time, acting as a confirmation before entering a trade.
The third way to use the DMI is when price makes a new high but the green line does not. (Or the price makes a new low and the red line doesn't) This is known as divergence and should act as a warning to tighten your stops or take profits because it signals a possible change of direction.
The last part of the indicator is the (ADX) Average Directional Index
This is the blue line and shows the strength of the trend regardless of direction. This can act as a confirmation for the DMI or other indicators in your trading system.
When the blue line is:
- above the green shaded area there is an extreme trend.
- in the green shaded area there is a very strong trend.
- in the yellow shaded area there is a strong trend.
- below the yellow shaded area there is no trend.

Sqeeze Momentum, DMI and Parabolic SAR study with alertsThe study combines Sqeeze Momentum, Directional Movement Index (DMI) and Parabolic SAR indicators indicators providing you with a powerful indicator with long and short scalping strategies in it
When conditions of long or short position from all mentioned indicators are met script opens position. Once trend changes it closes position and fixes profit
Advantages:
1. Deal start alert condition includes the folowing filters and requirements:
- Momentum value is adjusted using a relative proportion of volume at each timeframe scale to exclude a chance of opening position at a low impulse stage
- Squeeze momentum trigger condition is automatically checked before a position is opened
- +DI , -DI and ADX values are taken into account to confirm the trend direction
- Position size is taken into account to ensure there will not be opened any excess deals or alerts
2. Exit deal alert condition was modified using Parabolic SAR indicator. Hence, it is ensured positions will not be closed in a middle of a trend
3. Study allows you to apply custom alerts to any position you would like thus you can connect your own trading panels with TradingView Webhooks
If you want to obtain access to the strategy please send us a personal message

Combo Strategy 123 Reversal & Dynamic Momentum Index This is combo strategies for get a cumulative signal.
First strategy
This System was created from the Book "How I Tripled My Money In The
Futures Market" by Ulf Jensen, Page 183. This is reverse type of strategies.
The strategy buys at market, if close price is higher than the previous close
during 2 days and the meaning of 9-days Stochastic Slow Oscillator is lower than 50.
The strategy sells at market, if close price is lower than the previous close price
during 2 days and the meaning of 9-days Stochastic Fast Oscillator is higher than 50.
Second strategy
This indicator plots Dynamic Momentum Index indicator. The Dynamic Momentum
Index (DMI) was developed by Tushar Chande and Stanley Kroll. The indicator
is covered in detail in their book The New Technical Trader.
The DMI is identical to Welles Wilder`s Relative Strength Index except the
number of periods is variable rather than fixed. The variability of the time
periods used in the DMI is controlled by the recent volatility of prices.
The more volatile the prices, the more sensitive the DMI is to price changes.
In other words, the DMI will use more time periods during quiet markets, and
less during active markets. The maximum time periods the DMI can reach is 30
and the minimum is 3. This calculation method is similar to the Variable
Moving Average, also developed by Tushar Chande.
The advantage of using a variable length time period when calculating the RSI
is that it overcomes the negative effects of smoothing, which often obscure short-term moves.
The volatility index used in controlling the time periods in the DMI is based
on a calculation using a five period standard deviation and a ten period average
of the standard deviation.
WARNING:
- For purpose educate only
- This script to change bars colors.

RedK_Directional Index / K xDMIHere's a modern take on the famous DMI/ADX. i first wrote this on another platform few years ago, so i'm happy to be able to share it on TradingView
quick refresher: what does DMI/ADX tell us:
------------------------------------------------------
in simple terms, at the core of this indicator, there are 3 main calculations / lines: the Plus Directional Index ( +DI ) which represents how much the bulls are able to push the high of a bar compared to previous one, the Minus Directional Index ( -DI ), showing how much the bears are able to push the low of a bar from previous one, then the Average Directional index ( ADX ) line, which creates an oscillator of the +DI and -DI to represent the strength of a trend -- usually the lines will be colored accordingly (bulls = green, bears = red, and any different color for the ADX )
Similar to my version of the RSI , we take a classic concept, then use the computing and visualization "super powers" available to us today, to extend and improve on what those masters created in the past. I guess they sort of expected us to do exactly that :)
this "extended" version of DMI/ADX provides couple of highly needed features (in my opinion) -- let's explore:
trying as much as possible to avoid jargon - pls forgive me if i failed in some places.
-------------------------------------------------------------------------------------------------
1 - the big change: the ability to visualize the ADX in a way that makes some more sense.
- the original calculation restricted the ADX to oscillate below zero - i'm sure they had a good reason to build it that way in the past - but to me, it becomes super hard to interpret what the ADX line means, especially when a negative trend (the bears) take over. by removing that restriction and allowing the ADX to oscillate up or down (and we're free to do that, so the indicator shows *us* what *we need* to see), we end up with an improved representation of the trend and the trend strength.
- also the original calculation applies a moving average (default 14 bars) of a moving average (another 14 of the Directional Indexes, which represent the strength of bulls vs bears) to calculate the ADX - that makes the ADX very "removed" from the base price values - i change that, and just smooth the initial +Di / -Di then calculate the ADX from there. again, this shows me the outcome of the (relatively) immediate moves.
2 - i use weighted average WMA () in all my averaging calculations .. i believe this type of average is the best to express the importance of recent days / bars vs the ones further in the past, compared to other averaging techniques
3 - ability to make the DMI volume-weighted .. but contrary to my RSI , this is not set by default.
4 - couple of options to view the unrestricted ADX (as an area or as histogram/columns .. which i call Vertical Bars) for improved visualization
other stuff:
5 - a "step" option for the ADX .. you can set the step option to an increment of, say 5 or 10. this is in case you prefer to see the trend more in "quality" terms - so the equivalent of weak, medium, strong, v. strong...etc -- since in reality, a number like 47.7683 doesn't really mean anything specific
6 - optional "strong trend" adjustable level
Settings & usage suggestion:
-----------------------------------
i prefer to use the defaults (length = 7, smoothing = 3, ..etc) -- i believe these are more suitable to the much faster trading that we have now. you can review the comparison chart and see if this works for you, and adjust as you need.
from a "signal" standpoint, you can use the xDMI as you use the classic DMI/ADX, bulls (or bears) are in control when the corresponding DI line crosses the other going up, *AND* moving above the "strong trend" level that you can set as an extra filter (usually a value between 20 to 30), while ADX will show the quality/strength of the trend.
i suggest you also utilize this indicator with other trend / momentum confirmation methods, and additional analysis and not in isolation - as well as inspecting the prevailing / longer time frame to ensure you're acting in the direction of the broader move / trend.
the above chart includes a side-by-side comparison between our new xDMI with the classic DMI/ADX using the same settings - then we add at the bottom panel also the xDMI, but with my default (faster) settings and showing other visualization options that can be utilized - the Moving Averages on the top / price panel is just to help put the price movement into perspective in terms of trend and trend strength.
The code is open and commented - please feel free to use, share, comment & provide feedback. if you're a DMI fan, and you find this useful in your trading, i would be more than happy to hear about it
Good luck!

BlueswimmerdoespineSharing to learn and to help others.
Any feedback on layout/structure/shortcuts will always be appreciated.
Simple indicator for close of candle above or below EMA with ROC and CO acting as a filter.

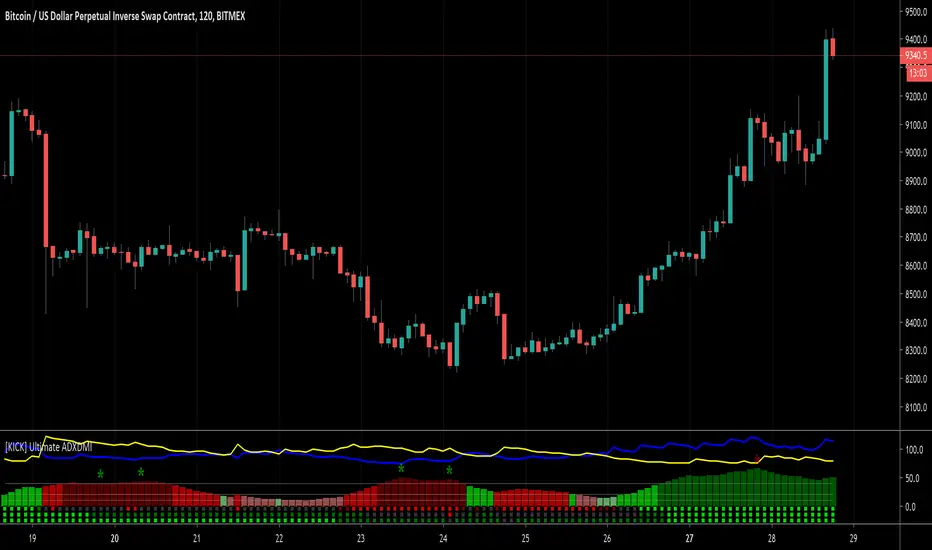
[KICK] Ultimate ADXDMIThis indicator is a version of the ADX and DMI indicators optimized for maximum information conveyance related to trending price action in a compact space.
Use the ADX barchart to determine strength of trend. There are various configurable thresholds for this measurement as well as peak marking within the exhaustion zone. The higher the values in the bar chart, the stronger the trend. Low values indicate non-trending or choppy price action.
Use the DMI line graphs (as well as the color codes on the ADX barchart) to determine trending direction. You can offset the DI+ and DI- lines so that they are not directly on top of the ADX chart. When the DI+ is on top (blue line by default) the trend is up and when the DI- line (yellow by default) is on top the trend is down. The colors of the ADX chart also indicate direction with red indicating down and green indicating up. The "pale" shades indicate a nacent/immature trend, "bright" shades indicate a solid trend, and the "darker" shades indicate a strong trend that is mature. Look for these mature trends to "top out" and have their peaks marked when the trend has exhausted itself (note that the peak indicators will repaint 1-2 candles in the past after the "high" is confirmed).
You can specify up to 3 additional timeframes to monitor in the dot map below the ADX chart that will give you a generalized idea of the trend on those larger timeframes. In these heat maps, the color red indicates a down trend and green an up trend. The brighter colors denote strong trends while the darker colors are weaker. Grey dots in the heat map indicate no strong trend present. Some users actually prefer to turn off the main ADX and DMI visualizations and only display the multi-timeframe heatmap as a way of checking higher timeframe trends before entering their trades.
Use the link below to watch a tutorial video, request a trial, or purchase for access.