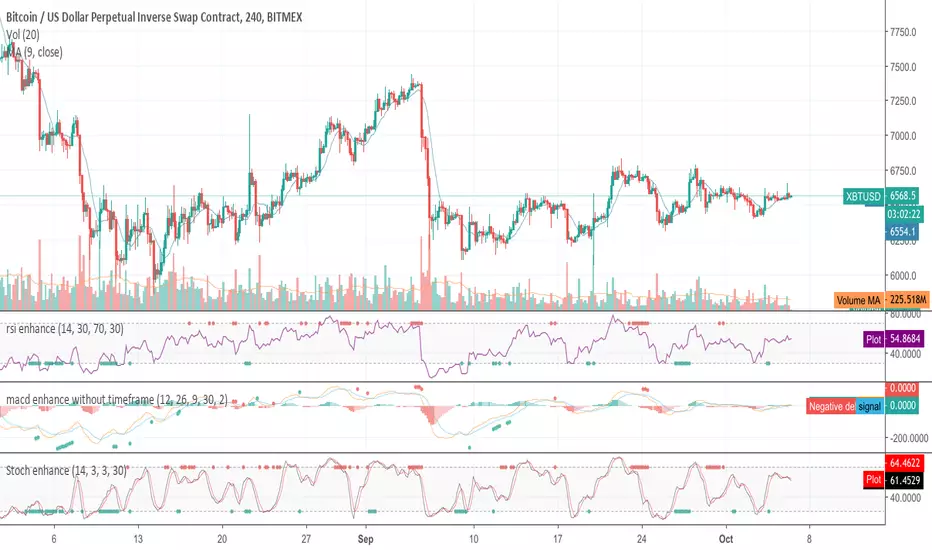
RSI with Highlights and DivergencesThis script is an RSI replacement, useful especially for Day traders (15m or less) but can be used as a normal RSI by changing the settings to 14 / 70 / 30
Features:
- RSI with adjusted settings for lower time frames
- highlight when RSI and price diverge when RSI is at extremes
- highlight of the Overbought and Oversold conditions
- 50% line
- candle colors for Overbought and Oversold conditions
Divergencia

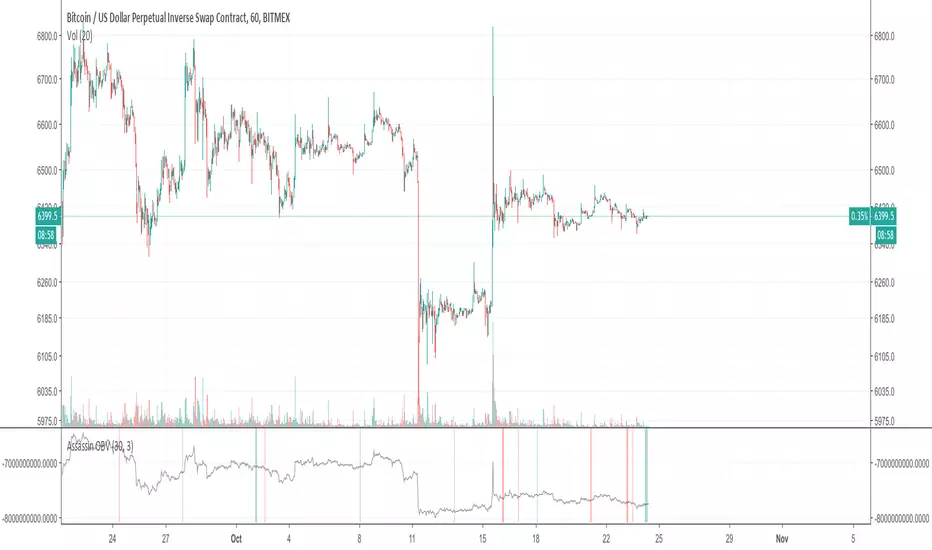
Assassin OBVAssassin OBV
add divergence judgement with price.
red means bull Divergence.
teal means bear Divergence.
[IE] Multiple price indicators + SCALPERDetect divergences in price and RSI + pivot points (with alert option). Credits to @Libertus for this, I only reproduced it and after that he pointed me to his work.
Has ChartVamp and EricChoe MAs with prediction.
Displays Support and Resistance areas
Detects momentum changes.
Custom scalper with alert option.

[IE] RSI - BEAR/BULL - DivergencesDetect divergences in price and RSI.
Also mark overbought and oversold RSI.
Useful for scalps.
Contact in private for access

RSI Divergence PRO - Baby WhaleThis RSI script will show you the following things:
When the RSI moves between the green lines (40 - 80++) we are in a Bull market.
If the RSI moves between the middle green and red line (40-60) we have some sideways action.
And yes, when the RSI is between the red lines (60 - 20--) we can say that we are in a Bear market.
The dashed lines in between are on every 10 points on the RSI .
All colors and lines are customisable.
The real MVP -1.38% of this scrip is the RSI Divergence spotter.
A little green or red triangle will show up on the chart when a RSI Divergence is formed.
The Divergence is only shown when it happens in overbought (70+) or oversold (30-) regions to avoid too many signals.
I highly recommend not to jump in on every signal you get, but also use multiple reasons, like Elliot Wave or fib levels, before entering a trade.
This Pro version is for paid subscribers of TradingView only.
It will give you the ability to create alert inside of TradingView.
If you want access, just send a message please.
Much love from Baby Whale!!
🙏❤️🐳

RSI Divergence - Baby WhaleThis RSI script will show you the following things:
When the RSI moves between the green lines (40 - 80++) we are in a Bull market.
If the RSI moves between the middle green and red line (40-60) we have some sideways action.
And yes, when the RSI is between the red lines (60 - 20--) we can say that we are in a Bear market.
The dashed lines in between are on every 10 points on the RSI.
All colors and lines are customisable.
The real MVP of this scrip is the RSI Divergence spotter.
A little green or red triangle will show up on the chart when a RSI Divergence is formed.
The Divergence is only shown when it happens in overbought (70+) or oversold (30-) regions to avoid too many signals.
I highly recommend not to jump in on every signal you get, but also use multiple reasons, like Elliot Wave or fib levels, before entering a trade.
If you want access, just send a message please.
Much love from Baby Whale!!
🙏❤️🐳

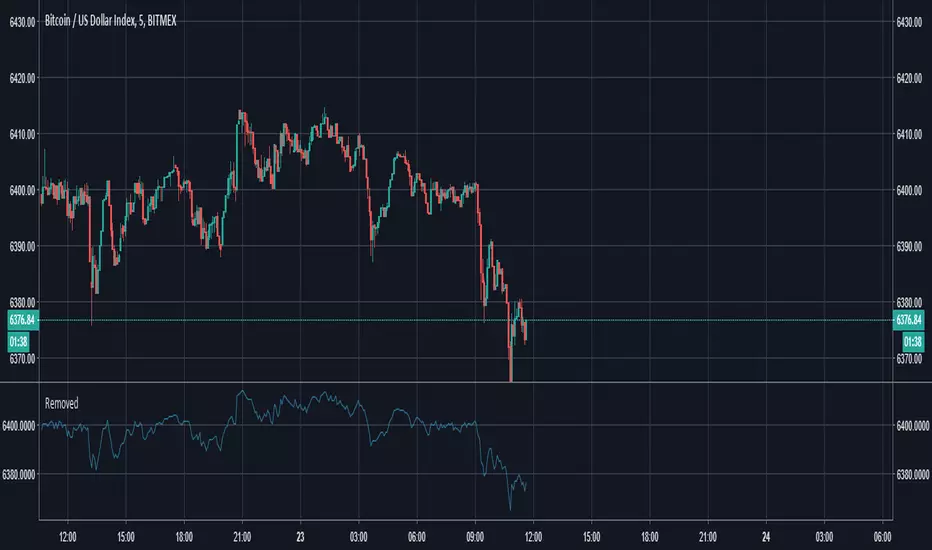
RSI Divergences - Candle Edition - LibertusHello all,
This is just upgrade upon my already released RSI divergences script. Divergences detection is exactly same, no difference.
I'm releasing this version because I got few requests for divergences indicator above price bars, so it doesn't take additional screen space.
New in this version is:
ability to remove pivots
ability to display smaller/shorter labels
predefined look back period for different time frames
Happy trading and good luck!
As always, I appreciate comments and likes!
If you find this useful and want to reward me:
BTC TIP JAR: 1i7nojAjxFuyFwvnZx6hbXBTLkWaUjZ8C
RSI Divergences with RSI in separate window:

RSI Divergence AlertRSI Divergence Alert
Input: range
Bullish RSI Divergence
yellow
Bearish RSI Divergence
red

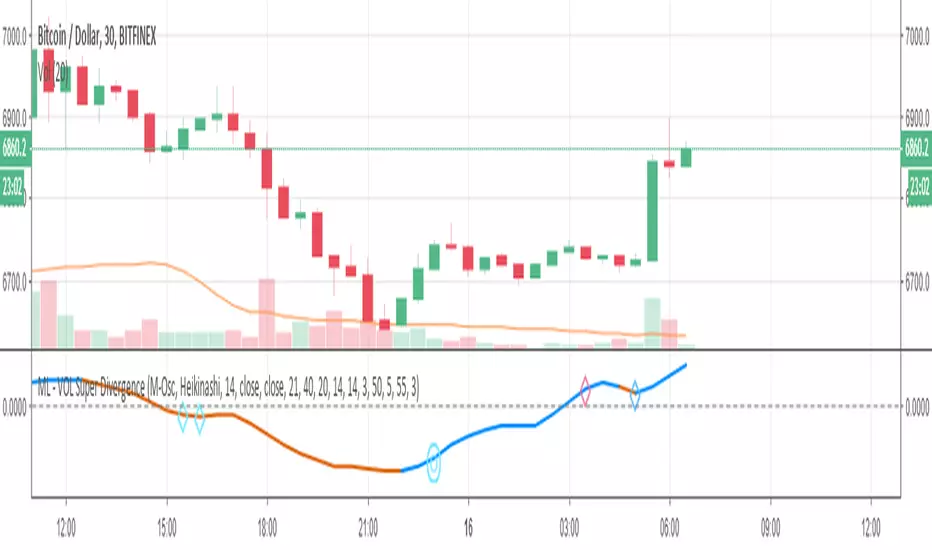
ML - VOLUME Super DivergenceThis script has been published for customer acceptance and verification. Sorry this mean access will only be provided to the customer.
For open source scripts, please take a look at the Backtest-Rookies profile. Users who are interested in custom development services can visit the Backtest-Rookies (.com) website.
VOLUME Super Divergence
A variant of .
All Osclillators have been swapped with Volume based Oscillators.

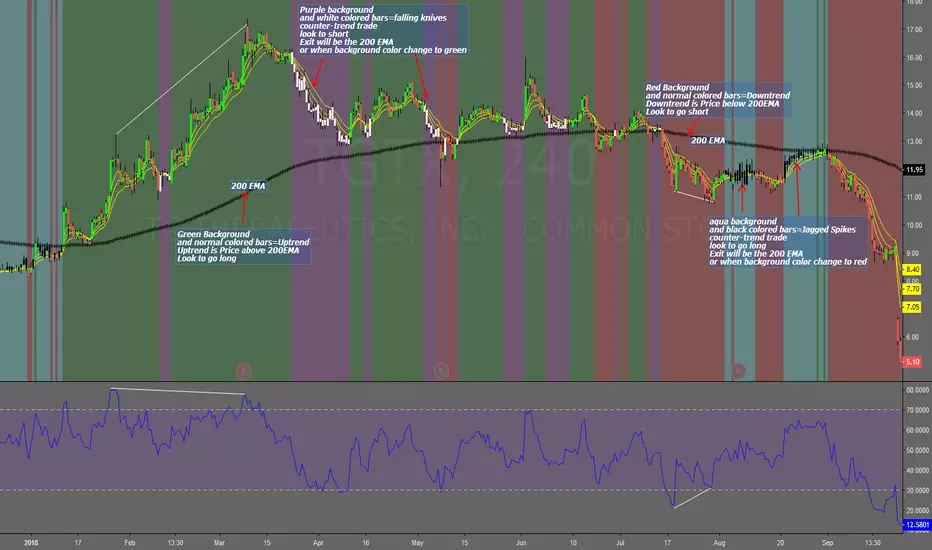
Falling Knives Jagged SpikesThe purpose of this script is to trade with the trend, trade trend continuation, and counter-trend trades.
Uptrend is price above 200 ema: Background is green and the bar colors are normal
Downtrend is price below 200 ema: Background is red and the bar colors are normal
Counter-trend to uptrend--Bar colors are white and the background is purple
counter-trend to downtrend--Bar colors are black and the background is aqua.
How to use:
Uptrend (green background): Only go long
Downtrend (red background): only go short
Counter-trend to uptrend/downtrend (white bars/black bars): Take counter-trend trade when price is a substantial distance from the 200 EMA. Best if there was a divergence with an oscillator. A lot of times these are just deep pullbacks or rallies.
trend continuation: In uptrend, after falling knives, and trend continues up (background turns to green) look to buy, you are getting a great price on the asset. Same for downtrend.
Keep in mind that nothing is perfect, and to of-course test everything.
Best of luck in all you do. Get money.

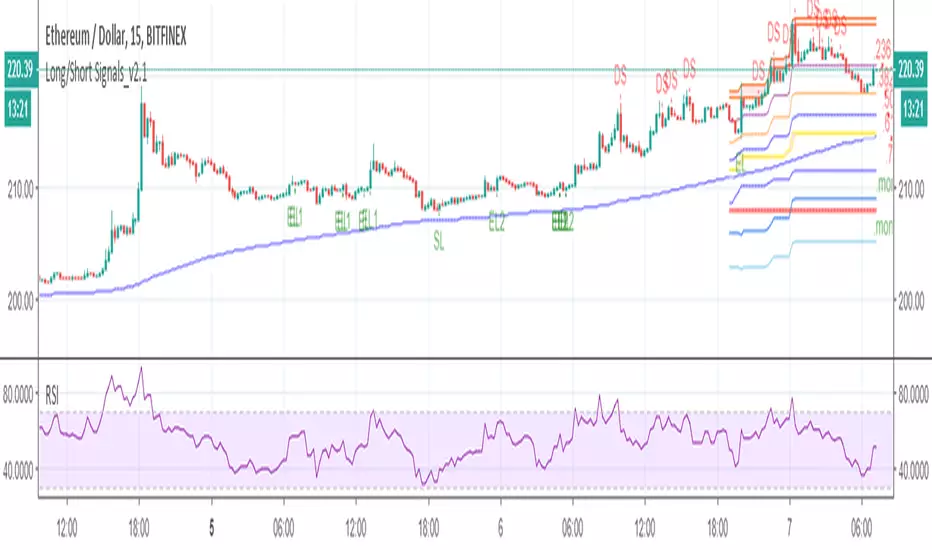
Long short signal scriptThis script uses divergence, MA crossover, hammer formations, MA resistance/support trading strategies to identify "potential" entries.


Short - RSI Divergence Locator Locates divergence during trades. Best used in 2 and 4 hour chart. Need to ensure the RSI lows are getting lower.

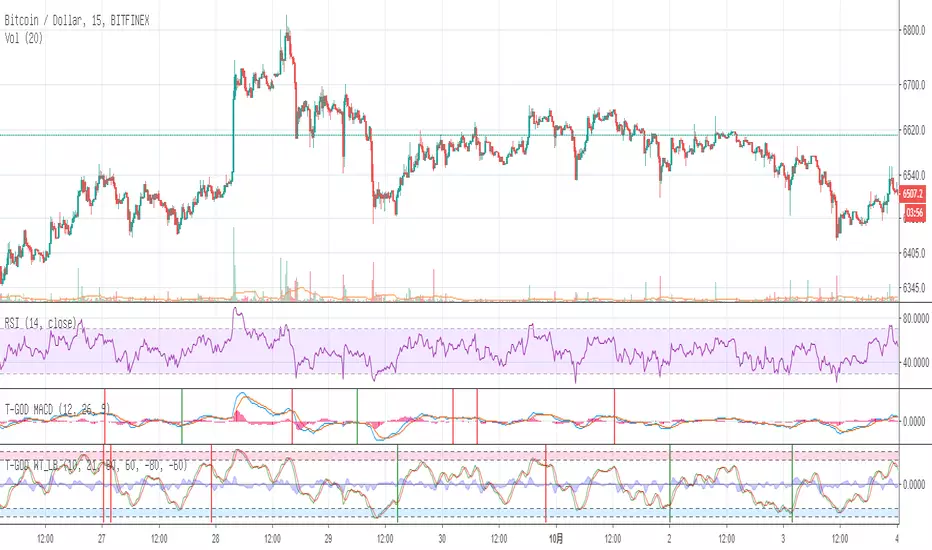
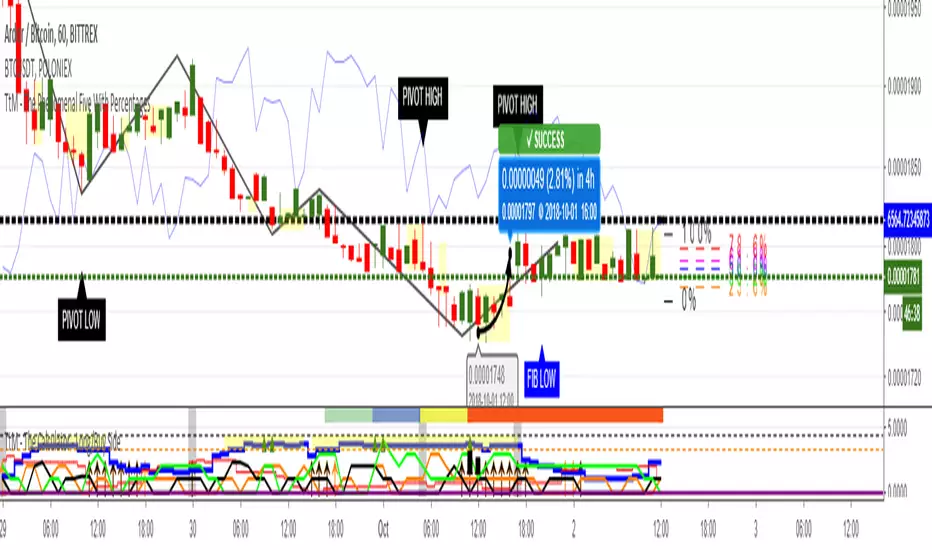
TtM - The Calculator - Long/Buy SideThe Calculator is more than just an indicator. The math from its underlying 16 built-in indicators is the core of my overall trading strategy.
The Calculator takes all that data, analyzes it behind the scenes and then displays it in an EASY to understand format.
Basically, The Calculator takes the work out of something that would ordinarily be very difficult and simplifies it down to a couple of symbols.
It also contains the coding necessary to fire off the 'Server Side ALERTS' provided by TradingView.
My suggestion is to take The Calculator for a FREE ride. Get in, kick the tires and try to break it. In other words, 'drive' it like you ‘STOLE IT’.
I think you will be pleasantly surprised at the simplicity, power and potential results.
Lastly, since the indicator will be for sale, I will take TradingView up on their House Rules that allow me to post an outside instruction link.
That information will provide ALL the details necessary to allow you to flip the coin (pun intended) as to whether The Calculator might be a good fit for you.
Here is that link:
drive.google.com
If you would like access to your 'One Week FREE Trial' of The Calculator, just Private Message me at:
www.tradingview.com
I am normally able to respond within 24 hours or less.
NOTE: I am NOT a professional trader. I DO NOT provide investment advice. This content and the data provided in the indicator is based on my live and simulated, personal observations and is intended for educational purposes ONLY. YOU are responsible for ALL your trading decisions and ALL subsequent tax ramifications. Past performance DOES NOT guarantee future results.
Acknowledgments: I would like to personally thank the following TV members for their inspiration and in certain cases, their code snippet usage approval: RicardoSantos, Shizaru, LazyBear, MarcoValente, karthikmarar, glaz and joe_vijay. By virtue of building on their publicly available code snippets, the finish line came sooner rather than later. Also, a special thanks to gyromatical for assistance and brainstorming.
Correlated Market Matrix - Correlation Computer - GyromaticalCorrelated Market Matrix - Correlation Computer
Works with up to 7 markets simultaneously to find price divergences.
Study Forex pairs, stocks, crypto alt coins.
Find potential entries quicker.
Short Description:
This indicator analyzes 6 markets and one spread (or 7 and no spread) against the currently loaded instrument,
with support for complex formulas. This indicator finds positive and negative correlations intrabar and throughout
the specified time frame simultaneously. It employs a weighting system and score threshold
(everything is user-definable) and signals upon positive or negative score. Alerts are included
for intrabar and overall positive and negative correlations.
Detailed description:
This indicator analyzes 6 different markets and 1 spread (or 7 different markets if no spread) and
measures correlations between them. The squares on the background are individual
correlations (intrabar) and the circles to the right-hand side depict whether the markets have risen
or fallen in price since the start of the specified time frame (red/green or gray for neutral).
To the right of the circles you have the instrument numbers. The numbers represent the instruments you
have specified, in order. Above these numbers and circles you will find two square icons.
You will notice the left-most icon has the caption of "Overall Score +" (or -) and the right-most icon
has the caption of "Intrabar Score +" (or -). The overall score measures the correlation score from the
start of the time frame to the present time. The intrabar icon measures the correlation score of
individual candles. The scoring system implements weighting which uses scores for each individual instrument
and all scores are user-definable (positive and negative). There is also a threshold level which is user-definable,
if the score reaches or crosses this level it will trigger the aforementioned signal icons.
The analyzation time frame is decided by the user. The Correlated Market Matrix can calculate from a
given date to present (real-time), or between two specified historic dates.
You are able to represent the correlations using the close (price) of the instrument or an EMA (speed is user-adjustable).
The spread has the individual option to use EMA or close (price) separately from the other instruments.
You have the option to assign the weight of any number (0 to 100) to any instrument if the instrument is bullish.
You additionally have the option of subtracting the numbers if it is bearish (-100 to 0).
You may assign both bullish and bearish weights to each instrument at the same time to obtain maximum balance.
If you do not desire custom weighting, simply leave the weights at 1.
The negative vs positive levels are then measured, and whichever score is the strongest determines if the
square icon displays "Overall Score +" or "Overall Score -" (same for Intrabar).
"Score +" means that the score is equal to or greater than the threshold.
"Score -" means that the score is less than the threshold.
Additionally you are provided the option of visualizing the actual correlation lines. This is useful in the sense that
you may view the direction of that particular secondary instrument without actually opening its chart. The color red
implies that the correlation is falling, while green implies it is rising. Please note that due to
limitations you cannot see the actual correlation value of these lines, and also this is an experimental feature so lines
may not always appear appropriately. In testing a line may vanish momentarily here and there but it is somewhat rare.
The background squares will tell you the actual state of the correlation.
HOW DO YOU READ IT?
The numbers represent the instrument you selected in that number slot.
The circles to the left of the numbers indicate if that market is up or down since the beginning of the specified timeframe.
Red means price is down, green means price is up, gray is neutral.
The icon "Intrabar Score +" or "Intrabar Score -" indicates whether the majority of markets are over their score threshold
(negative or positive correlation) for the current candle only.
If this is "Neutral" then there is no current score.
The icon "Overall Score +" or "Overall Score -" indicated the majority of markets are over their score threshold (negative or
positive correlation) for the OVERALL time frame (start to current, or start to finish if you are not using in real-time).
If this is "Neutral" then there is no current score.
For individual candle correlations, if the secondary instrument is up and the main instrument is down, the boxes are red.
If secondary instrument is down and main instrument is up, boxes are green.
If correlation lines are red then the correlation is becoming negative, if they're green then they're becoming positive.
This does not mean there is a negative or positive correlation, only that the correlation is rising or falling.
The background squares will tell you the state of the correlation.
PLEASE NOTE:
If you are using a white or bright colored chart, click the gear icon next to the indicator name.
Select the "Style" tab. The first option "Time frame Background Color" should be adjusted to either
black or white with no transparency (take note of the slider underneath the color squares).
This will make the matrix appear correctly.
INPUT MENU
By clicking the gear icon next to the indicator name, you are presented with a host of options.
The options are as follows, in order of appearance:
- Correlation Length : Amount of bars to look back for the correlation.
- Show Correlation Lines : Chose whether to display the correlation lines or not.
- Use Rising/Falling Colors : Use rising/falling colors for correlation lines instead of unique colors.
- Instrument Source : Chose from 'Price' or process the instrument through EMA instead.
- Price Source : This source works for both "Price" source and the EMA source.
- EMA Speed : Speed of the EMA if 'Instrument Source' is set to 'EMA'.
- Use EMA on Spread 1 : Use EMA on the 'Spread Instrument 1'. If unchecked, close is used by default.
- Use EMA on Spread 2 : Use EMA on the 'Spread Instrument 2'. If unchecked, close is used by default.
- EMA Speed for Spread 1 : Speed of EMA for Spread 1 if EMA is used instead of 'close'.
- EMA Speed for Spread 2 : Speed of EMA for Spread 2 if EMA is used instead of 'close'.
- Disable Spread and use Instrument 1 as correlated market instead : By default, the indicator takes both spread
instruments and calculates the spread between each (instrument1-instrument2=spread). If this feature is enabled, the indicator
will use only the 'Spread Instrument 1' and calculate it in the same manner as the other markets.
This is useful if you do not wish to use a spread and would rather have an extra market.
- Positive Weight of Instrument (1-7/spread) : Positive weight for the instrument.
It is recommended to enter only positive numbers here. If left 0, no weight will be added to the instrument but the indicator will
signal "Score -" if all others are also 0. If left at 1, if more markets are positive than negative, the indicator will present "Score +".
- Negative Weight of Instrument (1-7/spread) : This works in the same way as positive weight except it is recommended you enter
only negative numbers here (example: -1.5, -20). This number is subtracted from the overall score. If left 0, no weight will be
added to the instrument but the indicator will signal "Score -" if all others are also 0. If left at 1, if more markets are negative than positive,
the indicator will present "Score -".
- Threshold for score to be determined : if the weighting score of the instruments is this number or greater then
the square signal icon of + (greater) or - (lesser) is triggered.
- Instrument (1-6) : This is where you select which instruments/securities you wish to analyze. This input also
supports complex formulas, same as you'd enter them on your chart.
- Spread Instrument 1 : Instrument of part 1 of spread calculation
- Spread Instrument 2 : Instrument of part 2 of spread calculation
- From Month/Day/Year/Hour/Minute : Display data beginning at this specified time.
- To Month/Day/Year/Hour/Minute : Stop analyzing data at this specified time. To have it calculate indefinitely
in real-time, then the "To" settings should be left at Month: 12, Day: 31, Year: 2222, Hour: 23, Minute: 59.
STYLE MENU
- Time frame background color : The background color of the viewing area, especially helpful for white charts where colors may become faded.
- Correlation Line (1-7) : Properties for the displayed lines (if enabled). The first two colors are for rising and falling respectively
(if "Use rising/falling colors" is enabled), the last color is the default color of the line. This last color
will also be used for neutral if "rising/falling" is enabled.
- Instrument Label (1-7,Spread) : Properties for the right-hand numbered column, denoting which line is which instrument.
- Separator (1-8) : Solid lines between instruments
- Price Circle (1-7) : Circles between labels and background colors, denoting price rise/fall.
- Score + or - : Score icon above the instrument numbers
- Fill Row (1-6, Spread) : Background colors for the matrix. Default is red and green.
Have an idea? Customized logic is available for this framework.
This is not financial advice and this indicator system does not guarantee or claim to make profit.
The signals and ideas contained within this page and indicator are provided on an as-is basis. Use at your own risk.

