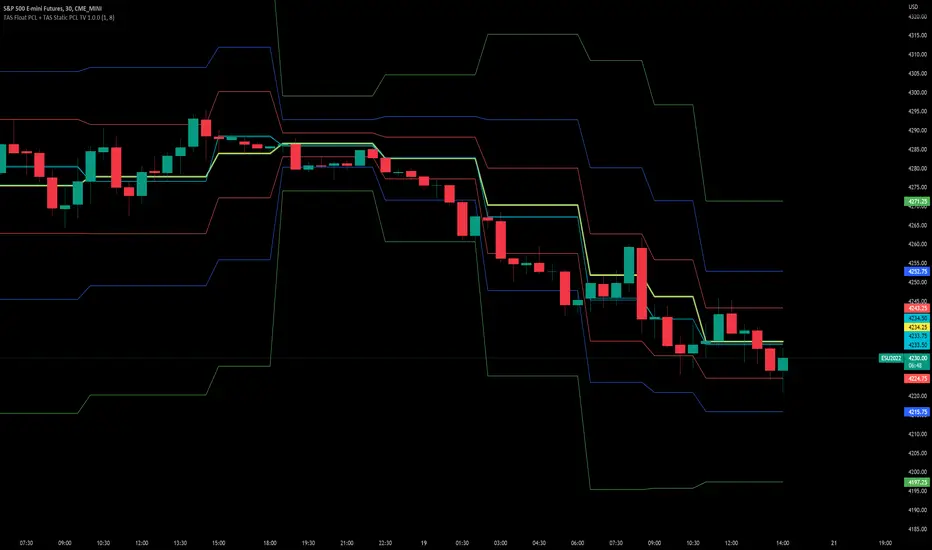
TAS Float PCL + TAS Static PCL [TASMarketProfile]TAS PRICE COMPRESSION LEVELS (PCLs) includes 2 distinct indicators that use volume at price analysis, volume aggregation and multi-timeframe confluence to calculate and display significant levels of commercial interest above and below the market. These levels reveal reliable trading levels which can be leveraged for enhanced trade entries, trailing stops and targets.
THERE ARE TWO TYPES OF TAS PCLs:
TAS Float PCLs - These levels take into account new data flow throughout the trading session and expands or contracts the levels dynamically in accordance with changing market conditions. These are often referred to by traders as “Floaters” or “Dynamic PCLs.”
TAS Static PCLs - These levels are set upon the start of the trading session and remain intact throughout the duration of the session. Many traders These are often referred to by traders as “Statics.”
Both TAS Floaters and TAS Statics have up to 10 horizontal lines available to display. The four center lines are referred to as Points of Control (POC). Three of these lines are colored cyan and one is yellow. The yellow line is more prominent and referred to as the Master Point of Control (MPOC) of the Price Compression Levels on display. The first area of commercial suppor t and resistance are plotted with red lines on both sides of the POC lines and commonly referred to as S1 and R1 levels. The next level of support and resistance areas are designated by blue lines (S2 and R2 levels) and then lastly the farthest from the POC lines are the green lines (S3 and R3 levels). By default, typically the green lines are not displayed but can be activated on an “as needed” basis within the indicator Style settings.
EXAMPLE OF TAS FLOAT PCLs:
ABOUT TAS FLOAT PCLs:
The TAS Dynamic PCLs (Floaters) reveal the price areas that attract commercial interest based on the current market conditions.
How the PCLs are plotted can be adjusted with two inputs controlled by the user.
----------1) MinSignal_123: This setting controls the sensitivity of the calculations. The default is set to 1 and this represents the most sensitive input that makes it easiest for market conditions to trigger new PCL levels. A setting of 2 is considered “medium” sensitivity and lastly a setting of 3 would require the most substantial change in conditions to trigger an adjustment of PCLs on the chart.
----------2) Length: This input setting determines the number of bars of data included in the calculation for new TAS Float PCLs to be adjusted on the chart. The default is set to 8.
MORE ON INPUT SETTINGS:
Using higher values in both inputs will display more significant areas of commercial interest for higher probability support and resistance levels around PCLs. These are referred to as “slow” Floaters.
Using lower value inputs will create Floaters that are more responsive to market conditions. These are referred to as “fast” Floaters.
When fast Floaters are contracted (cover a narrow range of prices) the market is tightly balanced and can easily enter into breakout conditions, if price closes outside of the TAS Float PCLs.
Expanded Floaters that are wider apart provide for greater rotational range trading conditions.
BELOW ARE THE RECOMMENDED INPUT SETTINGS COMBINATIONS THAT WILL DICTATE HOW RESPONSIVE THE PCLs WILL REACT TO CONDITIONS:
FAST (default): 1 - 8
MEDIUM: 2 - 14
SLOW: 3 - 34
The user will typically choose to have either Statics or Float PCLs active on the chart at a time, but not both as you'll have up to 20 levels on your chart (too many). You can, however, put them on different panes. Visit the INPUT settings of the indicator to select which one you want active.
The user can change the coloring, line type and thickness in the STYLE settings.
ABOUT TAS STATIC PCLs:
Many traders opt for TAS Static PCLs because they prefer to know the significant commercial interest price areas before they trade.
Unlike Floaters, TAS Static levels will not change throughout the trading session and are only affected if the user changes the opening and closing time parameters for the trading session displayed. By default, Static levels will recalculate and display new levels upon the reopen of the next session.
Tightly compacted POC lines designate an area of particularly strong commercial interest that provides higher probability, lower risk entries for extended directional moves. These areas are often referred to as “walls.”
If the POC lines are spread out over a wider range, a trader should be on the lookout for a more rotational trading session.
Periodically, one of the POC lines may be plotted outside of a red line (S1 or R1). In this case, the market may be biased in the same direction that the POC line is in relation to the red line.
TAS PRICE COMPRESSION LEVELS can be used as a stand-alone trading guidance system or in conjunction with other popular TASMarketProfile indicators.
Trade Well My Friends!
Zona de demanda
PT OrderBlockVersion 1.0 of the PT OrderBlock indicator was developed to visually identify supply & demand zones within price. This indicator can be used on all timeframes. My preferred method is swing trading the higher timeframe.
Orderblocks are formed when there is a break in structure once a big buy/sell candle has formed. These "blocks" will eventually get revisited on a retest acting as major support/resistance. An orderblock for a demand zone is populated on the chart when there is a bearish candle before a swift move to the top side (opposite direction). The same goes for the orderblock that is formed for a supply zone, it is the last bullish candle before a swift move to the downside. Once you see such behavior, the indicator will populate the orderblock for you. When an orderblock gets mitigated (tapped into) the indicator will change colors of the block to allow you to distinguish between a fresh and already taped supply/demand zone. It has been proven effective to enter entries based on retests of the orderblocks which take place AFTER a break in market structure.
*PT OB Features:
-OBs that have been partially filled will remove a portion of the background zone to indicate how much of the orderblock is left to fill in the full zone (Toggle Highlight remaining OB).
-OB trigger can be switched between candle open & wick. I prefer wick because it increases the probability of catching a low/high.
Video with strategy will be uploaded shortly! It is included as part of the library. Just message us for access!

Refracted EMARefracted EMA is a price based indicator with bands that is built on moving average.
The price range between the bands directly depends on relationship of Average True Range to Moving Average. This gives us very valuable variable constant that changes with the market moves.
So the bands expand and contract due to changes in volatility of the market, which makes this tool very flexible exposing psychological levels.

Customizable Pivot Support/Resistance Zones [MyTradingCoder]This script uses the standard pivot-high/pivot-low built-in methods to identify pivot points on the chart as a base calculation for the zones. Rather than displaying basic lines, it displays a zone from the original pivot point to the closest part of the available body on the same candle. The script comes in handy by utilizing Pinescripts available input.source() function to allow for an external indicators output value to be used within the indicator. Make sure to read all of the TOOLTIPS in the indicator settings menu to get a full understanding of what each setting does, and how it can affect the results that end up on the chart.
By enabling the custom filter in the indicator settings, you will notice you have the ability to filter out zones using an external indicator such as an RSI. Maybe you only want zones to be calculated/drawn when the RSI is overbought or oversold, or maybe you only want the zones to calculate/draw if the Supertrend is green or red. The list of possible filters that you can implement is too many to count. Feel free to play around with the indicator however you like, and configure something that you find to be the most useful for your trading.
On top of everything listed above, the indicator has pre-programmed built-in alertconditions so that you can potentially automate trading, or get a notification to your cell phone when a zone is being touched/broken.

Supply and Demand MultiTimeFrameWhat Is the Law of Supply and Demand?
The law of supply and demand is a theory that explains the interaction between the sellers of a resource and the buyers for that resource . The theory defines the relationship between the price of a given good or product and the willingness of people to either buy or sell it. Generally, as price increases, people are willing to supply more and demand less and vice versa when the price falls. ( -Investopedia )
This Indicator Help's you to find possible Supply and Demand zones formed on chart on MultiTimeFrame.
All the Supply Zones are colored RED and are above the current price. It will vanish once price crosses over it.
All the Demand Zones are colored GREEN and are below the current price. It will vanish once price crosses under it.
Only Untested Zone are plotted on chart.
These zones can be plotted on Chart TimeFrame as well as MultiTimeFrame(Higher). That can be selected from Input Section.
Concept Behind the Zones
1. Rally Base Rally
2. Drop Base Drop
3. Drop Base Rally
4. Rally Base Drop
Drop base rally
Rally base drop
rally base rally
drop base drop
For Supply zones we try to find "Drop Base Drop" and "Rally Base Drop" , and plot RED zones on the width of base. Base can include any number of candle ranging from 1 to 6. This can be controlled from Input Section
For Demand zones we try to find "Rally Base Rally" and "Drop Base Rally" , and plot GREEN zones on the width of base. Base can include any number of candle ranging from 1 to 6. This can be controlled from Input Section
How to Trade
We recommend to use 5-8 time Higher TimeFrame as Supply and Demand Zones. For Example if chart is at 5 min Timeframe then Zones should be plotted on 25 min to 40 min TImeframe.
And when Price reaches closer to Supply/ Demand Zone then use some other indicator to confirm the reversal from that level, like trendline , moving average etc.
Targets should be nearest Supply/ Demand Zone .

Carrey's Structure Supply and DemandThis script uses basic Rally Base Rally, Rally Base Drop, Drop Base Drop, and Drop Base Rally concepts to draw supply and demand zones. While the script is designed to account for multiple (up to 5) candles in the "base" phase, the box it will draw will only be the high and low of the last candle before the final Rally/Drop candle.

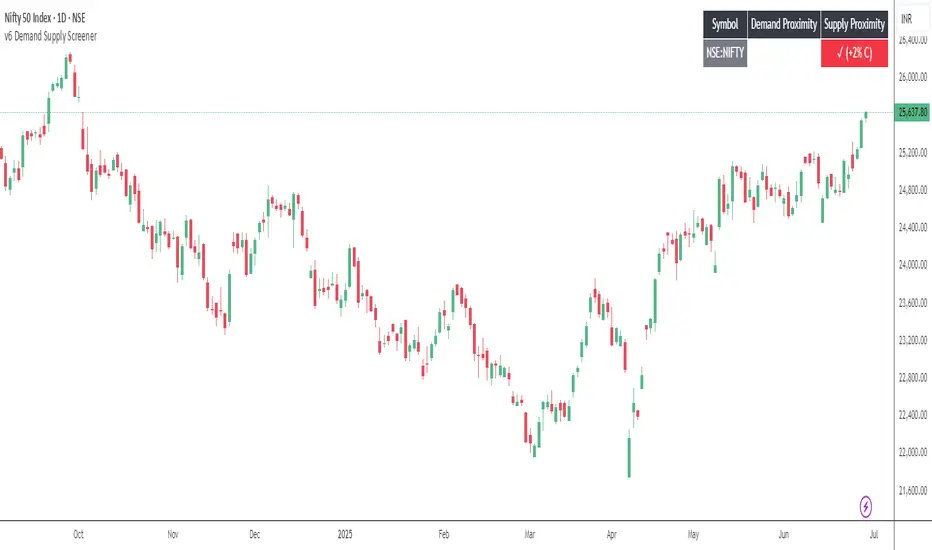
Demand Supply Screener 1.0The Demand Supply Screener helps in identifying symbols that are trading close to or inside Demand Supply Zones. You can provide a list of up to 40 symbols to the screener.
The more the number of symbols or smaller the time frame, the longer it will take for the screener to shortlist symbols. This can result in a calculation timeout. In such a case, you can reduce the number of symbols in the list by splitting it into multiple charts/indicators until the error is resolved.
Use "Proximity %" to filter symbols, for example, if you set it to 2%, the screener will shortlist symbols where the high/low of the time frame you are on is within 2% proximity of the supply/demand zone respectively.
For shortlisting symbols that are currently touching demand supply zones or trading inside of them use Proximity % as 0 and ensure Show Tested Zones is enabled.
Next Gen Auto S/RThis indicator will automatically plot support and resistance levels and will also allow you to overlay multi time frame support and resistance on any time frame that you are currently conducting analysis on. In addition you can also set alerts when a support and resistance level is tested, fine tune how many levels you would like to view on your charts, option to input how many candlesticks minimum you would like between support and resistance levels. You can also select breakout mode which will turn old support into resistance by a colour change and turn old resistance into support. NEW you can now use extended levels and change your zones into lines.

XPace* XPACE INDICATOR *
The XPace indicator represents a histogram view of the Tape Speed of the Floor. The Tape Speed (aka Pace) is represented as red and green bars drawn in a histogram view.
As the red histogram bars grow larger and increase in frequency, this shows that the BIDS are in kontrol at that time. And conversely, when the green histogram bars grow larger and instead in frequency, this shows that the OFFERS are in kontrol.
Weighing in whether the BIDS or OFFERS are in kontrol can be a helpful indicator to decide what direction the market could move in.
What is helpful about XPace is that it will show you the raw value of the BID and OFFER kontrol. This can be combined with XKontrol which will classify the kontrol as either Initial, Strong, and Total. Using these 2 indicators combined has added value.
* WHAT MAKES IT ORIGINAL *
Up to this point, there is not another indicator that represents the BIDS and OFFERS that correlate and represent the Tape Speed of the Floor.
* XKONTROL INDICATOR *
The other indicator on this chart is XKontrol, as shown as dots of varying sizes on the chart. The dots are a visual representation of who is in Kontrol relative to the Tape Speed of the Floor. The XKontrol indicator will show you who is in Kontrol, the BIDS or the OFFERS. This is a very powerful indicator. Great for long term plays and a *SCALPERS* paradise.
The XKontrol indicator reads the BIDS Being hit and the OFFERS being lifted, and then represents the strength of the Bids being hit and Offers being lifted as dots on the chart. The various dot sizes produced by XKontrol show the level of control the Bids or the Offers have at that point of time in the chart.
As the Dots grow larger, the level of Kontrol is increased. There are 3 dot sizes ranging from Small, Medium, and Large. Respectively they represent Intial Kontrol, Strong Kontrol, and Total Kontrol. Total Kontrol is achieved when either the BIDS or the OFFERS are dominating at the time. This is generally the direction you want to place your trades in and show that either the Bids or the Offers are flooding the market.
As the BID dots increase in frequency and in size this shows that the BIDS are in kontrol and dominating. Vice versa, when the OFFER dots increase in frequency and in size this shows that the offers are in kontrol and dominating. When you see the large dot that is generally a strong sign of the direction price may go. However, it also can be climactic and price could reverse. That would symbolize a case of Effort / No Result. For Example, when the BIDS are in Kontrol and dominating, make a lower low, and then price quickly reverses, it could symbolize a climax.
Usually XKontrol is used in conjunction with XPace, as XKontrol deciphers the Tape Speed of the Floor and draws graphical dots to show whether the BIDS or the OFFERS are dominating right on the chart. Reading XPace will show visually in the histogram the strength of the BID and OFFER Kontrol in the histogram.
* XKONTROL ALERTS *
Alerts can be set very easily with the instructions below.
1. Right Click Chart -> Add Alert...
2. Select Condition to be "XKontrol"
3. Select any level of Kontrol. For example you can Select "Offers Total Kontrol"
4. Select "Greater Than" with Value = 0
5. Options set "Once Per Bar Close" to only fire alert after bar closes
6. Customize Any other Alert Options you want
* EXAMPLE AND USE CASES *
Some practical examples of using XKontrol + XPace combined could be the following:
1. XKontrol Large Green Dot + XPace Large Green Bar could be that the OFFERS have gained total kontrol and are dominating against the Bids. Once would want to watch for higher prices to be potentially reached after that.
2. XKontrol Small Red Dot + XPace Large Red Bar could be that there was a lot of effort on behalf of the BIDS, but they failed to achieve any significant kontrol. The small red dot in XKontrol represents only initial kontrol which is weak kontrol. An application would be to watch for a potential break out on the up side and that will confirm that the BIDS overexerted their effort and was oversold.
3. XKontrol Red and Green Dots mixed could show that it has not been decided whether the BIDS or OFFERS are dominating and the outlook is neutral. If the XPace histogram bars don't stand out either, it would add another point for a neutral analysis.
* AUTHOR *
This script is published by MBoxWave LLC

XKontrol* XKONTROL INDICATOR *
Is a visual representation of who is in Kontrol relative to the Tape Speed of the Floor. The XKontrol indicator will show you who is in Kontrol, the BIDS or the OFFERS. This is a very powerful indicator. Great for long term plays and a *SCALPERS* paradise.
* WHAT THE SCRIPT DOES *
The XKontrol indicator reads the BIDS Being hit and the OFFERS being lifted, and then represents the strength of the Bids being hit and Offers being lifted as dots on the chart. The various dot sizes produced by XKontrol show the level of control the Bids or the Offers have at that point of time in the chart.
* HOW IT WORKS *
As the Dots grow larger, the level of Kontrol is increased. There are 3 dot sizes ranging from Small, Medium, and Large. Respectively they represent Intial Kontrol, Strong Kontrol, and Total Kontrol. Total Kontrol is achieved when either the BIDS or the OFFERS are dominating at the time. This is generally the direction you want to place your trades in and show that either the Bids or the Offers are flooding the market.
* HOW TO USE IT *
As the BID dots increase in frequency and in size this shows that the BIDS are in kontrol and dominating. Vice versa, when the OFFER dots increase in frequency and in size this shows that the offers are in kontrol and dominating. When you see the large dot that is generally a strong sign of the direction price may go. However, it also can be climactic and price could reverse. That would symbolize a case of Effort / No Result. For Example, when the BIDS are in Kontrol and dominating, make a lower low, and then price quickly reverses, it could symbolize a climax.
Usually XKontrol is used in conjunction with XPace, as XKontrol deciphers the Tape Speed of the Floor and draws graphical dots to show whether the BIDS or the OFFERS are dominating right on the chart. Reading XPace will show visually in the histogram the strength of the BID and OFFER Kontrol in the histogram.
* WHAT MAKES IT ORIGINAL *
Up to this point, there is not another indicator that shows BID and OFFER Kontrol on the chart, that correlates and represents the Tape Speed of the Floor.
* XKONTROL ALERTS *
Alerts can be set very easily with the instructions below.
1. Right Click Chart -> Add Alert...
2. Select Condition to be "XKontrol"
3. Select any level of Kontrol. For example you can Select "Offers Total Kontrol"
4. Select "Greater Than" with Value = 0
5. Options set "Once Per Bar Close" to only fire alert after bar closes
6. Customize Any other Alert Options you want
* XPACE INDICATOR *
The other indicator on the chart shown in the Histogram is called XPace. It represents a histogram view of the Tape Speed of the Floor. It correlates to XKontrol, but instead of Dots will draw histogram bars showing the extent of the BID or OFFER Control.
As the red histogram bars grow larger and increase in frequency, this shows that the BIDS are in kontrol at that time. And conversely, when the green histogram bars grow larger and instead in frequency, this shows that the OFFERS are in kontrol.
Weighing in whether the BIDS or OFFERS are in kontrol can be a helpful indicator to decide what direction the market could move in.
What is helpful about XPace is that it will show you the raw value of the BID and OFFER kontrol whereas XKontrol will classify the kontrol as either Initial, Strong, and Total. Using these 2 indicators combined has added value.
* EXAMPLE AND USE CASES *
Some practical examples of using XKontrol + XPace combined could be the following:
1. XKontrol Large Green Dot + XPace Large Green Bar could be that the OFFERS have gained total kontrol and are dominating against the Bids. Once would want to watch for higher prices to be potentially reached after that.
2. XKontrol Small Red Dot + XPace Large Red Bar could be that there was a lot of effort on behalf of the BIDS, but they failed to achieve any significant kontrol. The small red dot in XKontrol represents only initial kontrol which is weak kontrol. An application would be to watch for a potential break out on the up side and that will confirm that the BIDS overexerted their effort and was oversold.
3. XKontrol Red and Green Dots mixed could show that it has not been decided whether the BIDS or OFFERS are dominating and the outlook is neutral. If the XPace histogram bars don't stand out either, it would add another point for a neutral analysis.
* AUTHOR *
This script is published by MBoxWave LLC

Order Flow Imbalance Finder By TurkThis indicator is created to find the imbalances when a market exchange receives too many of one kind of order—buy, sell, limit—and not enough of the order's counterpoint and price shoots up or down and it left with unfilled orders. If you know how to trade the imbalances, this indicator can help you by find imbalances automatically.
Imbalance Finder By DrewThis indicator is created to find the imbalances when a market exchange receives too many of one kind of order—buy, sell, limit—and not enough of the order's counterpoint. If you know how to trade the imbalances, this indicator can help you by find imbalances automatically.

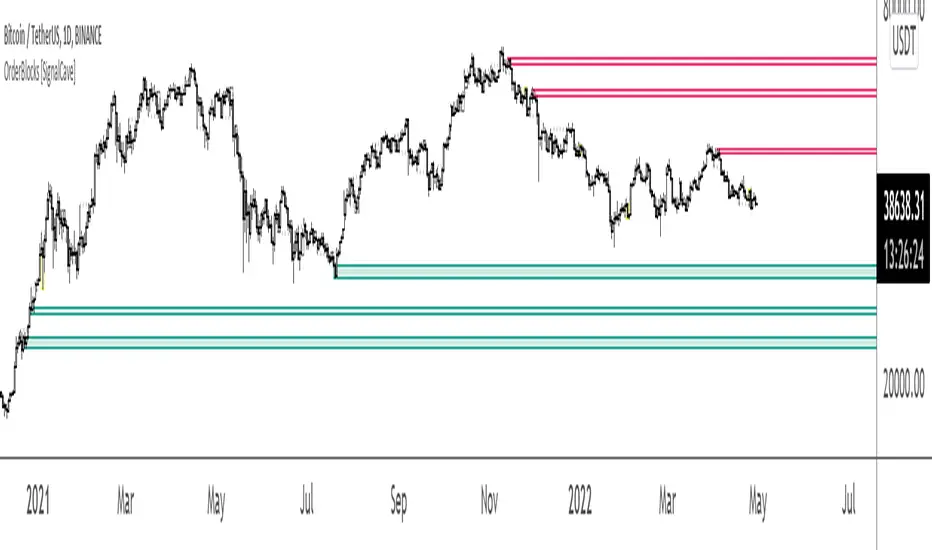
OrderBlocks [SignalCave]The OrderBlocks indicator is used to find the supply and demand zones that represent the support and resistance.
What it is Demand Zone?
A demand zone is the price area at which the traders usually buy. This area is present below the current price, where the highest buying interest or potential. This means the demand zone has many buyers available due to many buying orders at that level. When the price hits this level, the unfilled orders get completed and bring up the price.
What it is Supply Zone?
A supply zone is the price area at which the traders usually sell. This area is present above the current price, where the highest selling interest or potential. When the price hits this level, the unfilled orders get completed and bring down the price.
OrderBlocks Indicator
OrderBlocks indicator have four main visual output which are active demand zones (green), active supply zones (red), tested zones (yellow) and inactive zones (black).
Active Zones: Once the market structure breakout or breakdown, indicator draws a new zone (green or red). When the price enters in the active zone at the first time, price tends to bounce over it.
Tested Zones: If price touches the active zone but did not close any bar over or below it, indicator marks the tested zone as a yellow color. If the price touches multiple times, zone get weaker and tend to break when the price enters same zone once again.
Inactive Zones: If bar close over or below any active zone then indicator marks it as a black color and it turns an inactive zone afterwards. Inactive zones have less effective price turning points compare to active and tested zones.
Supply and Demand - Order Block - Energy CandlesSupply and Demand - Order Block - Energy Candles
Description
An experimental script, designed as a visual aid, to highlight the last up or down candle before a fractal break. We can assume these candles where the point of origin that generated enough strength to break recent structure. By using them as reference points, traders are expected to follow their own set of rules and mark higher probability supply and demand zones in the area.
How to use:
Expect a potential retest in these areas, and if they fail, a potential retest in the opposite direction. The greater the number of times a zone is tested, the more likely it is to break. A fresh zone that has not yet been tested will have a higher probability of a bounce.
Fractal period and candle break type can be personalised in settings. Can be used on all timeframes (higher the better).
Indicator in use:
Extras:
An option to flip candle colours if current price is above or below them has been added.

CHOCH - MSB for Supply and DemandChange of Character (CHOCH) - Market Structure Break (MSB) for Supply & Demand
Description
The script is designed as a confirmation entry tool to be used with supply and demand zones (predefined proximal and distal levels).
When price hits a predefined level it will monitor price action using fractals and an algorithm to determine a potential reversal in trend or change of trend direction.
Once this has been identified you will be alerted in order to anticipate a retracement entry. A good understanding of supply and demand concepts, odds enhancers, and how to identify fresh levels is expected to utilise it's full potential.
Indicator in use
How To Use
Apply one indicator on a higher timeframe, and another on a lower timeframe. In settings, select long for a demand zone and short for a supply zone. Use the higher timeframe to plot major supply and demand zones and a lower timeframe of your choice for the alert. You can refine your levels by manually entering the price levels in settings. The alert is set on the timeframe you set it on.
Manual Selection
Check "override custom levels" and manually enter the price levels of your proximal and distal lines. Input the time and date of your pivot point (candle). Manual selection is recommended as you can refine your zones.
Automatic Selection
Drag and drop the pivot on the candle of choice . The pivot point will mark the zone using the candle's high and low (default setting). Source for top and bottom levels can be changed in settings.
Start Control after X Bar
This defines how many bars is required (from your pivot point) before it sets to anticipate a breach.

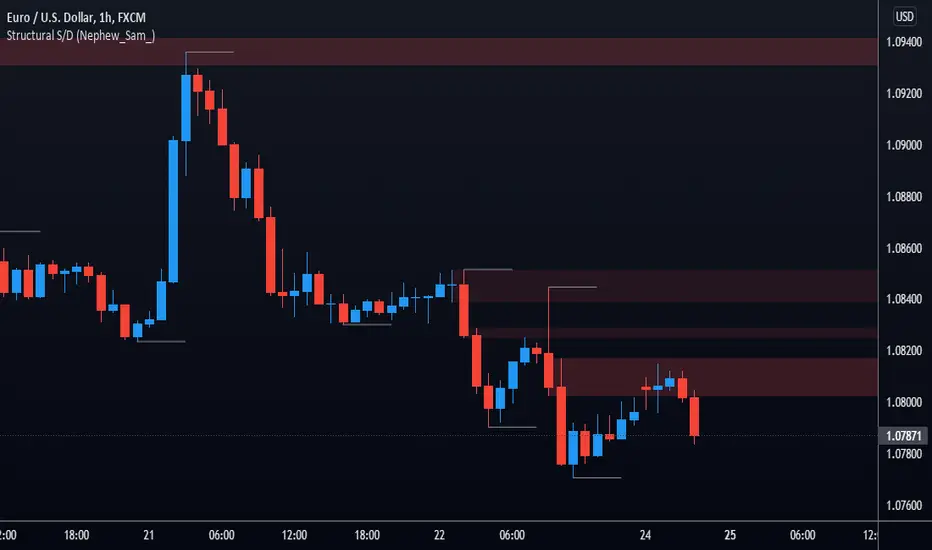
Structural S/D (Nephew_Sam_)This is a supply and demand indicator based on structural pivot points.
Everytime a pivot high/low is broken, it will plot the recent wicks of the candle that caused the break of pivot stucture and the one before it.
This is know as a 'stall' before an explosive move.
Indicator Settings:
Filled type - is zone filled once price closes away from it or if wick fills it
Delete filled - delete boxes once price has filled it
Pivots - similar to fractal points, each pivot is the highest/lowest point in a group of x left and x right bars
Box visuals - extend, colors, style etc
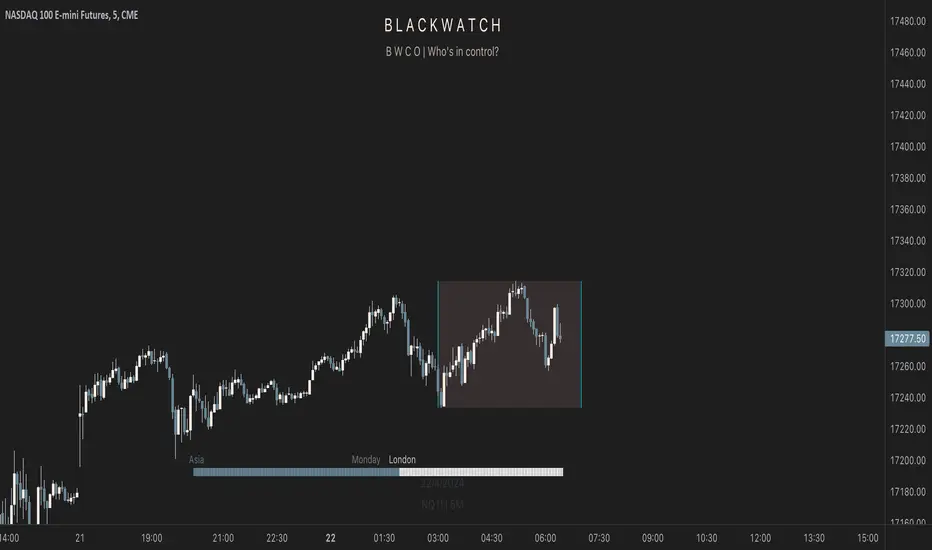
Phantom - My Session RangeThis is a modification of a script by RobMinty, "FXN - Asian Session Range" The script provides functionality to track specific trading sessions based on user preference rather than just the market sessions open and close. The idea is to help you hold yourself accountable to your specific trading times as well as backtest various marketing timings suitable to your schedule.
This script utilizes RobMinty's pine code to visualize your market session. We have adjusted the script to project the end of the session before the candles print - as well as adding/subtracting the horizontal and/or vertical lines around the current session box. This should help you understand how much time you have left in your session with a quick visual representation. While we have made some additions and adjustments to RobMinty's script- The inputs and functions of the combined script have not changed significantly from the originals. Like the originals, the code has been made open-source. If this script is reused or modified, please provide credit to RobMinty. If you plan to use this specific code with the ability to remove lines from the box and project session end forward, please credit both of us.
Supply, Demand and Equilibrium Zones, Interactive by DGTSupply, Demand and Equilibrium Zones, Interactive
The law of supply and demand is a theory that explains the interaction between the sellers of an asset and the buyers for that asset. The theory defines the relationship between the price of a given asset and the willingness of traders to either buy or sell it. Generally, as price increases, traders are willing to supply more and demand less and vice versa when the price falls.
Simply said, the higher the price, the lower the quantity demanded, and from the seller's perspective, the higher the price, the higher the quantity supplied
Equilibrium zones are the price levels where both selling and buying trading activity is high, both sellers and buyres are interested at that price levels. More correctly, there is a great deal of activity on both the buy and sell side and the market stays at that price level for a great deal of time. Supply and demand are balanced or in equilibrium
Supply and Demand Shifts may occur when institutional investors step in, a change in both price and quantity demanded from one point to another
This experimental study attempts to presend Supply, Demand and Equilibrium Zones by measuring traded volume at all price levels on the market over a specified time period. Then the result is plotted as horizontal zones on the finacial isntrumnet's chart that highlights supply, demand and equilibrium zones at specific price levels
It is important for supply, demand and equilibrium zones to understand that time is always a dimension on charts. The quantity demanded or supplied, found along the horizontal axis, is always measured in traded volume of the asset over a given time interval. Longer or shorter time intervals can influence the levels of supply, demand and equilibrium zones
The study is made interactive, which requires the users to select two points on the chart, by simply clicking on the chart. In case the user would like to view different range then just dragging the vertical lines will be enough
By increasing/decreasing values for supply and demand zones or equilibrium zones, you will either get the zones enlarged or detect supply and demand shifts or other equilibrium zones
It is adviced to use this study in conjuction with a Volume Profile study, such as Volume-Profile-and-Volume-Indicator , Volume-Profile-Custom-Range , Anchored-Volume-Profile , and Price-Action-Support-Resistance , where volume profiles presents trading activities at specific price levels and Supply and Demand Zones can be treated as Value Area (they are not exact same but similar) for Volume Profiles
Disclaimer: Trading success is all about following your trading strategy and the indicators should fit within your trading strategy, and not to be traded upon solely
The script is for informational and educational purposes only. Use of the script does not constitutes professional and/or financial advice. You alone the sole responsibility of evaluating the script output and risks associated with the use of the script. In exchange for using the script, you agree not to hold dgtrd TradingView user liable for any possible claim for damages arising from any decision you make based on use of the script

Jimmy's Dikfat DaytraderThis Day Trading Indicator applies the use of multiple techniques designed to maximize profits and trade success probability while utilizing proprietary mathematical techniques to calculate specific high probability Pivot Points, Break of Structure, Supply and Demand, previous days High and Low, Liquidity Hunts, Dynamic Trend Lines and Fibonacci Discount Zones. The combination of these techniques combined with unique mathematical calculation & variance allow the user to make an informed analysis to take high probability trades by exposing Market Maker discount zones and highlight smart money purchasing.
Pivot Points: A traditional pivot point is described as an individual candle high that is higher than the previous two candles to the left and forward two candles to the right. Likewise a pivot is also an individual candle low that is lower than the previous two candles to the left and forward two candles to the right. In this indicator standard pivots are highlighted as yellow and white candles. Yellow candles are High or Top Pivots; White Candles are Low or Bottom Pivots. The number of pivots checked for either left or right or both can be changed in the settings. Increasing this value will add more pivot points to the chart, decreasing this value will add less. It is recommended to change values left and right with the same number.
Note: In this study, all traditional pivots will be highlighted by yellow or white for the advanced user, but not all pivot markers will highlight all pivots for the purposes of identifying a high probability trade.
Break of Structure: Break of structure occurs when current price drops below or likewise rises above a pivot point. For the purposes of this study, a break of structure tag will appear over a previous pivot tag ONLY when there is a candle close below or above the previous pivot for the purposes of identifying liquidity hunts and high probability trades. As you will note in the example chart, break of structure is used to determine not only trend but high probability trade areas by identifying market structure. Unbroken pivot highs or lows can be used to take trades, with a stop below the low (or above the high) of the unbroken pivot candle. BOS (Break of Structure) Tags will effectively show where market participants do not want to take a trade and be chopped up in a market that is trending only 30% of the time. BOS also gives future indication of where the Market Makers are taking price action. Breaks of structure in a particular direction typically indicate a continuation of price action in that direction. Trade opportunities occur after the pullback in the opposite direction of break of structure. This highlights areas traders can take on the pullback, in the direction of structure breaks, typically on unbroken pivots.
Note: In this study, not all BOS (Break of Structure) markers will highlight all breaks of structure for the purposes of identifying a high probability trade. Some very few examples of structure is not marked as broken to assist in identifying Liquidity Hunts.
Liquidity Hunt: A Liquidity Hunt is where price action moves in the opposite direction of an intended move (typically with high magnitude and velocity) to gather "Liquidity" and trigger stops created by traders caught in the break of structure zone. Any unbroken pivot is a relevant area of Liquidity. Some of the High probability areas of Liquidity will be found at Equal (or near equal) Lows or Equal High pivots. Current areas of Liquidity are marked on the chart as an Aqua (Light Blue) Background line that extends right infinitely. Once Liquidity has been taken at one of these lines, the Line will "Break" And stop displaying forward. The number of pivots calculated specifically for break of structure and Liquidity Hunts can be changed under the Liquidity Hunt setting. Much like with pivots, it is recommended to change these numbers with the same value for best results.
Due to the complexity of the math, Some liquidity pivots will only confirm and display a pivot tag after twice the candles defined have been found to the left and right under liquidity hunt settings, and some will display after the exact number specified in settings. As noted previous some will not display at all due to the high probability nature of this indicator and having been found as a "cluster" in the Supply and Demand Boxes.
Supply and Demand Boxes: Supply and Demand boxes will be created when a specific number of pivots are found in succession or in a "cluster" and a box will be drawn from the current grouping of pivots, first pivot high to the nearest pivot low in the cluster. This unique style of supply and demand box drawing has been proven to be an effective identifier of buying and selling in the price action, or likewise support or resistance upon return to these boxes. The boxes were specifically designed to identify high probability areas of Supply and Demand and are more likely to be areas of high probability buying and selling. Supply is when price action moves into or creates an area where sellers are waiting. Demand is when price action moves into or creates an area where Buyers are waiting. When price action creates a box, the box will remain Neutral with a white color while Price action remains within the box. This box will turn Red or into a Supply Box, when price action drops below the box boundaries. The box will likewise turn Green or into a Demand Box, when price action rises above the box boundaries. Any return to a colored box from the direction it was created could be anticipated as a retracement to continue in the direction of price action indicated by the box.
In the settings boxes can be extended to the current bar right to show previous areas of supply and demand, or can be left "Truncated" or in box form as a highlighter for cluster analysis.
Previous Days High and Low: The previous days High and low will be displayed on the current day as a magenta line. Some traders use these lines to anticipate price action on the day compared to where price action is moving relative to the previous day. Historical Magenta lines are also the marked on a specific day, for the previous days High and low. Historical Lines can be turned off by reducing Opacity of the setting to Zero, leaving only the previous days high and low on the current day.
Dynamic Trend Lines: Trend Lines will be created automatically that will connect unbroken pivots and extend right, highlighting the current trend. (Coming Soon™️)
Fibonacci Discount Zone: The Fibonacci Discount Zone can be found by measuring an unbroken pivot High or Low, that breaks structure left to create a new High or Low. When structure is broken and price begins a retracement before moving back in the direction of the broken structure, the retracement is typically back into the "Discount Zone" between the 618 and 786 Fibonacci zone. This zone will be automatically plotted as a light grey box in the background of the chart. (Coming Soon™️)

[UPRIGHT Trading] OrderZones - Supply & Demand (Predictive) (cc)Hello Traders,
This is one that I've been working on a very, Very long time. As easy as it is to draw after the fact, as someone well versed in Supply and Demand; it's a bit more difficult to create all the calculations to show them, code them out, and then I went a step further — attempting to predict future ones as well.
Let's talk about what Supply & Demand Zones are. They are a pattern and technical analysis technique used in day and swing trading. Demand zone represents the area with strongest buying pressure and Supply zone represents selling pressure. Often these zones will show Institutional/Large buyers and sellers executing their orders causing price to move up or down very quickly, creating a long wick on a small and sometimes momentum that feeds into the larger timeframes. Therefore, in the simplest terms, the Supply and Demand Orderzones are the zones the price often gets rejected from or returned to; when Demand exceeds Supply, price jumps up and vice versa.
Unlike lines of support and resistance , these are zones more closely than precise lines, but can help gauge Support and Resistance on the fly.
Richard Wykoff was one of the first market analysts to explain the interaction of these phases, giving them four labels. It is in the understanding of Wyckoff's explanation of market price action, that supply and demand zones are also known as Accumulation and Distribution zones (Accumulation, Markup, Distribution, Markdown).
Shows potential entries on break from zone. Pivots. Large breakdowns or breakouts signalling possible trend change.
Super Fast Real-time Orderzone creation. Resistance line at Supply, shows multiple dimensions of each zone when large enough.
Different calculation, line, transparency settings
Minimalist mode with autobox
Features:
Multiple calculation modes with different lengths and displays.
AutoBox (Predictive Orderzones).
Buy/Sell Highlights.
UPRIGHT – Ultimate Reversals (Support/Resistance version).
Breakouts/Breakdowns + Signals.
Pivot Labels (HH, HL, etc).
Pivot Bar.
Pivot Buy /Sell Signals.
Fully Customizable—Change line types, transparency, colors, etc).
I am still working on the calculations for one more addition, but as it is, this should help anyone automate their S/D technical analysis.
Please see author instructions for access.
Cheers,
Mike
(UPRIGHT Trading)

True Supplies and Demands This indicator automatically helps you find supplies & demands using different detection methods.
Methods for classification:
i) Supply: High/Low; Demand: High/Low
ii) Supply: High/Open; Demand: Low/Open
Also in the indicator settings, you can define whether the indicator should hide the box if at least 1 tick was touched, or the indicator should display this until a complete breakout.
"Virgin" or untouched:
Touched, but not complete breakout:

RSI Supply / Demand ZonesLines plotted for the Low and High of the region of price that was Overbought or Oversold
(Low of the candle that became overbought and highest high in the Overbought period)
(High of the candle that became oversold and highest high in the Oversold period)
I like to use the dotted lines as pivot points for the reversal of the trend, and also pay attention to small tops and bottoms (normal lines) that form in strong trends, as they usually make for brief periods of acummulation/distribution before the continuation of the strong trend.

Supply and Demand Zone IndicatorOVERVIEW
The supply and demand zone indicator shows real-time supply and demand zones on the chart. It also plots a table including the high and low values of the zones. The last row of the table also shows the daily trend in the market.
CONCEPTS
What is Supply & Demand?
Supply and Demand represent the two most powerful forces of the forex market. Demand means the number of buyers buying a security in the market. Supply means the number of sellers selling a security in the market.
How to identify supply and demand zones?
Supply and Demand zones are formed on the base region of price on the chart. There are two types of movement of price in technical analysis.
Impulsive wave
Retracement wave
The impulsive wave represents the price movement of market makers. The Retracement wave indicates base regions where market makers decide their next direction to go up or down.
There are four fundamental concepts of Demand and supply in forex.
Rally Base Rally (RBR)
Rally Base Drop (RBD)
Drop Base Rally (DBR)
Drop Base Drop (DBD)
How does supply & demand indicator work?
Our supply & demand indicator will use a simple formula based on price action to plot the zones. It will plot the zone on the base candles using the high and low of the base zone.
Base candle = a candlestick that has a small body and big shadows like a Doji candlestick.
Big candle = a candlestick with a large body and small shadows.
The zone will be drawn on the high and low of the base candlestick. There can be more than one base candlesticks in the base zone, but our indicator will identify the maximum of 4 base candlesticks.
FEATURES
Specify desired Big Body Candle Size Percentage
Specify desired Small Body Candle Size Percentage
Change the Colors of Zones at your own will
The Indicator Draws the latest zones and puts a label on historical Zones
The Indicator Draws real-time Zones under specified conditions of candle body sizes. The Zone will stop once the candlestick closes above the supply zone or below demand zones.
Recommended Timeframe
Above 30 Minutes
