Better DEMAThe Better DEMA is a new tool designed to recreate the classical moving average DEMA, into a smoother, more reliable tool. Combining many methodologies, this script offers users a unique insight into market behavior.
How does it work?
First, to get a smoother signal, we need to calculate the Gaussian filter. A Gaussian filter is a smoothing filter that reduces noise and detail by averaging data with weights following a Gaussian (bell-shaped) curve.
Now that we have the source, we will calculate the following:
n2 = n/2 (half of the user defined length)
a = 2/(1+n)
ns
Now that we have that out of the way, it is time to get into the core.
Now we calculate 2 EMAs:
slow EMA => EMA over n
fast EMA => EMA over n2 period
Rather then now doing this:
DEMA = fast EMA * 2 - slow EMA
I found this to be better:
DEMA = slow EMA * (1-a) + fast EMA * a
As a last touch I took a little something from the HMA, and used a EMA with period of √n to smooth the entire the thing.
The Trend condition at base is the following (but feel free to FAFO with it):
Long = dema > dema yesterday and dema < src
Short = dema < dema yesterday and dema > src
Methodology
While the DEMA is an amazing tool used in many great indicators, it can be far too noisy.
This made me test out many filters, out of which the Gaussian performed best.
Then I tried out the non subtractive approach and that worked too, as it made it smoother.
Compacting on all I learned and smoothing it bit by bit, I think I can say this is worth looking into :).
Use cases:
Following Trends => classic, effective :)
Smoothing sources for other indicators => if done well enough, could be useful :)
Easy trend visualization => Added extra options for that.
Strategy development => Yes
Another good thing is it does not a high lookback period, so it should be better and less overfit.
That is all for today Gs,
Have fun and enjoy!
DEMA-EMA

Dee EMA 5.0
1. Indicator Features:
- The indicator can plot four different sets of EMA on a chart.
- The EMA values can be displayed on the chart with their respective names (e.g., ema9, ema20, etc.).
- The indicator allows customization of the EMA values.
2. Purpose of Dee_EMA 5.0:
- Dee_EMA 5.0 is a unique EMA indicator specially designed for traders to provide better insights and aid in trading decisions.
- The primary reason for building this indicator is to address the challenge of managing multiple time frames while using normal EMA tables.
- Traditional EMA tables might not show all EMA values across different time frames simultaneously, leading to time-consuming processes like shifting time frames and refreshing charts.
- Dee_EMA 5.0 solves this issue by displaying EMA values for different time frames in one table, allowing traders to make quick judgments without repeatedly changing time frames and refreshing charts.
3. Importance of Different Time Frame EMA Values:
- Different time frames EMA values are crucial in trading because they provide valuable insights into the market dynamics at various levels.
- When using shorter time frames (e.g., 1-minute), EMA values can help identify short-term trends, support, and resistance levels.
- On the other hand, using larger time frames (e.g., 5-minute or 15-minute) provides more data and increases the accuracy of EMA-based analysis, enabling traders to identify longer-term trends and potential price movements.
4. EMA Crossover Table:
- Traders often prefer a clutter-free chart without too many lines, but they still need access to EMA values for analysis.
- The EMA table and EMA crossover table serve this purpose by providing EMA values and EMA crossover information in a structured table format.
- With the EMA crossover table, traders can quickly check EMA values and crossovers across different time frames without having to switch time frames repeatedly, saving time and facilitating faster decision-making during trading.
In summary, Dee_EMA 5.0 is an EMA indicator designed to help traders efficiently analyze EMA values across different time frames, allowing for faster and more informed trading decisions. The EMA crossover table provides additional convenience by presenting EMA crossovers without cluttering the chart.

Smooth EMA/DEMA/TEMA/EHMA (SEMA)This is my attempt at smoothing the exponential moving average any its cousins. I literally just smoothed the source and alpha and this is what we got. I really like this because you get a nice smooth yet fast acting moving average that works better than a traditional simple moving average. This script also included directional alerts.
Smooth EMA
Smooth DEMA
Smooth TEMA
Smooth EHMA

SUPER MULTI MOVING AVERAGE [Gabbo]📈 Moving Average Indicator Update - Version 2
🔹 New Features and Improvements:
1️⃣ Enhanced MA Selection for Table Lines:
Previously, the indicator did not allow users to choose a different Moving Average type for the table lines. Now, you can select the MA type for the table.
2️⃣ New Table Text Customization Inputs:
Added inputs to choose the table text color and size for a more personalized display.
3️⃣ Improved Input Visibility and Organization:
We’ve reorganized the inputs so that the most commonly used options are now placed at the beginning for quicker and more convenient configuration.
4️⃣ Bug Fixes and Code Improvements:
Minor bugs have been fixed, and the code has been optimized for improved stability and performance. The code is now cleaner and fully functional in version 6.
5️⃣ Cometreon Public Library Integration:
To lighten the code and improve modularity, we’ve integrated the Cometreon public library. This makes the code more efficient and reduces the need to duplicate common functions.
☄️ With this update, the Moving Average indicator becomes even more versatile and user-friendly, offering a refined table interface and enhanced customization options!

Variety N-Tuple Moving Averages [Loxx]Variety N-Tuple Moving Averages is a moving average indicator that allows you to create 1- 30 tuple moving average types; i.e., Double-MA, Triple-MA, Quadruple-MA, Quintuple-MA, ... N-tuple-MA. This version contains 5 different moving average types including T3. A list of tuples can be found here if you'd like to name the order of the moving average by depth: Tuples extrapolated
You'll notice that this is a lot of code and could normally be packed into a single loop in order to extract the N-tuple MA, however due to Pine Script limitations and processing paradigm this is not possible ... yet.
If you choose the EMA option and select a depth of 2, this is the classic DEMA; EMA with a depth of 3 is the classic TEMA, and so on and so forth this is to help you understand how this indicator works. This version of NTMA is restricted to a maximum depth of 30 or less. Normally this indicator would include 50 depths but I've cut this down to 30 to reduce indicator load time. In the future, I'll create an updated NTMA that allows for more depth levels.
This is considered one of the top ten indicators in forex. You can read more about it here: forex-station.com
How this works
Step 1: Run factorial calculation on the depth value,
Step 2: Calculate weights of nested moving averages
factorial(nemadepth) / (factorial(nemadepth - k) * factorial(k); where nemadepth is the depth and k is the weight position
Examples of coefficient outputs:
6 Depth: 6 15 20 15 6
7 Depth: 7 21 35 35 21 7
8 Depth: 8 28 56 70 56 28 8
9 Depth: 9 36 34 84 126 126 84 36 9
10 Depth: 10 45 120 210 252 210 120 45 10
11 Depth: 11 55 165 330 462 462 330 165 55 11
12 Depth: 12 66 220 495 792 924 792 495 220 66 12
13 Depth: 13 78 286 715 1287 1716 1716 1287 715 286 78 13
Step 3: Apply coefficient to each moving average
For QEMA, which is 5 depth EMA, the caculation is as follows
ema1 = ta.ema(src, length)
ema2 = ta.ema(ema1, length)
ema3 = ta.ema(ema2, length)
ema4 = ta.ema(ema3, length)
ema5 = ta.ema(ema4, length)
qema = 5 * ema1 - 10 * ema2 + 10 * ema3 - 5 * ema4 + ema5
Included:
Alerts
Loxx's Expanded Source Types
Bar coloring


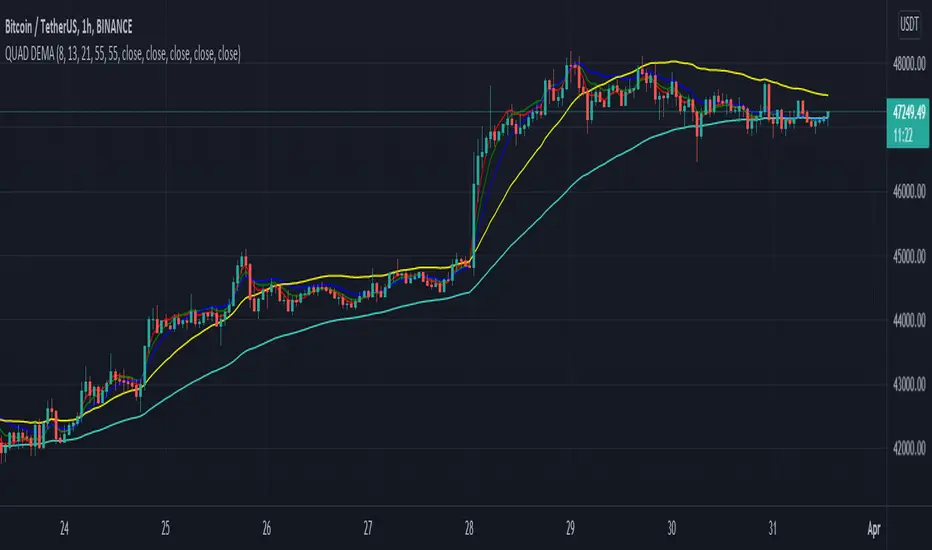
QUAD DEMAHey Folks,
Just created my first script, It's basically 4 DEMA in one indicator which helps you not to use multiple indicators.
It's more accurate than Exponential Moving Average & give signals much prior to the breakout, very helpful in short timeframes.
Tweak it according to your preference
Instructions to use
-When 55 DEMA crosses all the DEMA it's a clear signal for uptrend or downtrend which can potentially be a entry or exit points.
-Don't depend on this when all the DEMA's are entangled to each other.
-Use Stochastic RSI for better approach in entry.
-Most accurate in 1hr time frame for short term entry.
Enjoy!
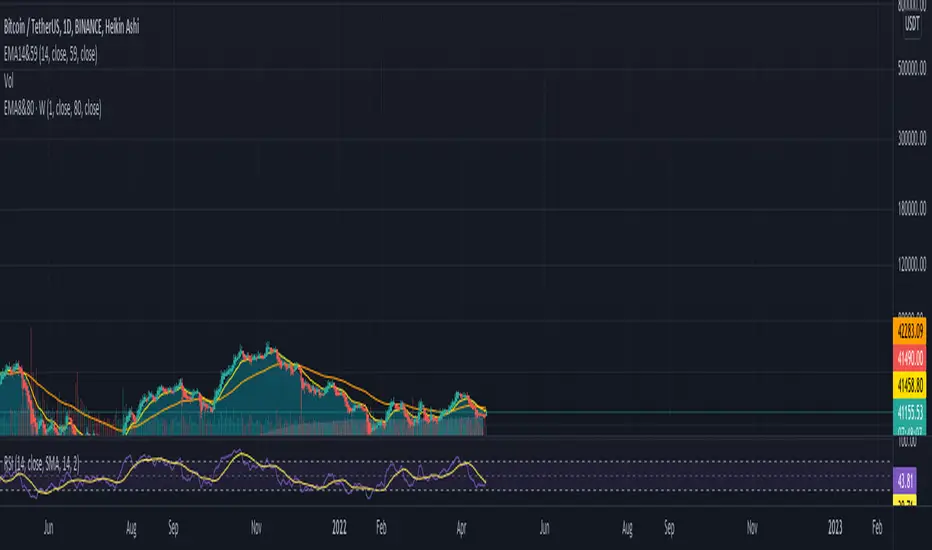
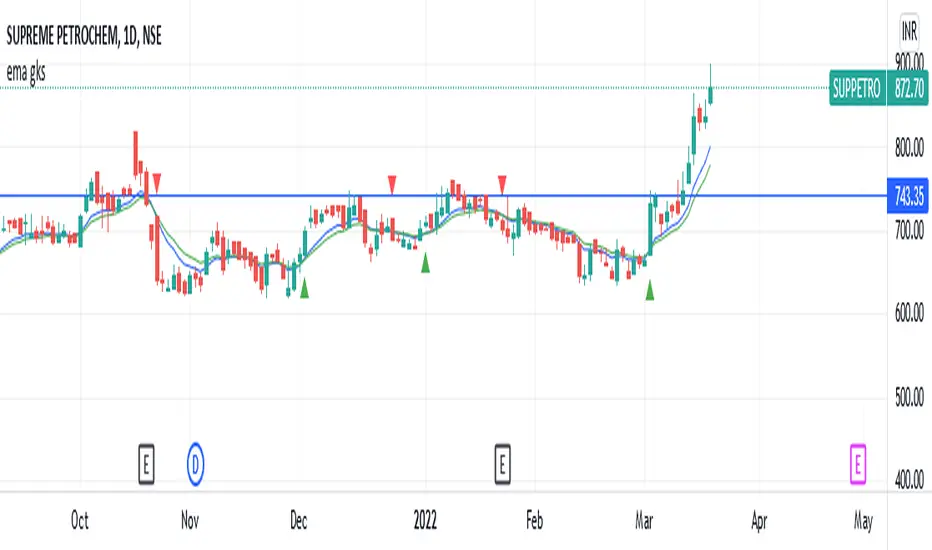
ema gksthis strategy is very simple scripting to buy and sell based on crossover of exponential moving averages
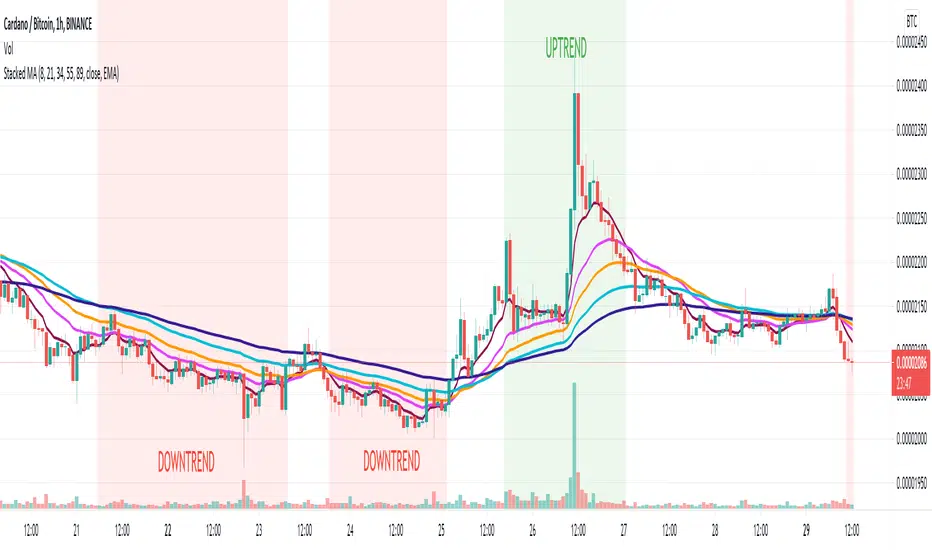
Stacked Moving AveragesThe Stacked Moving Averages indicator lets you see if a ticker is in an uptrend, downtrend, or no trend based on the condition of the moving averages. If the moving averages are stacked such that MA1>MA2>MA3>MA4>MA5, then that is described as an uptrend. If the moving averages are stacked such that MA5>MA4>MA3>MA2>MA1, then that is defined as a downtrend.
The moving averages can be SMA, EMA, or DEMA, and it’s possible to view all the moving average series in the chart or hide all series and only see if there is an uptrend or downtrend according to the condition.
Note: If length 4 OR length 5 is zero the MA4 OR MA5 will be ignored.
Multi Timeframe Moving Average [xdecow]This indicator plots a moving average of 4 different timeframes.
The types of averages available are: SMA, EMA, DEMA, VWMA, RMA, WMA.

Multi Time Frame Moving Averages [Anan]Hello friends,
All your popular moving average now in one indicator, also no need to open a lot of tabs to see where is that moving average at that time frame,
with multi time frame feature, now u can see up to six multi time frame MA in the same chart with option to show/hide it
list of moving averages:
SMA
Smooth SMA
SuperSmooth MA
EMA
DEMA
TEMA
Triangular MA
QEMA
RMA
Hull MA
KAMA
WMA
VWMA
VWAP
CTI
LSMA
VIDYA
Blackman Filter
Adaptive RSI
also there is an option to see the Average of four lengths, i backtest this and found it super great !

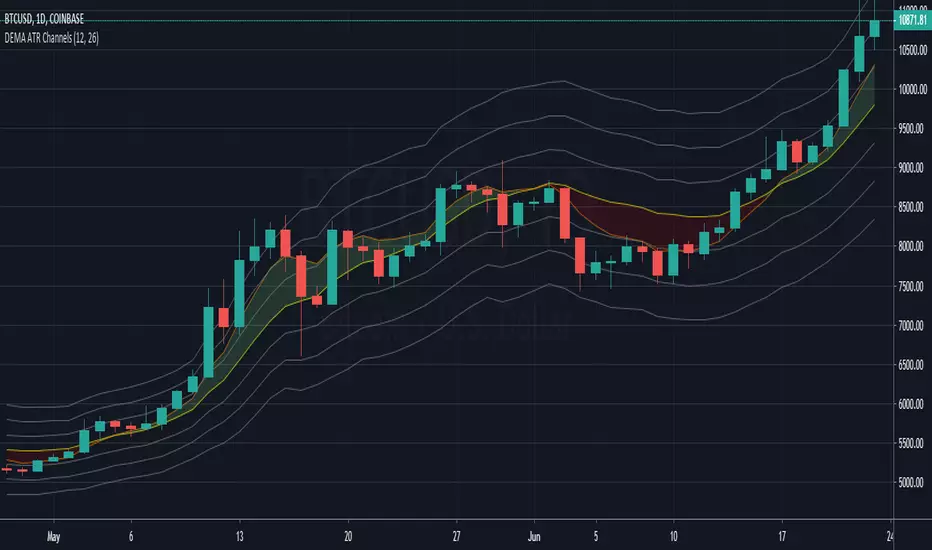
DEMA ATR Channels - New IndicatorA Double Exponential Moving Average (DEMA) with three sets of channel lines each one Average True Range (ATR) apart, above and below the DEMA.
Similar to my "ATR Channels" indicator, but using a DEMA instead of an EMA for the base. In addition, this indicator also plots a fast DEMA as well as a fill between the two. Fully customizable, you can toggle both DEMAs, the fill, and each set of ATR Channels.
ATR channel idea from Kerry Lovvorn as mentioned in Elder's "New Trading for a Living", page 93: "Kerry Lovvorn likes to plot 3 sets of lines around a moving average: at one, two, and three ATRs above and below an EMA . These can be used for setting up entry points and stops, as well as profit targets."