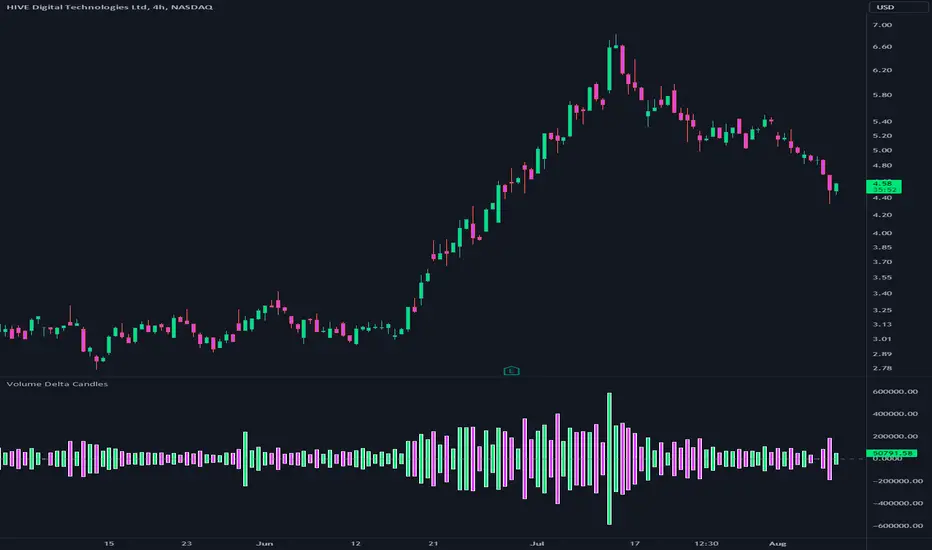
Volume Delta CandlesThis indicator is designed to visualize the volume delta, which represents the difference between buying and selling volumes during each candle period. The indicator plots custom candlesticks on the chart, with OHLC values calculated based on the volume delta.
Calculations:
To calculate the volume delta, the indicator first determines the buying and selling volumes. If the closing price is higher than the opening price (close > open), the volume is considered as buying volume. If the closing price is lower than the opening price (close < open), the volume is considered as selling volume. Otherwise, the volume is set to zero. The volume delta is then calculated as the difference between the buying volume and the selling volume.
The custom OHLC values are derived from the volume delta. The custom open is obtained by subtracting the volume delta from the closing price. The custom close is obtained by adding the volume delta to the closing price. The custom high is set as the maximum value between the closing price and the custom open, ensuring that the candle represents the highest value within the range. The custom low is set as the minimum value between the closing price and the custom open, ensuring that the candle represents the lowest value within the range.
Interpretation:
The indicator's custom candles provide visual insights into the volume delta. Each candlestick's color (lime for positive volume delta, fuchsia for negative volume delta) indicates the dominance of buying or selling pressure during that period. When the volume delta is positive, it suggests that buying volume exceeded selling volume, possibly indicating a bullish sentiment. Conversely, when the volume delta is negative, it indicates that selling volume was higher, potentially signaling a bearish sentiment. The indicator also plots a zero line to represent the equilibrium point, where buying and selling volumes are equal.
Potential Uses and Limitations:
Traders can use the indicator to gain insights into the strength and direction of buying and selling pressures. Positive volume delta during an uptrend could suggest the presence of strong buying interest, potentially supporting further bullish moves. On the other hand, negative volume delta during a downtrend could indicate intensified selling pressure, hinting at potential further declines. Traders might use the indicator in conjunction with other technical analysis tools, such as support and resistance levels, trendlines, or oscillators, to confirm potential reversal points or trend continuations.
It's essential to interpret the indicator in the context of the overall market environment. While volume delta can provide valuable insights into short-term buying and selling imbalances, it is just one aspect of market analysis. Traders should consider other factors, such as market structure, fundamental events, and overall sentiment, to make informed trading decisions. Additionally, the indicator's efficacy might vary across different market conditions, and it may produce false signals during low-volume periods or choppy markets.
Conclusion:
By visualizing volume delta through custom candlesticks, traders can gauge market sentiment and potentially identify key reversal or continuation points. As with any technical indicator, it is advisable to use the Volume Delta Candles in combination with other tools to gain a comprehensive understanding of market conditions and make well-informed trading choices. Additionally, traders should practice proper risk management techniques to protect their capital while using the indicator in their trading strategy.
Deltacandles
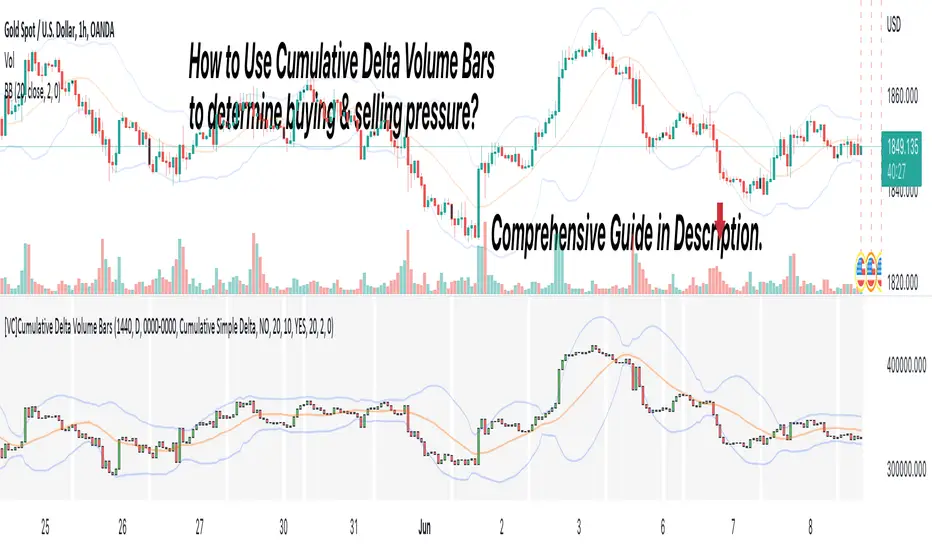
[VC] Cumulative Delta Volume BarsLet's first learn what is Delta & How to Use Cumulative Delta Volume Bars?
Cumulative Delta Volume Bars is one of the leading indicators that you can use when trading order flow. It gives you an instant snapshot of the buying and selling pressure in a market.
After reading the detailed description of "Cumulative Delta Volume Bars," you will understand how volume delta provides a critical edge by allowing you to spot significant potential reversals in the market. You will also learn to use this Cumulative Delta indicator in depth. (including rest session usability features)
What is Delta Volume?
Delta Volume is the difference between Buying and Selling Power. Delta Volume is calculated by taking the difference between the volume traded at the offer price and the volume traded at the bid price. (in simple words, the difference between buying pressure & selling pressure)
If delta volume is more than zero, you have more buying pressure than selling & vice versa, and if delta volume is less than zero, you have more selling pressure than buying.
In Order-Flow Analysis , traders used Cumulative Delta to measure the relationship between the Buying & Selling pressure Vs Price.
Cumulative delta volume takes the delta values for every bar and successively adds them together to provide a graph, as seen below visually.
Let me demonstrate by giving examples of how cumulative Delta can help measure the buying or selling pressure relative to the price move.
★ Trading Absorption & Exhaustion concepts with Delta
See the chart below & try to analyze the next possible move on the basses on the analysis mentioned on the chart.
➽➽ If you said Short, you were correct. ✅
Till Point A , both price & cumulative were aligned. (means there were no imbalances between Delta & Price).
But on Point B , the Cumulative Delta broke the previous resistance clearly and moved even further away from the resistance level, but the Price couldn't break the last resistance. It interprets that buyers applied a lot of buying pressure but no result. (Aggressive buying pressure absorbed by Passive sellers)
Due to this vast effort or failed attempt, buyers were exhausted and had no more strength to pull the Price up. That's why the Price reversed from Point B . See below image
★ Cumulative Delta Volume Bars is helpful when determining buying or selling pressure at different key price levels, such as swing highs or lows.
Let's recap on swing highs and swing lows.
➽ A swing high (S.H) is formed when the high reaches higher than the price action around it. Once the Price moves above a prior swing high and begins to retrace, a new swing high is formed.
➽ A swing low (S.L) is formed when the low reaches lower than price action around it. Once the Price moves below a prior swing low and begins to retrace, a new swing low is formed.
➽ When the Price makes higher highs and higher lows, a market is considered an uptrend.
➽ When the Price is making lower lows followed by lower highs, a market is considered a downtrend.
When evaluating Delta, it's beneficial to compare delta values at swing lows or swing highs to determine the amount of selling or buying pressure and how the market reacts.
The actual Power of Delta is revealed when we use it to determine the market's reaction to powerful buying or selling. We want to see if the market has reacted as we would expect or not.
In the above Example, you will notice that every time price breaks a swing, Delta does as well.
It makes sense as it takes selling pressure to break a swing low or buying pressure to break a swing high. In simple words, we can say that there is no anomaly between delta direction & price direction.
In simple words (No Absorption or Exhaustion)
But what's occurring when this isn't the case, and we have divergence between Price and Delta? Let's analyze it with real examples.
★ Understanding Delta Divergence.
(Lack of Harmony in Buying/Selling Pressure & Price Move)
Notice how the Price breaks out of the previous resistance level on the above chart, but the Delta didn't yet reach even close to its last resistance level. It's a clear divergence between Price and Delta. Buyers may be slightly exhausted at the previous resistance level, and Price & Delta may retrace slightly. But in a broader view, it reflects a strong bullish signal.
See the above chart & see when and why the Price moved. I hope it will help you understand the underlying relation & story between Price & Delta.
Cumulative Delta & Trade Management
Delta will help you spot significant reversals, but it can also be used to help manage your open trade. You want to see a high correlation between Delta and Price when in a long or short position.
Suppose you're short while the Price is breaking a new low. You want to see Delta breaking low if sellers aren't interested in selling at the recent lows, represented by Delta not breaking lows. The probability of a short term reversal or a significant retrace increases.
When in a position, always be on the lookout for exhaustion and absorption, signalling a reversal potential.
What Includes in V.C Cumulative Delta Volume Bars Indicator
Inputs & Settings
Reset accumulation on new session:
Allows you to rest accumulation at the start of each session (you may choose your customized starting & ending time as well by enabling ''Customize Rest Session Time''
Start/End of Session & During Session:
Allows you to show/hide & choose the background color & separator of each session
''Customize Rest Session Time''
When this setting is enabled, your customized given time will be applied, which can be set from the below box. Note: set your time in minutes. For Example, if you want to reset the session after every hour, you need to put 60. If you're going to reset after every 8 hours, you need to put 480. Additionally, your chart time frame must be lower than your customized rest time.
Reset Each Minutes:
Allows you to put your desired rest time in minutes. For Example, for 1 hour 60, for 8 hours 480. (8x60)
Reset Each:
Allows you to choose rest time from the drop-down menu. Note: To apply this setting, don't enable the ''CUSTOMIZE RESET SESSION TIME''.
Select Session:
Allows you to set customized starting & ending times of the session instead of the exchange's default time. For Example, the exchange reset time is 20:00, but if you want 22:00, first, you need to set your chart time as an exchange from the right bottom of the chart, and then you need to put 22:00 22:00 in both fields. Note: Put the same starting & ending time. In simple words, it should not be greater than or less than 24 hours.
Type:
It allows you to select Delta type. (there are two delta types you can choose from, 1st Simple Delta, 2nd Delta % or Volume Weighted Delta)
Candle Colors:
Allows you to change the color of candles.
Envelope Indicator:
Allows you to apply to Envelop Indicator on the delta candle. (all default settings of the Envelop Indicator can be customized as well)
See the below chart with Envelop applied to Delta Candles & Price Candles. (can be used to measure the Delta & Price movement at the micro-level)
Bollinger Bands Indicator:
Allows you to apply to Bollinger Bands Indicator on the delta candle. (all default settings of the Bollinger Bands Indicator can be customized as well)
See the below chart with Bollinger Bands applied to Delta Candles & Price Candles. (can be used to measure the Delta & Price movement at the micro-level)
Start/End of Session on Chart
Allows you to change the first & last candle of the session.
Style Settings:
Allows you to control all the visual settings of delta candles, Envelop & Bollinger bands.
-------------------------------------------------
➽Conclusion:
Cumulative Volume Delta Bars is one of the leading indicators you can include as an order flow trader in your arsenal. It gives you an inside look at buying and selling pressure and how the market reacts.
But Keep in mind, in trading & technical analysis, nothing is 100% certain. No indicator can give you a 100% success rate. There is no holy grail in the financial market. As a trader, with the help of technical & fundamental indicators, our goal is to find an edge over the market. A simple definition of an edge is: Anything that adds a few points to the winning side of an equation builds an edge that lasts a lifetime. A trading edge defines your technical or strategic advantage in the highly competitive market environment. Traders can establish multiple edges by starting with popular strategies and customizing rules to lower the risk of getting trapped with the emotional crowd.
Disclaimer Note:
V.C Cumulative Delta Volume Bars It is purely Volume, Delta, Demand & Supply imbalance and comparative analysis based tool. Before applying this Indicator to your study, you should know about Volume, Delta & Spread, Demand & Supply, and Aggressive & Passive behaviour of buyers/sellers.
Some basic understanding of Sir Richerd Wyckoff's Theory can also be helpful.
Volume DeltaVolume Delta
This indicator aims to provide users an idea for momentum and exhaustion, via differentiating between the buy delta and sell delta.
The purpose of this indicator is to give a deeper dive into the data provided by tradingviews volume indicator with greater granularity intrabar from a HTF perspective! (suitable for 30min and up but will work as low as 5m)
Below we can see an additional 2 modes,
Split:
Delta:
The difference between the 3 modes include:
Split is a separation of the initial mode "Singular" it divides the 2 into separate axis positioning to allow for a different perspective of the same data.
Delta: Takes the difference of the 2 and makes it easier for users to see which side was in control, personally delta makes it easier to see DIVS in momentum and where exhaustion is occuring.
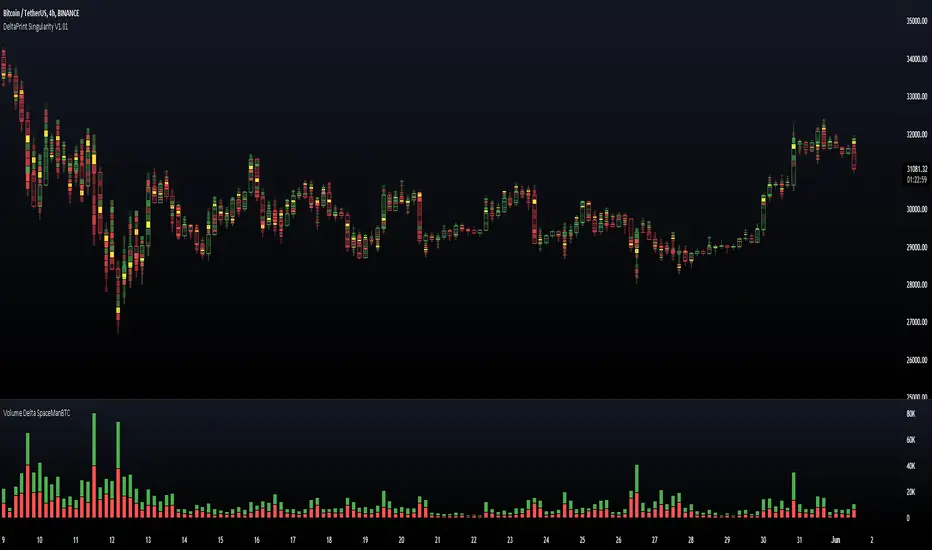
Delta Bar Stats SpaceManBTCDelta Bar Stats SpaceManBTC
This is a supplementary tool to DeltaPrint Candles SpaceManBTC, Hence why its inclusion in the chart above. Orderflow traders have access to the bar statistics in a seperate,
container to the candles themselves. This aims to tackle that disparity by providing a solution to tradingview.
Using a calculation that is found in the DeltaPrint Candles SpaceManBTC the data reflected as you can see is the same in the TVOL and DVOL
parameters matching the Total Volume and Delta Volume parameters.
The tool Delta Bar Stats SpaceManBTC also provides access to extra information, Delta Price, Buy Volume, Sell volume.
The Delta price highlighting the DVPOC (delta volume point of control) and the 2 following
refrencing the total buy volume and sell volume in the candle respectively.
Additionally you can see on load 2 settings:
Dynamic Coloring Delta Volume,
changes color based on whether the Total Delta for the candle was positive or negative.
Dynamic Coloring Delta Price,
changes color based on whether price closed above or below the DeltaVPOC
Ticksize is used to determine the amount of data generated, the lower the more information will be provided on the current candle. Using AutoTickSize will do this automatically accounting for recent volatility .
Therefore when using and new, use auto, to switch between charts with ease. On charts that you always keep open it is recommended to manually tune ticksize to your choosing.

Delta Profile SpaceManBTCDelta Profile SpaceManBTC
Delta Profile SpaceManBTC, provides 2 very useful functions to tradingview traders with increased statistic for their candles in which case they can use to add confluence to their trading style.
Profile Types:
There are 2 main modes as it stands:
Delta Profile: Comes with the ability to show where buyers and sellers are stepping in more aggressively at which points to show a representation of trapped traders easier and aggression in the market.
Volume Profile: Can be used to do the same but in a more pure volume form, as well as allows for an ease in detecting a momentum shift.
Statistic Types: works with all modes
Ask/Bid Ask bid gives you the pure representation of that data showing at which points buyers stepped in and seller stepped in, no additional calculation on top.
Delta Delta shows the difference between, ie delta, for the ask and bid so its easier to view the difference at loss of the exact values used.
Volume Volume, shows the pure volumetric values no explanation of who buyers and sellers are allowing for a clean view of what is happening in the market with no code functionality applied.
The statistics are not isolated to their desired profile type as this provides the ability to use the volume profile type and delta values and vice versa, allowing users to choose which UI representation they want but which data.
This allows users to get both parts of the picture at any one time!
Using the tick data provided i am able to accurately caclulate the information, however this means for historical data there is none until the script is run for a period of time without stopping.
The tool is a method of providing flow data to the tradingview community, it can allow for good confluences at key levels of interaction E.G., key swing points/S/R points is when its accuracy for trading shines and can give you a good understanding of whats
happening at that time in the market.
Highly recommend dialing the ticksize manually. this provides greater consistency, auto ticksize was made for entry level users to quickly get a feel of the indicator but manually tuning to get the data you require without too much noise is very useful.
TO DO:
Sessions: accounting for Asia,Europe and North America
Tick based candles. e.g number of ticks before a new candle is generated.

DeltaPrint Candles SpacemanBTCDeltaPrint Candles SpacemanBTC
This is a tool that ive made that will be very useful to all types of traders. Orderflow based or price action based by providing a means to deliver both on tradingview.
Using a calculation of time volume and ticks, the display is created with a bid and ask for display functionality to show the influence of players in the market.
The tool will be a useful way to determine the levels of which a point is interacted with by the number of traders participating at that level.
This will help determine with a statistical representation in numerical form, the number of buyers and sellers being stopped out or trapped at any level specifically key support and resistance areas.
Ticksize is used to determine the amount of data generated, the lower the more information will be provided on the current candle. Using AutoTickSize will do this automatically accounting for recent volatility.
Therefore when using and new, use auto, to switch between charts with ease. On charts that you always keep open it is recommended to manually tune ticksize to your choosing.
To generate the data the candle is show on the left of the footprint in normal candle stick form but then displays the statistical values to the side to show relative participation.
The logic is to provide a better method to show the importance of potential levels, regularly works really well on swing highs and lows/liquidity sweeps.
The indicator also has the ability to show only the delta if that is your preference, the above is to show the full capabilities of generating data.
TO DO:
One more display type, similar to the delta ladder.
Increased Look back period with stacks.
