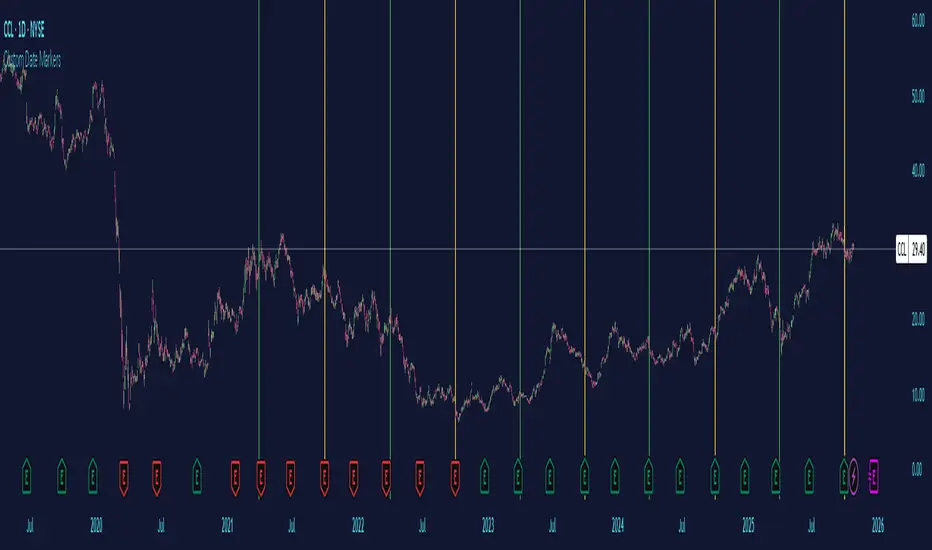
Custom Date MarkersCustom Date Markers - Pine Script Indicator
This indicator provides a powerful visual tool for technical and pattern analysis by allowing traders to mark up to 10 specific historical dates with customizable vertical lines on any chart. Each date can be assigned its own unique color, making it easy to categorize and distinguish between different types of events or market catalysts.
Primary Use Cases:
The indicator excels at identifying cyclical patterns and recurring market behavior. By marking significant dates such as earnings announcements, Federal Reserve meetings, dividend ex-dates, or seasonal events, traders can quickly visualize whether stocks consistently react in similar ways around these recurring dates. This is particularly valuable for discovering hidden patterns that might not be obvious from price action alone.
Practical Applications:
Earnings Analysis: Mark historical earnings dates to see if a stock tends to rally or sell-off before/after announcements
Macro Events: Identify how assets respond to FOMC meetings, CPI releases, or other economic data
Seasonal Patterns: Track dates that show recurring volatility or directional moves (like tax deadline periods, end-of-quarter re balancing, etc.)
Event Studies: Analyze the impact of company-specific events like product launches, FDA approvals, or leadership changes
Advanced Insights:
What makes this tool particularly interesting is its ability to reveal non-obvious correlations. For example, you might discover that a retail stock consistently experiences volume spikes 2-3 weeks before Black Friday across multiple years, or that certain tech stocks show weakness during specific conference dates. The color-coding feature allows you to layer multiple event types simultaneously—perhaps using red for bearish catalysts and green for bullish ones—creating a visual heat map of historical market reactions.
The indicator's 6-month default spacing (covering 4.5 years) is strategically designed to capture multiple business cycles while maintaining clarity on the chart. This timeframe is long enough to identify genuine patterns rather than coincidences, yet focused enough to remain relevant to current market conditions.
Pro Tip: Combine this indicator with volume analysis or other technical indicators to validate whether the patterns you observe are accompanied by meaningful market participation or if they're statistical noise.
Dates
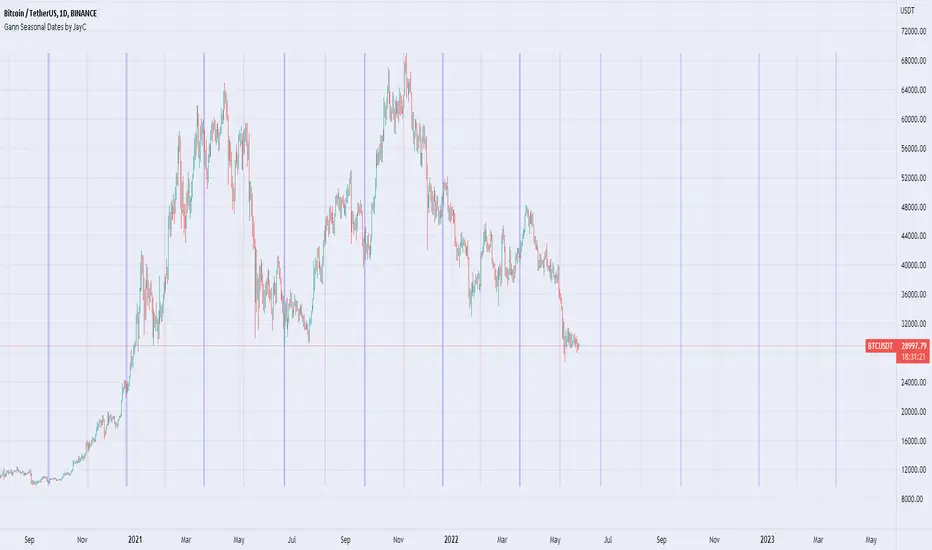
INTELLECT_city - US Presidential Elections Dates (USA)(EN)
It is interesting to compare Halvings Cycles and Presidential elections.
This indicator shows all presidential elections in the USA from the period 2008, and future ones to the date 2044. The indicator will automatically show all future dates of presidential elections.
--
To apply it to your chart it is very easy:
Select:
1) Exchange: BITSTAMP
2) Pair BTC \ USD (Without "T" at the end)
3) Timeframe 1 day
4) In the Browser, switch the chart to Logarithmic (on the right bottom, click the "L" button)
or on mobile, switch to "Logarithmic" we look on the chart: "Gear" - and switch to "Logarithmic"
------------------
(RU)
Интересно сопоставить Циклы Halvings и Президентские выборы.
Данный индикатор показывает все президентские выборы в США с периода 2008 года, и будущие к дате 2044 года. Индикатор будет автоматически показывать все будущие даты .
--
Что бы применить у себя на графике это очень легко:
Выберите:
1) Биржа: BITSTAMP
2) Пара BTC \ USD (Без "T" в конце)
3) Timeframe 1 дневной
4) В Браузере переключить график на Логарифмический (с право внизу кнопка "Л")
или на мобильно переключить на "Логарифмический" ищем на графике: "Шестеренку" — и переключаем на "Логарифмический"
-------------------
(DE)
Es ist interessant, die Halbierungszyklen und die Präsidentschaftswahlen zu vergleichen.
Dieser Indikator zeigt alle US-Präsidentschaftswahlen seit 2008 und zukünftige bis zum Datum 2044. Der Indikator zeigt automatisch alle zukünftigen Präsidentschaftswahltermine an.
--
Es ist sehr einfach, dies auf Ihr Diagramm anzuwenden:
Wählen:
1) Austausch: BITSTAMP
2) Paar BTC \ USD (Ohne das „T“ am Ende)
3) Zeitrahmen 1 Tag
4) Schalten Sie im Browser das Diagramm auf Logarithmisch um (die Schaltfläche „L“ unten rechts).
oder auf dem Mobilgerät auf „Logarithmisch“ umschalten, in der Grafik nach „Getriebe“ suchen – und auf „Logarithmisch“ umschalten

ATR+ Advanced Sessions ATR for DaterangeATR+ Advanced Sessions ATR for Daterange
The ATR+ adds the following additional filters to the stock ATR indicator by Tradingview:
- Calculates the overall average ATR for a user defined daterange, optionally filtered by trading session and selected weekdays, presented as a secondary line over the standard ATR line.
- Basic ATR line, with colour highlight to indicate the selected sessions, days and timeframe being calculated by the average ATR+ line.
- Average ATR+ line indicating the average of all ATRs within the defined timeframe, optionally filtered by instances of a selected trading session and selected weekdays.
- Customisable appearance.
- The ATR+ also includes the basic ATR configuration options typically found in the standard ATR by Tradingview, including period length and smoothing type. Defaults are set to the factory standards: 14 length, RMA smoothing type.
What Is the Average True Range (ATR)?
The ATR is a technical analysis tool that measures market volatility by decomposing the entire range asset price for that period. Investopedia describes the ATR as follows:
"The average true range (ATR) is a technical analysis indicator, introduced by market technician J. Welles Wilder Jr. in his book New Concepts in Technical Trading Systems, that measures market volatility by decomposing the entire range of an asset price for that period.
The true range indicator is taken as the greatest of the following: current high less the current low; the absolute value of the current high less the previous close; and the absolute value of the current low less the previous close. The ATR is then a moving average, generally using 14 days, of the true ranges."
For more information on the ATR and its calculations and use cases, see here:
Investopedia link here.
Tradingview link here.
Note
The indicator may time out if the number of bars being calculated is too long. If this happens, you will need to reduce the datetime range, or increase the chart timeframe in order to reduce the number of bars being calculated and the indicator will attempt to recalculate.

Historical Crypto Conference DatesJust a basic list date script to display various conference dates from the crypto sector. Updates to add more conferences.
Red - BTC Miami
Blue - Consensus

Gann Seasonal Dates by JayCThis script marks important seasonal dates with a vertical line that Gann used to watch for Trend changes.
March 21st
June 22nd
September 23rd
December 22nd
And 50% Levels - Minor seasonal dates.
February 4th
May 6th
August 8th
November 7th
In the settings you can change line colors and toggle the Offset. Offset is the way the script draws lines to show future dates, I offset by 365 so it will show incorrectly at some points in back testing.
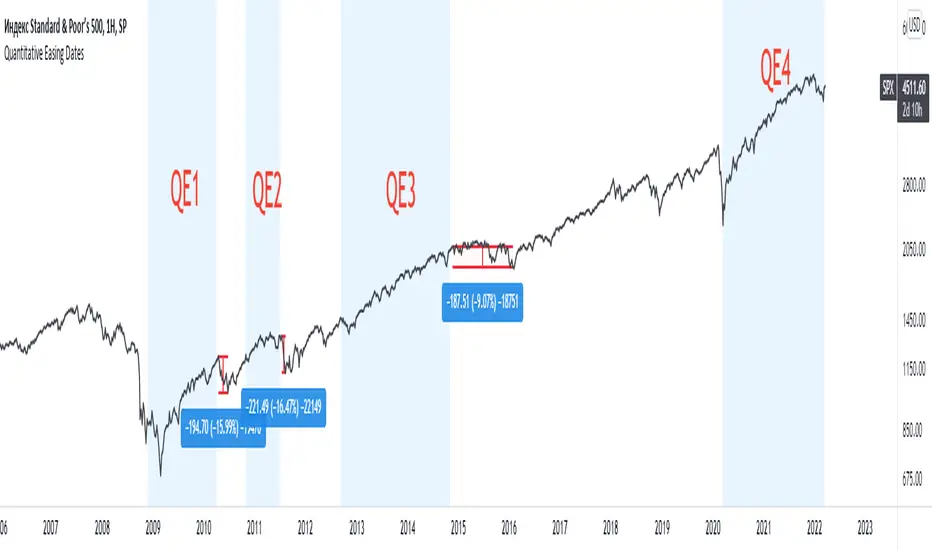
Quantitative Easing DatesThis indicator shows the beginning and the end of quantitative easing policy.
Specific Date Series (llnylk's)Show specific dates/bars (useful for Ichimoku cloud)
Show where are -9th bar, -20th bar, -26th bar, -52th bars in the past

Major Event Price Indicators (Coronavirus Lows)This very simple script adds a corridor for two low price ranges, where Corona started to hit. Useful to visualize where a stock currently trades at, relative to the Corona / Covid-19 crisis.
Can easily be adjusted for different dates regarding any major events, crashes. Useful when you run out of Alarms and just want to see "is that still below or above where it was before ?".
Add as many dates as you want, just alter the names of each indicator.
Built upon the script of vitvlkv.
