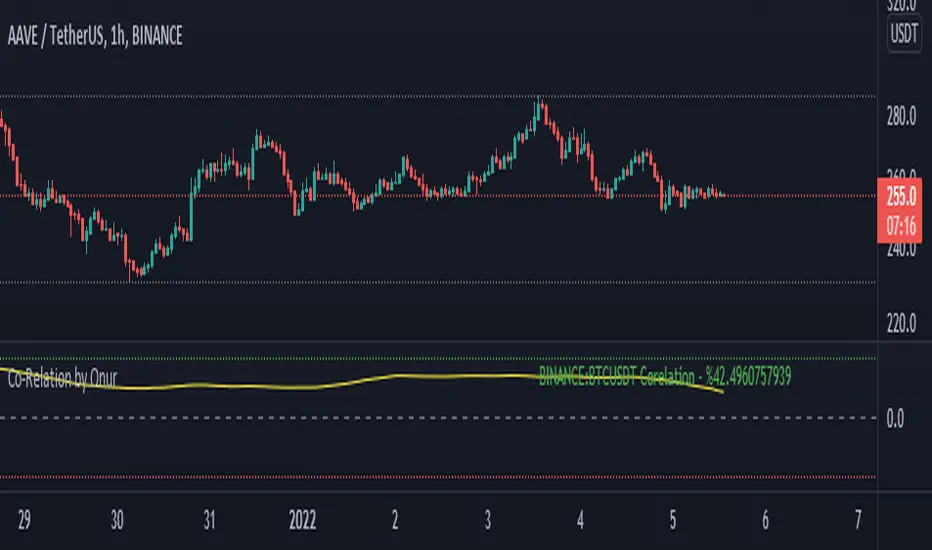
Co-Relation by OnurThis indicator can statistically compare ANY asset in Tradingview with the asset in the active chart. It helps to understand positive or negative corelation btw 2 assets with percentage. Indicator value oscillates btw +100 and -100. If value is close to +100, there is a positive co-relation and if value is close to -100, there is a negative co-relation.
Indicator has 2 variables:
Symbol: The symbol (BTCUSDT by Default) that you'd like to compare with chart.
Period: Is the number of backward candles (200 by Default) for indicator co-relation calculation.
You can increase Period value to understand a long term relationship btw 2 assets.
Indicador Pine Script®