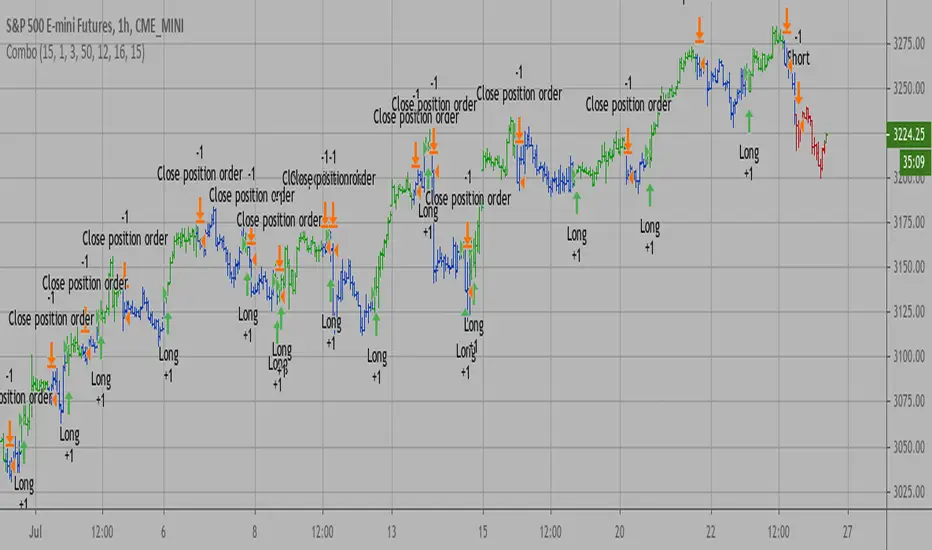
Combo Backtest 123 Reversal & Ergodic MACD This is combo strategies for get a cumulative signal.
First strategy
This System was created from the Book "How I Tripled My Money In The
Futures Market" by Ulf Jensen, Page 183. This is reverse type of strategies.
The strategy buys at market, if close price is higher than the previous close
during 2 days and the meaning of 9-days Stochastic Slow Oscillator is lower than 50.
The strategy sells at market, if close price is lower than the previous close price
during 2 days and the meaning of 9-days Stochastic Fast Oscillator is higher than 50.
Second strategy
This is one of the techniques described by William Blau in his book
"Momentum, Direction and Divergence" (1995). If you like to learn more,
we advise you to read this book. His book focuses on three key aspects
of trading: momentum, direction and divergence. Blau, who was an electrical
engineer before becoming a trader, thoroughly examines the relationship
between price and momentum in step-by-step examples. From this grounding,
he then looks at the deficiencies in other oscillators and introduces some
innovative techniques, including a fresh twist on Stochastics. On directional
issues, he analyzes the intricacies of ADX and offers a unique approach to help
define trending and non-trending periods.
Blau`s indicator is like usual MACD, but it plots opposite of meaningof
stndard MACD indicator.
WARNING:
- For purpose educate only
- This script to change bars colors.
Osciladores centrados
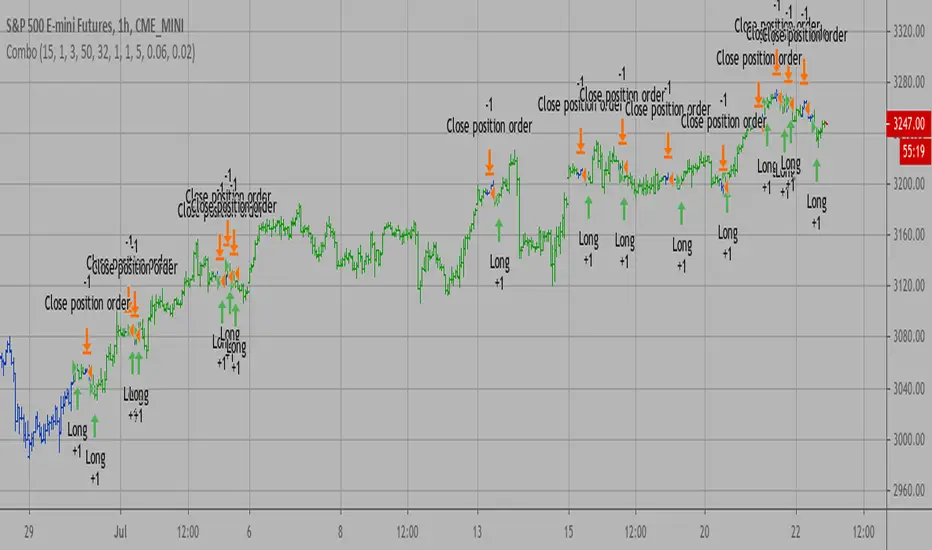
Combo Backtest 123 Reversal & Ergodic CSI This is combo strategies for get a cumulative signal.
First strategy
This System was created from the Book "How I Tripled My Money In The
Futures Market" by Ulf Jensen, Page 183. This is reverse type of strategies.
The strategy buys at market, if close price is higher than the previous close
during 2 days and the meaning of 9-days Stochastic Slow Oscillator is lower than 50.
The strategy sells at market, if close price is lower than the previous close price
during 2 days and the meaning of 9-days Stochastic Fast Oscillator is higher than 50.
Second strategy
This is one of the techniques described by William Blau in his book
"Momentum, Direction and Divergence" (1995). If you like to learn more,
we advise you to read this book. His book focuses on three key aspects
of trading: momentum, direction and divergence. Blau, who was an electrical
engineer before becoming a trader, thoroughly examines the relationship between
price and momentum in step-by-step examples. From this grounding, he then looks
at the deficiencies in other oscillators and introduces some innovative techniques,
including a fresh twist on Stochastics. On directional issues, he analyzes the
intricacies of ADX and offers a unique approach to help define trending and
non-trending periods.
This indicator plots Ergotic CSI and smoothed Ergotic CSI to filter out noise.
WARNING:
- For purpose educate only
- This script to change bars colors.
RSPRO StrategyStrategy for RSPRO indicator
Based on resistance/support and bollinger band fluctuations this indicator also has filter with x bars after RSI overbought/oversell zones from settings.
There are two types of entries and signals: early (usually before trend changes) and main (when trend started to reverse)
Fits for BTC and any altcoins. And any assets. Good for both scalping and position trading (depends on timeframe that you use)
Best use it with big timeframes: 45 and 90min, 2 and 4 hours for position trading.
For scalping 5-30min timeframes are good too.
In Script settings you can specify:
1) RSI period, 14 by default.
2) Show early entries (squares), enabled by defaults.
3) Show main entries (triangles), enabled by defaults.
4) Enable/Disable filter to show main entries only after RSI overbought/oversell regions
Disabled by defaults and RSI is 67 for upper zone and 33 for lower zone.
You can also specify how many bars back before current bar this filter must do. It's 10 by default, you can vary it up to 90.
+With customisable start/end date, take profit and stop-loss.
This is invite only script. PM me if you want to test it.
Trading Technicals Strategy V1This strategy was developed in order to optimize 'bull' and 'bear' entry and exit signals based on a set of relatively basic but unique parameters, consisting of Exponential Moving Averages, candlestick formation, as well as data from the common RSI and MACD indicators.
Revisions should be expected as my goal with this strategy is to collect data by manipulating the existing entry and exit conditions in order to find the most successful results. I would like to optimize this strategy for a certain time period as well, as there are varying degrees of results between, say, the 5m chart and the 1h chart. I hope to revise this script when I have what I believe to be significantly improved results, and I would also consider the idea of publishing multiple strategies based on the code that works best for each time frame (V1 may work best for the 30m period, a future V2 may be best suited for the 45m period, etc.)
As of publishing this script, two significant points to note are:
1. There are no overnight holds - all positions are exited before market close
2. While you may see several instances in one day's time of the 'bull' signal rising, then returning to zero, a bullish position will not exit at zero, only - the position will remain active until a 'bear' position is signaled, at which point the 'bull' position will be closed and a 'bear' position will open. The same is true in the opposite scenario.
These points are of course subject to change throughout the optimization process. Lastly, my goal is not to look for the strategy that only yields the most profit, but the one that provides the most consistency in achieving those profits.

Ehlers Bandpass FilterThis script uses @cheatcountry script to determine Ehlers Bandpass Filter.
Backtest offers 3 capital management tools. One that will always calculate order size as initial capital/close, one that uses the same calculation but adds or substracts profit. The last one allows you to enter manually the size you want to trade.
The time-based stop will close the position after a set number of bars.

Psychological strategy v2I made a change to the psychological line I made before.
The 4-hour and the 1-hour line are shown with the psychological.
Strategy
If the 4-hour psychological is above red line( 70 per cent) and the 1-hour psychological is lower than the previous hour's psychological, go short.
The opposite is true for longs.
you can change the number 70 above on the parameter page
以前に作ったサイコロジカルラインに変化を加えてみました。
4時間足と1時間足の2つをサイコロジカルを表示しています。
戦略
4時間足のサイコロジカルが赤い線(70パーライン)を超えており、かつ1時間足が前の1時間のサイコロジカルより下がっていればショートで。
ロングは逆に青いラインを下回っており、かつ一時間が上がっていればエントリーとしています。
スクリプトのアレンジ等、コメントいただければアレンジさせていただきます。

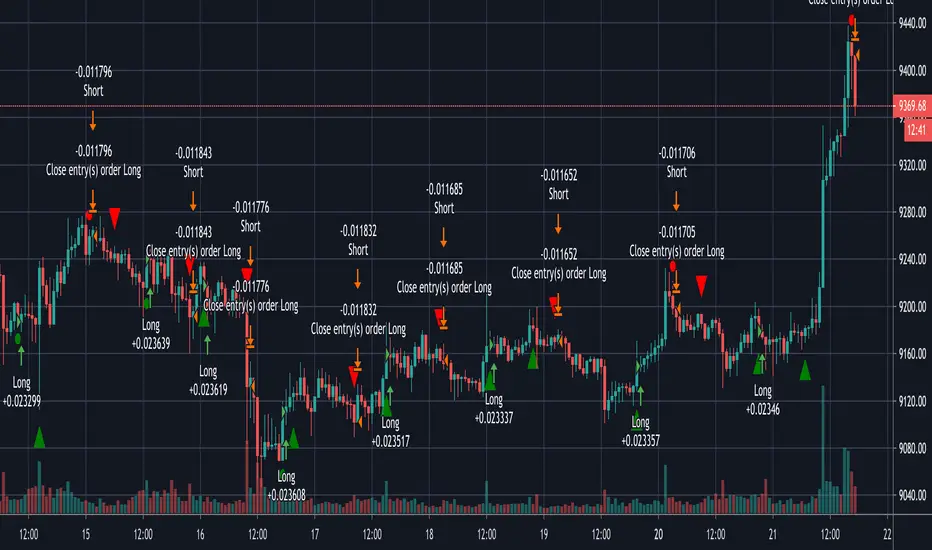
Kenan's Deluxe Combo Indicator Scalper Version StrategyThis is a combo strategy of sorts. I've been able to come up with this strategy after a lot of research.
Under Normal circumstances, when people look at dozens of indicators and they all signal, they open positions. So I decided to save people the trouble and put the major indicators together in a strategy.
All of the classic cross strategies usually give a lot of signal. Some of these signals are unnecessary and incorrect signals. Combining leading indicators. I tried to avoid the faulty signals.
Indicators and oscillators included in this strategy are:
1. Ema 5/13/21
2. Macd
3. Macd Dema
4. Ichimoku
5. Dmi
6. Stochastic
7. Aroon
8. Bollinger Band
9. Rsi
10. Chande Momentum Oscillator
11. Exponential Ease of Movement ( Eom )
12. Klinger Oscillator
13. Stochastic RSI
14. Ultimate Oscillator
15. Woodies CCI
16. Rate Of Change Lenght( Roc ) oscillator
17. WaveTrend Oscillator . It was created by @fskrypt.
18. Ehlers Adaptive CG Indicator . It was created by @LazyBear
19. Insync Index. It was created by @LazyBear
This script works by listening to the indicators and oscillators above. Opens new position after receiving signal verification signal from all
So how does this strategy close your position (optional).
1. You can close the position with the trailing stop option.
2. You can close the position according to the Rsi limits. To give an example. After a long position is opened, you can close the position after the rsi has risen above 70.
3. You can close the position according to the Bollinger Band . After a position is opened, you can close the position after the price moves out of the bollinger Band .
You can also change the values of indicators as desired. If you get better results. I would appreciate it if you could contact me via comment or private message.
I set the commission rate at 0.075 percent. If you want, you can change the settings yourself and make backtest.I changed the default settings for some indicators.

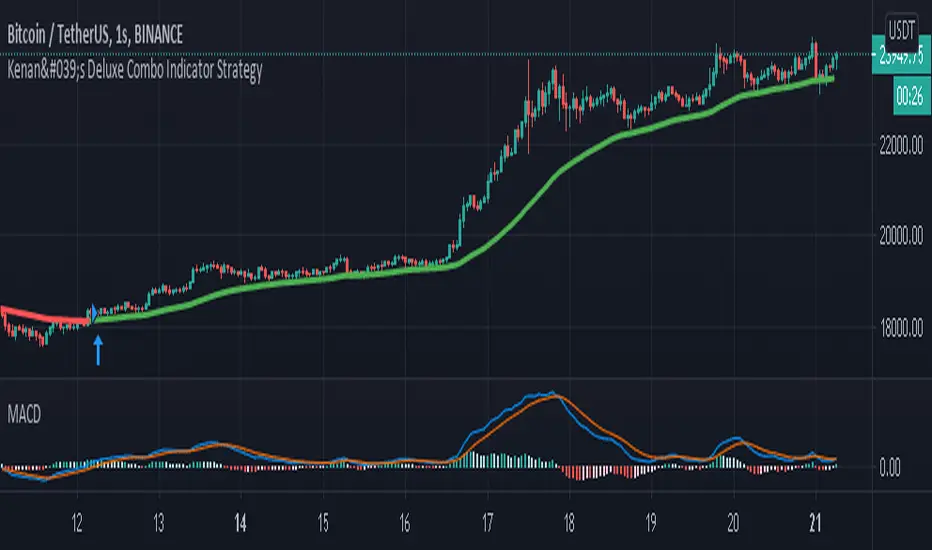
Kenan's Deluxe Combo Indicator StrategyThis is a combo strategy of sorts. I've been able to come up with this strategy after a lot of research.
Under Normal circumstances, when people look at dozens of indicators and they all signal, they open positions. So I decided to save people the trouble and put the major indicators together in a strategy.
All of the classic cross strategies usually give a lot of signal. Some of these signals are unnecessary and incorrect signals. Combining leading indicators. I tried to avoid the faulty signals.
Indicators and oscillators included in this strategy are:
1. Ema 5/13/21
2. Macd
3. Macd Dema
4. Ichimoku
5. Dmi
6. Stochastic
7. Aroon
8. Bollinger Band
9. Rsi
10. Chande Momentum Oscillator
11. Exponential Ease of Movement ( Eom )
12. Klinger Oscillator
13. Stochastic RSI
14. Ultimate Oscillator
15. Woodies CCI
16. Rate Of Change Lenght( Roc ) oscillator
17. WaveTrend Oscillator . It was created by @fskrypt.
18. Ehlers Adaptive CG Indicator . It was created by @LazyBear
19. Insync Index. It was created by @LazyBear
This script works by listening to the indicators and oscillators above. Opens new position after receiving signal verification signal from all
So how does this strategy close your position (optional).
1. You can close the position with the trailing stop option.
2. You can close the position according to the Rsi limits. To give an example. After a long position is opened, you can close the position after the rsi has risen above 70.
3. You can close the position according to the Bollinger Band . After a position is opened, you can close the position after the price moves out of the bollinger Band .
You can also change the values of indicators as desired. If you get better results. I would appreciate it if you could contact me via comment or private message.
I set the commission rate at 0.075 percent. If you want, you can change the settings yourself and make backtest.I changed the default settings for some indicators.
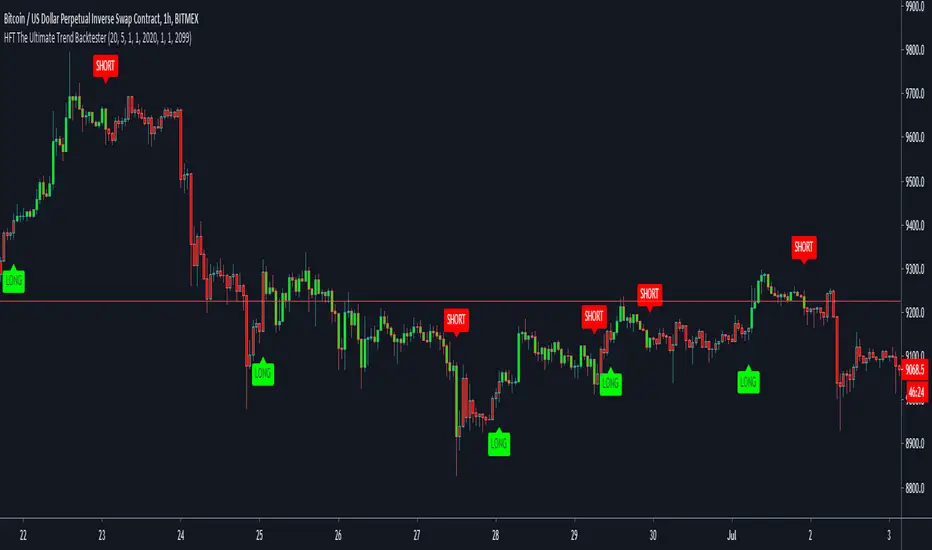
HFT The Ultimate Trend BacktesterThis is a trend following based strategy developed by HFT Research.
It works on Stocks, Forex and Cryptocurrency markets
This indicator comes fine tuned out of the box. It works on best on 15min, 1 hour and 4 hour time frames. It provides 3 separate entries for each of the time frames, providing you 12 different entry options.
Each time frame has the following options to choose from
You can use 1 hour settings on 15min chart however, it may not work the best.
Moderate entry will give you the modest amount of trades with modest amount of risk
Aggressive entry will give you wild entries and lots of action, if you are willing to babysit the trades, it might be an option for you
Conservative entry are best for those who want to automate the strategy or for those that don't have the time to trade the alerts actively
The backtester assumes the following;
- 1000$ capital
- 0.06% commission based on binance
- 1% risk meaning 100% equity on cross leverage
- Backtest results are starting from 2020
DUOT STRATEGYDescription:
Duot Strategy utilizes the MDMA Oscillator to detect divergences of the price line from a set of normalized differential oscillators
The oscillator uses the average of all the oscillators used by the Duot Oscillators Indicator , the oscillators are then normalized and then triple smoothed using a variant of McGuinly formula.
Default settings are optimized for BTCUSD 1D
Settings:
- Date Selectors
- Oscillators Lookback: applies to all oscillators
- Normalize Lookback
- Duot Oscillator Lookback
- Duot Oscillator MA1 Slow, Fast Len
- Duot Oscillator MA2 Slow, Fast Len
- Duot Oscillator MA1 Type:
- Duot Oscillator MA2 Type:
- MA1, MA2, MA3 Lookback length, for (short, long) decision.
- Toggle, Long Only, Short Only, Long & Short
- Confirmation Signal Level 1, 2, 3

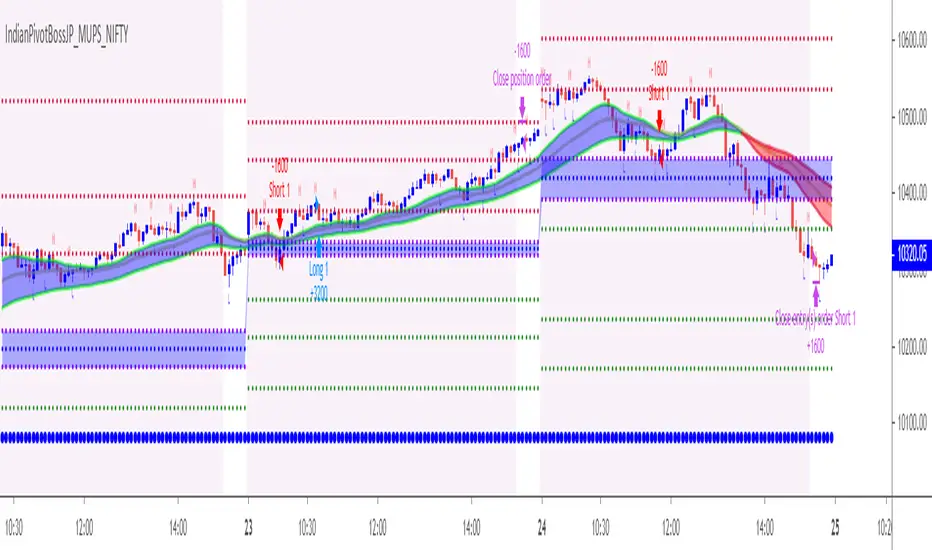
IndianPivotBossJP_MUPS_NIFTYThis is the JP_MUPS Strategy for NIFTY similar to BankNifty which is already there in JP_MUPS.
The best way to enter this strategy is as follows:
Option A :
Direct entry after signal with a stop .
Option B :
Have a Stochastic 14 / 5 / 5.
Once a short signal comes, wait for the Stochastic 14/5/5 to go to the OverBot zone above 70 and enter short after a crossunder, provided that during this period the long signal do not come.
Once a long signal comes, wait for the Stochastic 14/5/5 to go to the Oversold zone below 30 and enter long after a crossover, provided that during this period the short signal do not come.
This method will ensure that your entry is fine tuned.
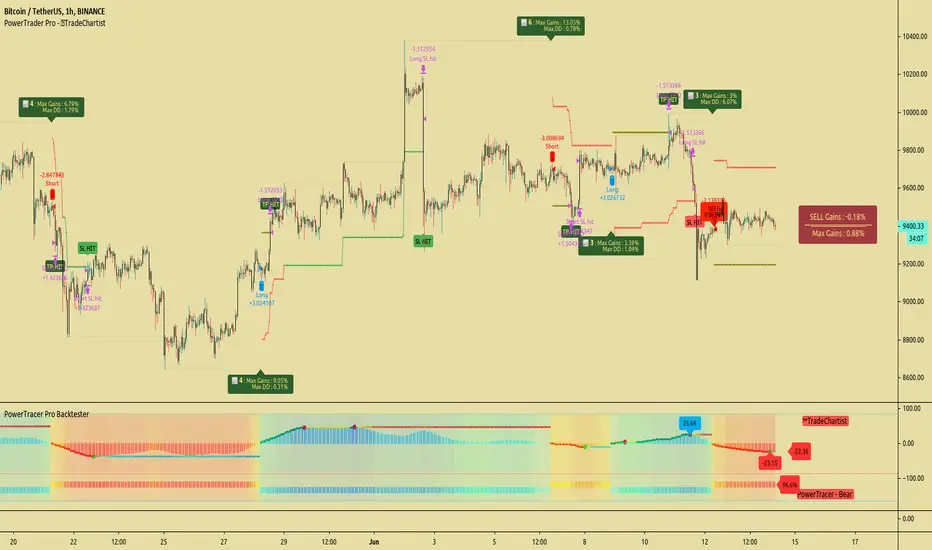
TradeChartist PowerTracer Pro Backtester™TradeChartist PowerTracer Pro Backtester is the strategy script for backtesting ™TradeChartist PowerTracer Pro for best performance settings which can then be used with ™TradeChartist PowerTrader Pro to plot Trades emulating the backtester and use Alerts (once per bar) on real time price chart.
PowerTracer Backtester includes the following options in the settings.
PowerTracer setting - Power Plot Type - (PowerTracer, Bar-wise Power Holder)
PowerTracer setting - Timeframe Multiplier
PowerTracer setting - Smoothing Factor
Backtester setting - Trade Direction - (Both Longs and Shorts, Only Longs, Only Shorts)
Backtester setting - SL Type (Fixed Stop Loss, Trailing Stop Loss)
Backtester setting - Reference for Trailing SL (Close, High/Low)
Backtester setting - Stop Loss %
Backtester setting - Take Profit %
Backtester setting - Quantity to trade at TP %
Using combinations of the settings, the user can find optimal settings for the asset to deliver lucrative entry and exit signals with high ROI and minimal Drawdown which can then be used on PowerTracer Pro and PowerTrader Pro to plot signals and create alerts to start trading in real-time.
Example charts:
GBP-USD 1hr chart - (2,1,Trailing SL, close, 1,1,25)
BTC-USDT 15m chart - (4,5, Trailing SL, high/low, 3.9,1.2,15)
SPX 1hr chart - (1,3, Trailing SL, high/low, 3, 2, 50)
This backtester needs the following scripts to generate signals and plots on main price chart and for real-time alerts
™TradeChartist PowerTracer Pro
™TradeChartist PowerTrader Pro
===================================================================================================================
This is not a free to use indicator. Get in touch with me (PM me directly if you would like trial access to test the indicator)
Premium Scripts - Trial access and Information
Trial access offered on all Premium scripts.
PM me directly to request trial access to the scripts or for more information.
===================================================================================================================
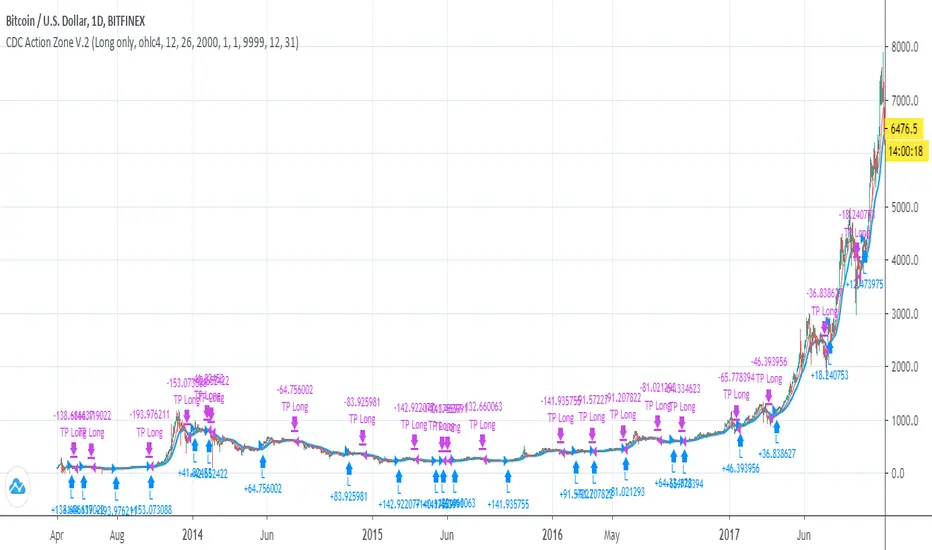
CDC Action Zone V.2 Strategy BacktestPublished for backtest purpose
All credit to : CDC Action Zone V.2 by piriya33
จัดทำขึ้นเพื่อการดูผล Backtest เขียวซื้อแดงขาย
ตัวสคริปท์มีการเพิ่ม
- Strategy Long/Short/Both // ปรับได้ใน Setting
- Back test range // ปรับได้ใน Setting
3. AutoBots Trading - BACKTEST: MACDBACKTEST: Moving Average Convergence Divergence - MACD
1. Description: a trend-following momentum indicator that shows the relationship between two moving averages of a security’s price. The MACD is calculated by subtracting the 26-period Exponential Moving Average ( EMA ) from the 12-period EMA .
2. Strategy rules: defined based on the component, signal count, entry prices, open order count, position check, position averages, conditional closes and close signals.
3. Risk management: system was defined based on the choice of only long, only short or both sides. Defining the choice of take profit, stop loss and trailing stos (no repaint).
4. Symbol: PETR4 (only)
5. Suggested Timeframe: 2H
6. Parameter for optimization: 12, 8, 9, side: long, tp: 3%, sl: 1%, ts: na
7. Walk forward simulation
7.1. In sample period: jan/2018-jan/2020
7.2. Out of sample period: jan/2020 - ago/2020
** For purpose educate only

MACD Trend Following Strategy How it work ?
Work like normal MACD because this is MACD without any modify but i add color of candlestick and strategy.
The color meaning :
Green= macd > signal and macd>0 (Buy)
Red= macd < signal and macd<0 (Sell)
Yellow= macd > signal and macd<0 (Maybe reversal point)
Blue= macd < signal and macd>0 (Maybe reversal point)
Feature
- Back test range
- Long/Short option
- Modifiable MACD Setting

TSI CCI Hull with profit$$$This is a modified version of @SeaSide420 TSI CCI Hull with profits exit on long and short order
ORIGINAL SCRIPT:
/// /// feel free to edit/improve and comment

MACD Bull Crossover and RSI Oversold 5 Candles Ago-Long StrategyHello everyone, I've been having a great time perfecting this strategy for a few weeks now. I finally feel like it's time to release it to the public and share what I have been working on.
This strategy only enters a long trade when the MACD crosses over the signal line and the RSI was oversold looking back 5 candles ago. The logic behind this is to wait for RSI to enter the oversold territory, and then when the market starts to recovery the MACD will crossover telling us the sell off is over.
This strategy will close once these 2 conditions are met.
1. MACD Histogram is above 0 and MACD crosses under the signal line.
2. RSI was overbought 5 previous candles ago.
In the strategies settings, you'll be able to enable visual stop-loss and profit levels and change those levels to what you like, enable up to 5 EMA'S,
ADDONS That Affect Strategy:
* Enable visual stop-loss and profit levels as soon as a buy signal is triggered.
* Modify stop-loss and profit levels.
* Modify RSI oversold and RSI overbought levels.
* Modify MACD Fast and Slow moving average.
ADDONS That Do Not Affect Strategy:
* Enable up to 5 EMA's. (This will not affect strategy, and is the only purpose is for people who like following EMA's.)
Thank you for taking the time to try my strategy. I hope you have the best success. I will be making a short strategy, and alerts for this strategy soon. Follow me for updates!


Combing in MACD and MTFHi all, I'm trying to wedge in the MACD into a multiple timeframe. Scope is to create:
1) an alert when the MACD across all timeframes is positive,
2) an alert when the MACD across all timeframes is negative, and
3) one when neither of them is applicable.
Would anyone be so kind to give it some thoughts, please?
//@version=2
strategy(" Easy MTF Strategy", overlay=false)
TF_1_time = input("3", "Timeframe 1")
TF_2_time = input("5", "Timeframe 2")
TF_3_time = input("15", "Timeframe 3")
TF_4_time = input("30", "Timeframe 4")
fastLen = input(title="Fast Length", type=integer, defval=12)
slowLen = input(title="Slow Length", type=integer, defval=26)
sigLen = input(title="Signal Length", type=integer, defval=9)
= macd(close, fastLen, slowLen, sigLen)
width = 5
upcolor = green
downcolor = red
neutralcolor = blue
linestyle = line
TF_1 = security(tickerid, TF_1_time, open) < security(tickerid, TF_1_time, close) ? true:false
TF_1_color = TF_1 ? upcolor:downcolor
TF_2 = security(tickerid, TF_2_time, open) < security(tickerid, TF_2_time, close) ? true:false
TF_2_color = TF_2 ? upcolor:downcolor
TF_3 = security(tickerid, TF_3_time, open) < security(tickerid, TF_3_time, close) ? true:false
TF_3_color = TF_3 ? upcolor:downcolor
TF_4 = security(tickerid, TF_4_time, open) < security(tickerid, TF_4_time, close) ? true:false
TF_4_color = TF_4 ? upcolor:downcolor
TF_global = TF_1 and TF_2 and TF_3 and TF_4
TF_global_bear = TF_1 == false and TF_2 == false and TF_3 == false and TF_4 == false
TF_global_color = TF_global ? green : TF_global_bear ? red : white
TF_trigger_width = TF_global ? 6 : width
plot(1, style=linestyle, linewidth=width, color=TF_1_color)
plot(5, style=linestyle, linewidth=width, color=TF_2_color)
plot(10, style=linestyle, linewidth=width, color=TF_3_color)
plot(15, style=linestyle, linewidth=width, color=TF_4_color)
plot(25, style=linestyle, linewidth=4, color=TF_global_color)
exitCondition_Long = TF_global_bear
exitCondition_Short = TF_global
longCondition = TF_global
if (longCondition)
strategy.entry("MTF_Long", strategy.long)
shortCondition = TF_global_bear
if (shortCondition)
strategy.entry("MTF_Short", strategy.short)
strategy.close("MTF_Long", when=exitCondition_Long)
strategy.close("MTF_Short", when=exitCondition_Short)

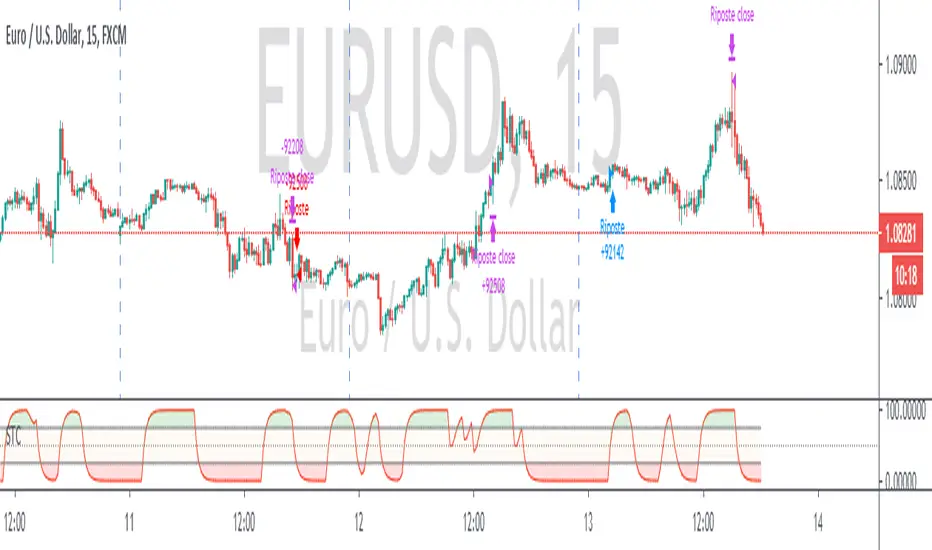
Schaff Trend Cycle + Double MAThis strategy uses two different moving averages to determine a trend. It opens a position on a pullback from a trend.
Conditions for buy signal are:
►Crossover out of Shaff Trend Cycle's extreme levels
►The price is above its short period exponential moving average.
►A short period exponential moving average is above a long period exponential moving average.
*Conditions for sell are the opposite.
All in all, I don't think it needs to be on your chart but it can be optimized and even successful on some timeframes.
Shaff Trend Cycle solution was provided by @everget, I converted his script to Pine v.4, added exponential averages and created an algorithm for backtesting.
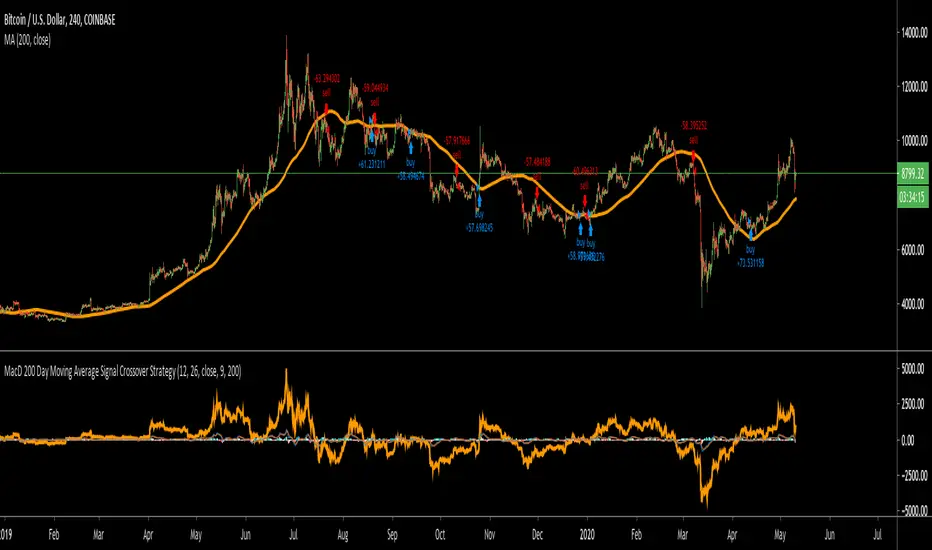
MacD 200 Day Moving Average Signal Crossover StrategyThis works on most time frames, but I noticed the 4 hour for BTCUSD on coinbase seems to work well as an example. The strategy is pretty simple. I was inspired by a youtube video that said to backtest their strategy so I did. Most of the time it doesn't work but sometimes it's pretty good as in the case I showed.
Basically, you buy if the MacD crossers over the signal line and the histogram is below 0 and you are above the 200 day moving average. Do the opposite to sell!
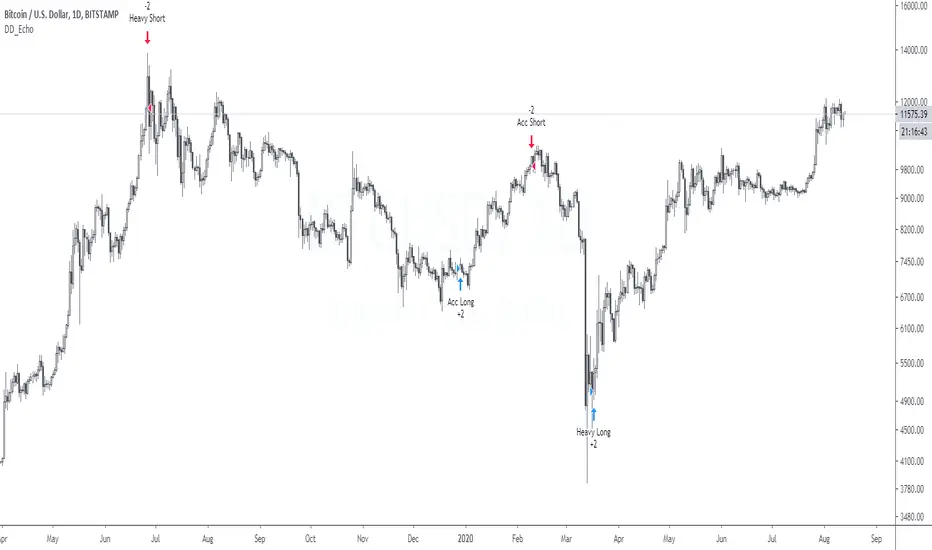
DD_EchoDD_Echo is a buy/sell trading strategy based on sentiment analysis such as fear and greed, Bitmex premium and quantity theory of money.
The performance metrics are as follows:
Net Profit: 412%
Sharpe Ratio: 1.27
Profit Ratio: 2.55
Hit Rate: 100%
If you want to access this, please DM me.
CCI Investment strategyAn investment strategy that identifies investment opportunities when momentum is in favour on the upside and exits when momentum is increasing on the downside.
Applicable to all stocks across all markets.
Timeframe: Weekly
What is missing here is a pyramiding strategy to make the winners really big. Do not risk more than 1% of your capital on a single stock based on this strategy.
