WaveTrend RBF What it does
WT-RBF extracts a “wave” of momentum by subtracting a fast Gaussian-weighted smoother from a slow one, then robust-normalizes that wave with a median/MAD proxy to produce a z-score (z). A short EMA of z forms the signal line. Optional dynamic thresholds use the MAD of z itself so overbought/oversold levels adapt to volatility regimes.
How it’s built:
Radial (Gaussian) smoothers
Causal, exponentially-decaying weights over the last radius bars using σ (sigma) to control spread.
fast = rbf_smooth(src, fastR, fastSig)
slow = rbf_smooth(src, slowR, slowSig)
wave = fast − slow (band-pass)
Robust normalization
A two-stage EMA approximates the median; MAD is estimated from EMA of absolute deviations and scaled by 1.4826 to be stdev-comparable.
z = (wave − center) / MAD
Thresholds
Dynamic OB/OS: ±2.5 × MAD(z) (or fixed levels when disabled)
Reading the indicator
Bull Cross: z crosses above sig → momentum turning up.
Bear Cross: z crosses below sig → momentum turning down.
Exits / Bias flips: zero-line crosses (below 0 → exit long bias; above 0 → exit short bias).
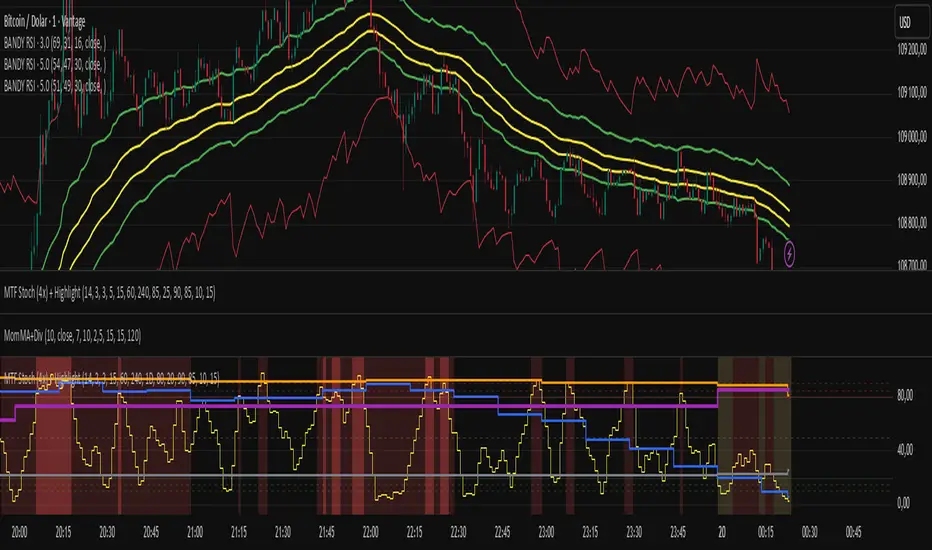
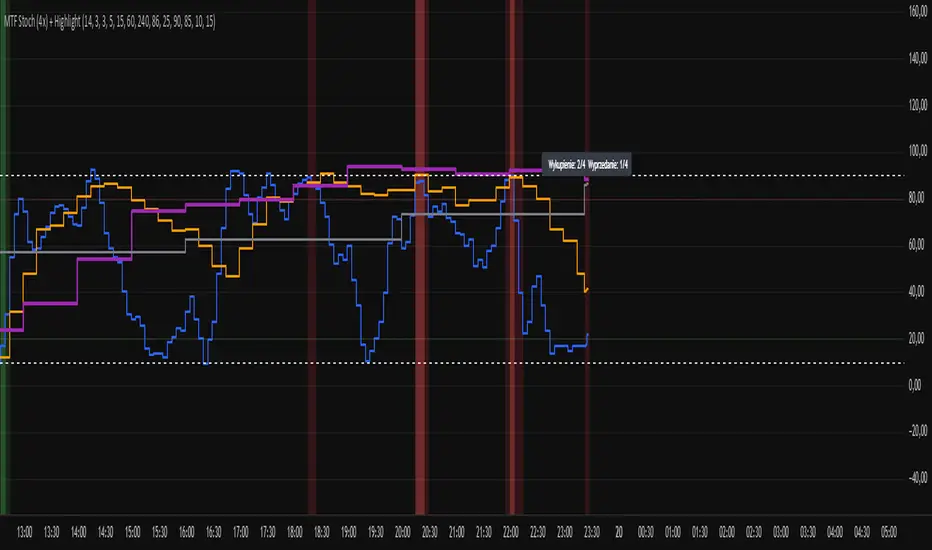
Overbought/Oversold: z > +thrOB or z < thrOS. With dynamics on, the bands widen/narrow with recent noise; with dynamics off, static guides at ±2 / ±2.5 are shown.
Core Inputs
Source: Price series to analyze.
Fast Radius / Fast Sigma (defaults 6 / 2.5): Shorter radius/smaller σ = snappier, higher-freq.
Slow Radius / Slow Sigma (defaults 14 / 5.0): Larger radius/σ = smoother, lower-freq baseline.
Normalization
Robust Z-Score Window (default 200): Lookback for median/MAD proxy (stability vs responsiveness).
Small ε for MAD: Floor to avoid division by zero.
Signal & Thresholds
Dynamic Thresholds (MAD-based) (on by default): Adaptive OB/OS; toggle off to use fixed guides.
Visuals
Shade OB/OS Regions: Background highlights when z is beyond thresholds.
Show Zero Line: Midline reference.
(“Plot Cross Markers” input is present for future use.)
Indicador Pine Script®