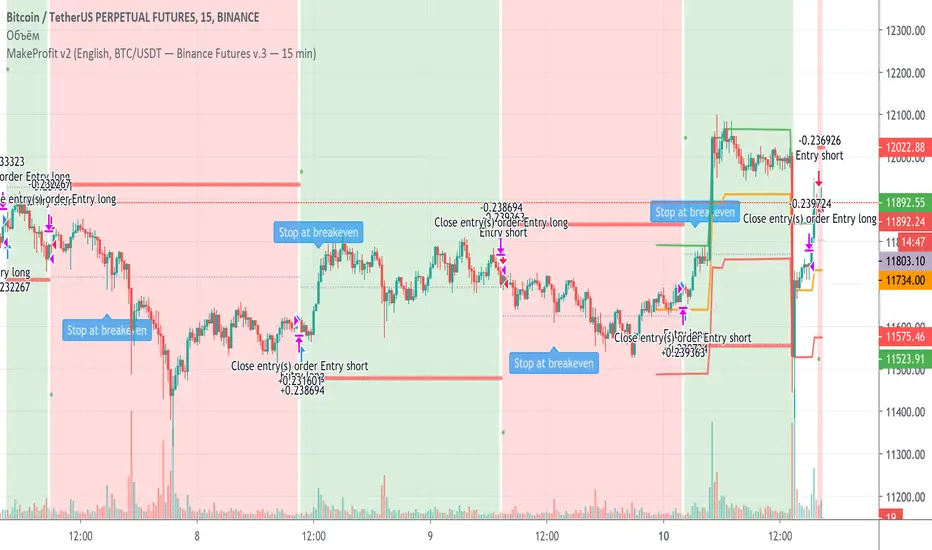
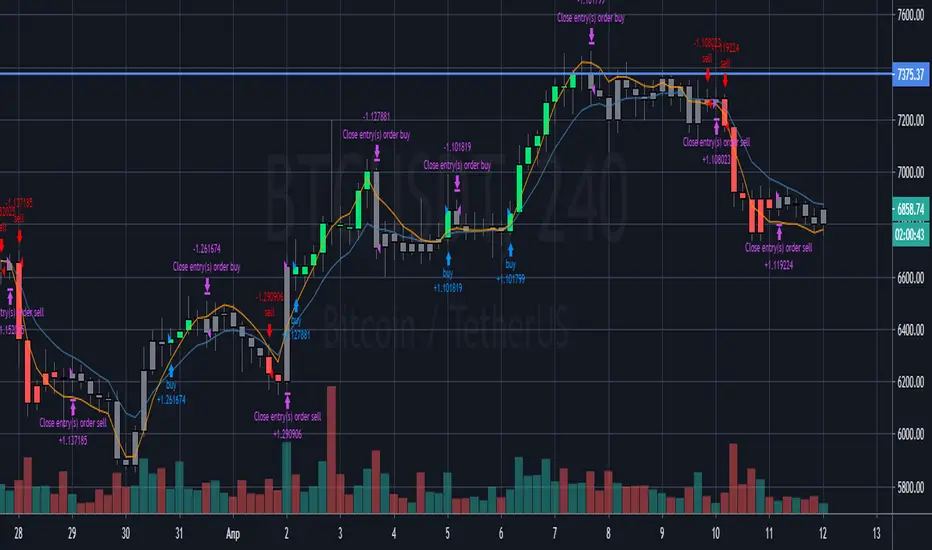
MakeProfit v2The Make Profit Club team has developed a new generation indicator that allows you to choose certain strategies calculated by us at a distance and simply enter a position based on our signals with our algorithms
Each partner who is trying to make money on the stock exchange shall from part of trust not only to us but to your head before you start earning.
We added the most popular strategies for Bitcoin and altcoins to the indicator, but we also didn't forget about currencies like EUR/USD and EUR/USD/RUB.
The indicator additionally works with scalpel levels, which you can buy back (as well as trade in the specified scalpel corridor).
Not only scalping strategies are included, but also trend trading. Let's say that the 45-minute strategy on bitcoin gave almost 700% of the profit for 45 weeks (1-4 hours and 1 day are also available).
For the most unintelligent, we have added entry levels, exit levels, levels where you can enter a trade if you do not have time for the signal, and many other features that you will not find anywhere else.
We will constantly add new strategies and improve our own.
You can get test access by contacting me.
Команда Make Profit Club разработала индикатор нового поколения, позволяющий выбрать определенные стратегии, просчитанные нами на дистанции и просто входить в позицию по нашим сигналам с нашими алгоритмами
Каждый партнер, который пытается заработать на бирже должен от части довериться не только нам, но и своей голове, прежде чем начать зарабатывать.
В индикатор мы добавили самые ходовые стратегии для Bitcoin и altcoins, но и не забыли про валюты по типу EUR/USD and EUR/USD/RUB.
Индикатор дополнительно работает со скальповыми уровнями, по которым вы сможете докупаться (а также торговать в указанном скальповом коридоре).
Включены не только скальповые стратегии, но и торговля по тренду. Допустим, стратегия по 45 минут на биткоине дала почти 700% прибыли за 45 недель (доступны еще и 1-4 часа, и 1 день).
Для самых несообразительных мы добавили уровни входа, уровни выхода, уровни, где можно зайти в сделку, если не успели по сигналу и еще очень много других функций, которых вы нигде не найдете.
Обратившись ко мне, вы можете получить тестовый доступ.
BTCUSD
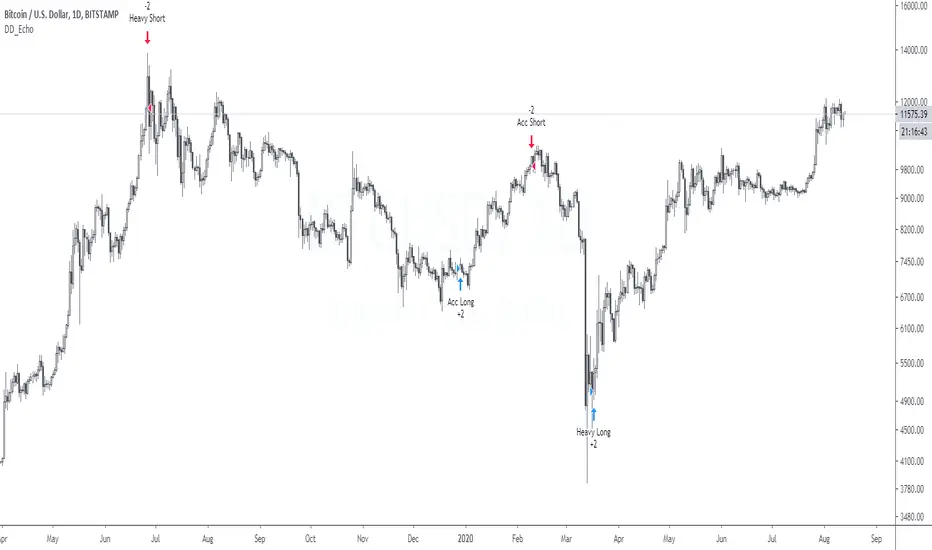
DD_EchoDD_Echo is a buy/sell trading strategy based on sentiment analysis such as fear and greed, Bitmex premium and quantity theory of money.
The performance metrics are as follows:
Net Profit: 412%
Sharpe Ratio: 1.27
Profit Ratio: 2.55
Hit Rate: 100%
If you want to access this, please DM me.
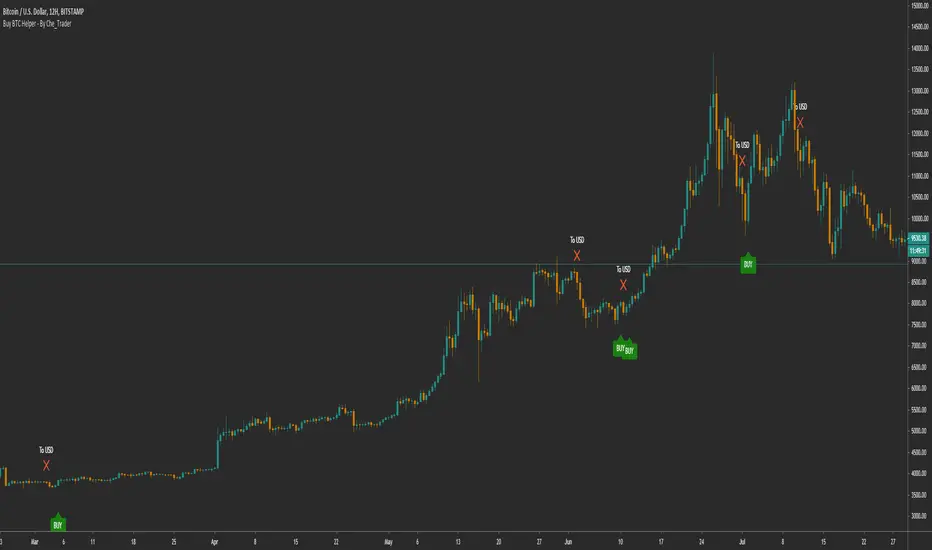
Buy BTC Helper - Buy SPOT, sell to USD (BTC-ETH) - By Che_TraderBuy BTC Helper - Buy SPOT, sell to USD (BTC-ETH) - By Che_Trader
The Buy Helper is specially designed for users who want to invest in BTC in the long term.
Usually you will make about 20-25 trades per year in spot trading.
You do not need a margin account or understand anything about trading.
Just follow the "BUY" and "To usd" signals to make sure you are on trend when BTC goes up but also take profit when BTC starts going down.
This simple tool has beaten the HOLD in all the years tested, also in bull trend or bear trend.
We'll develop this better.
*****************************************************************************************************************************************************************************
General stats from 2017 to 2020 are in the bottom, These are:
(**All data include 0.15% fees+slippage what is more than double the normal fees**)
- 8462% Gains (compound)
- 72 transactions
- 3.238 Profit Factor
- 18.58% Max drawdown
*****************************************************************************************************************************************************************************
The year-by-year analysis is very interesting:
*****************************************************************************************************************************************************************************
2017 HOLD result
+1254%
Buy helper 2017 results:
- +1214.5 % Gains
- 19 transactions
- 11% max drawdown
The 2017 profits are very similar, so you can expect similar win in next bull run.
This is something you'd expect, but it's hard to get in a bot.
*****************************************************************************************************************************************************************************
*****************************************************************************************************************************************************************************
2018 Hold Result
-71%
Buy helper 2018 results:
- +59% Gains
- 21 transactions
- 13.53% max drawdown
These results are particularly impressive. In a year in which BTC declined 72% and with a strategy of only LONG,
that is, without being able to take profit from the crashes,
we were able to finish the year with more than 59% of the money we made on the 2017 bull run.
*****************************************************************************************************************************************************************************
*****************************************************************************************************************************************************************************
2019 Hold Result
+94%
Buy helper 2019 results:
- +202% Gains
- 20 transactions
- 10.4% max drawdown
In 2019 with the buy helper you gained +100% the performance of hold BTC
*****************************************************************************************************************************************************************************
*****************************************************************************************************************************************************************************
2020 Hold Result (up to 04 may 2020)
+24.5%
Buy helper 2020 results:
- +39% Gains
- 11 transactions
- 15.43% max drawdown
In 2020 with the buy helper you gained +50% the performance of hold BTC
*****************************************************************************************************************************************************************************
*****************************************************************************************************************************************************************************
To get access, you can send me a PM here or at a link in the tradingview profile.
*****************************************************************************************************************************************************************************
inwCoin Martingale Strategy ( for Bitcoin )** Same as my previous martingale script but this version = opensource **
inwCoin Martingale Strategy is the proof of concept strategy that in the end, anyone who using martingale strategy will kaboom their portfolio.
For those who don't know what is "martingale".. it's a simple double down strategy in the hope to cover the loss in previous entry.
Example
In the game that if you win, you'll get 100% of your bet money back.
1st loss = 1$
2nd loss = bet 2$ : if win, get 2$ / real profit = 1$ ( 2-1 )
3rd loss = bet 4$ : if win, get 4$ / real profit = 1$ ( 4 - ( 2+1) )
4th loss = bet 8$ : if win, get 8$ / real profit = 1$ ( 8 - ( 4+2+1 ) )
...
...
10th loss = bet 512$ : if win, get 512$ / real profit = 1$ ( 512 - ( 256+128+64+32+16+8+4+2+1) )
as you can see, the next bet will be first bet x 2^(n-1)
and the profit will equal to your first bet.
==================
In trading and forex EA ( Expert Advisor or bot ) people use this strategy to fool newbies that their martingale system will generate steady income for eternity.
But in reality, this strategy will destroy your whole portfolio eventually some time in the future. Because there will be some "Blackswan event" in market at some point in time. And one who ignore this fact, will lose everything.
But, if you using low risk strategy and generate some profit from your low-risk portfolio. You can take small chunk of that profit and put it in riskier strategy like this martingale, to accerelate your profit snowball.
===================
Parameter Explaination
====================
Price = datasource for indicator calculation
Fixed position size option = if uncheck, the "Start position size" parameter will be % of your initial capital. If checked, it will fixed position size ( like 1 BTC )
Start Position Logic = condition to enter first trade
- MACD singal > 0 : Self explanatory, default macd value
- Stochastic RSI cross up : enter when sto line cross up from bottom ( 20 )
- ATR channel : enter trade if price cross above 2.3 ATR
Take Profit Percent = take profit target % from average entry
Start martingale ..= if price compare to average position entry less than this %, it will start to double down ( martingale )
Martingale Multiplier = you can specific how big you'll double down, default is 2
Trade Direction = long only for now
Use date rang = self explanatory
** make sure to setup your initial capital in properties tab **
On chart
=======
White Line = Average position price
Orange Line = your current equity
If equity less than 0, it will close any remaining positions ( It's mean your position got liquidated )
If price > equity line for "take profit percent" it will close any remaining positions.
=======
As you can see, this strategy survive 2018 drop and pump profit to 1000+% ( Check in the strategy tester tab > list of trades )
But in May 2020 -50% drop in just 3 days, your whole portfolio got liquidated.
Actually, after some digging in profit and backtest result.
This strategy, when it can survive a shape drop, can generate a lot of profit.
So, if you want to use martingale. Make sure to use only small chunk of your profit from "low-risk" strategy to accelerate your profit generation ( aka degen port )
DO NOT greedy and use all of your initial capital or borrowed money to use with this strategy!

Takashi Bows Autopilot | 2nd Gen | [Strategy]This is a strategy tester for Takashi Bows Autopilot indicator. Please check for more details and instructions at our website.
Takashi Bows Autopilot is the ultimate trading tool. Effortless, its signals put traders inside strong trends, locking big profits that cover all loss generated during sideways trends.
An upgrade version of Takashi Bows v1, this script is the result of some operations developed by us, it can easily adapt to different markets and time frames. Now ranging from level 1 to 20, traders can select the amount of signals to be displayed on the chart. Based on price movement, it signals entries after strong movement up or down.
Take Profit included. If a position is opened in one direction, it should be closed at take profit levels or when a position in the opposite direction is opened.
Inputs
Level
Integer input. Sets a level for signals generated up and down. The higher the level, more signals on chart, and vice-versa.
Take Profit %
Float input. Sets a percent of take profit for exiting previous open position.
Rule
Float input. Sets a ruler for more accuracy on less volatile markets. Standard value 1 for high volatile markets, higher values for low volatile markets.
Disclaimer:
Back-tests do not guarantee performance on the future. Even if a trading setup is profitable in historical data. it could be unprofitable in the future.
To get access to this and other scripts check links below.

Swingtrade strategy for volatile assets on the hourly chartThe strategy of this script is based on a setup that I used in 2016 for swingtrade on PETR4 and other IBOV actions. The intention of this script was to carry out a study to validate the effectiveness of the strategy precisely.
- This strategy works only to operate bought on the 1h (one hour) chart;
- The strategy is based on the strength of the market, which is measured according to moving averages;
- The setup uses targets of 3% above the input signal price and 11.5% stoploss for all operations;
- The stoploss is bigger than the target, this causes the hit rate to be high, but when there is a loss, the damage can be large;
- The setup performed well in some shares of the Brazilian stock market and cryptocurrencies of the dollar pair;

Gekko DEMA StrategyThis script is based upon the Gekko trading strategy.
This strategy uses Exponential Moving Average crossovers to determine the current trend the market is in. Using this information it will suggest to ride the trend. Note that this is not MACD because it just checks whether the longEMA and shortEMA are % removed from each other.
* short is the short EMA that moves closer to the real market (including noise)
* long is the long EMA that lags behind the market more but is also more resistant to noise.
* the down threshold and the up threshold tell Gekko how big the difference in the lines needs to be for it to be considered a trend. If you set these to 0 each line cross would trigger new advice.
The base strategy has had money management logic added and has been tested for best results. Once you have access, you can modify these settings to find what works best for you.
Access to this strategy is FREE! Message me for more information on how to get access.

Crypto Tipster Pro+ (Optimized for BTCUSD)===========
Crypto Tipster Pro+ Optimized for BTCUSD
===========
This script is a carbon-copy of our Crypto Tipster Pro Strategy , but also includes our Custom & Fully Optimized Settings for turbo-charging your Bitcoin (BTCUSD) trading over the last 12 months.
-----------
We keep all our Crypto Tipster Pro+ (Optimized) strategies regularly updated and maintained. The purpose of these Add-On's to our Crypto Tipster Pro Strategy is to keep each trading plan relevant, up-to-date and most of all profitable within ever-changing markets.
We will always keep our main Crypto Tipster Strategy active, as the default settings are the best "all-rounder" set-up and work with many crypto pairs over many different time frames. This Set-Up for Bitcoin enables you to hone in on one certain trading pair on the D chart and maximize your overall net profit.
-----------
Visit the link below for Full & Immediate Access!
Good Luck and Happy Trading!

GoldMode On (Triple compromise strategy) TF 60-240BINANCE:BTCUSDT
Greetings.
I am publishing this script in order to get feedback for further work on it.
The script combines a compromise between several classic strategies, and each of them uses modifications of classic indicators on specially selected averaging sliding indicators.
1. The script uses an ATR-based filter (it's off by default, as it's better on BTCUSD , but you can enable it in the settings if you want to use it on EURUSD , for example, or on other symbols).
2. A strategy based on crossing the moving.
3. A strategy based on determining the direction of movement of the modified slow and fast RSI .
4. A strategy based on the modified ADX +DI -DI .
The essence of the strategy in finding a compromise decision on the signals coming from each of these three strategies.
=====
Приветствую.
Данный скрипт публикую с целью получить обратную связь для дальнейшей работы над ним.
Скрипт сочетает в себе компромисс между несколькими классическими стратегиями, причём каждая из них использует модификации классических индикаторов на специальным образом подобранные усредняющие скользящие.
1. В скрипте используется фильтр на основе ATR (по умолчанию выключен, т.к. на BTCUSD так лучше, но можно включить в настройках, если хотите использовать его на EURUSD , например, или на других инструментах).
2. Стратегия основанная на пересечении скользящих.
3. Стратегия основанная на определении направления движения модифицированных медленной и быстрой RSI .
4. Стратегия основанная на модифицированном ADX +DI -DI .
Суть стратегии в поиске компромиссного принятия решения по сигналам поступающим от каждой из этих трёх стратегий.
BITCOIN-BTCUSD Trading Strategy-1This Trading Strategy is for BTCUSD which is traded on BITSTAMP exchange. The aim of this strategy is to ride the market with its ebbs and flows.
The strategy works best on 1 Hour timeframe. The results may very different depending upon time-frame and date range of your choice and different exchanges.
Parameters details:
1. Trade Trigger - You can adjust it depending upon your risk management. Default value is 20.
2. Partial Profit Points – Part profit booking points. Default value is 350.
3. Lookback Period 1 – Default is 11.
4. Lookback Period 2 – Default is 5.
The default trading quantity is 2. I have added functionality for part profit booking which increase profit and always keeps you in trade. Book 1 lot for certain points (350 points gives better results) and continue other with 1 lot till the position reversed.
I have tested this indicator on 1 Hour time-frame on BITSTAMP exchange and the time period is maximum available on Tradingview.
Period : 02/01/2019 to 30/03/2020.
Points = $ 17720.56
No. of trades = 129
% Profitable = 44.96%
Profit Factor = 2.464
Sharpe Ratio = 0.674
For free trial, send me a private message in order to access this script.
Thanks © allanster for Date Range functionality and ©LonesomeTheBlue for non-repaint concepts.
Disclaimer: This script/strategy is for educational and information purpose only. The author of this script/strategy will not accept any liability for loss or damage as a result of reliance on the information contained in the charts and buy/sell signals. Please be fully informed regarding the risks and costs associated with trading the financial markets.

inwCoin Stochastic RSI + MACD Filter StrategyinwCoin Stochastic RSI Strategy with MACD as trend filter.
Parameters Setup
===============
* everything are self-explanatory.
Entry Logic
===========
Long/Cover Short Signal :
- If SmoothK > Bottom Line and SmoothD is crossing up Bottom Line = BUY SIGNAL
- In human word : Both lines cross up bottom line from below.
- If "Use MACD as trend filter" checked, long signal will trigger if MACD > 0
Short/Close Long Signal :
- If Smooth K < Top Line and SmoothD is crossing down Top Line = SELL SIGNAL
- In human word : Both lines cross down top line from top.
- If "Use MACD as trend filter" checked, short signal will trigger if MACD < 0
How to use in real trade
===============
1) Just add to the chart and see the backtest result. Make sure to adjust commission and slippage properly.
2) Recommended to using in Daily Timeframe.
Extra
=====
Short Entry Example ( 2018-2020 )

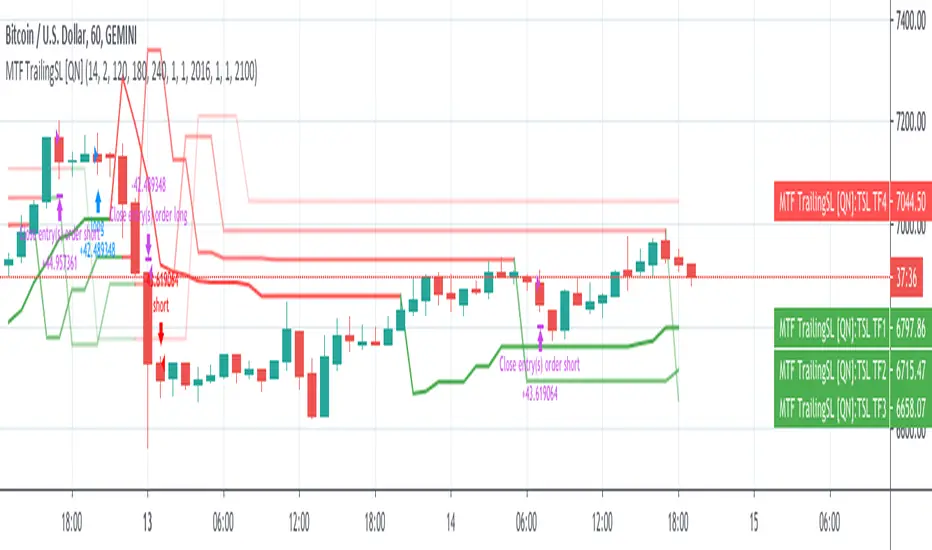
MTF Trailing SL Strategy [QuantNomad]This is a Multi-Timeframe version of my Trailing SL Strategy.
Few weeks ago I published Trailing SL Strategy. There I used only basic Trailing SL to enter positions.
It worked pretty well so I tried to work on it a bit. I thought what if you can use the same ATR TSL on different timeframes and combine them into one signal.
In this strategy you can use only ATR stops and choose 3 other higher timeframes in addition to your current timeframe.
You'll see Trailing SL plotted on the chart form all these timeframes.
Entry Long position if all 4 time-frames agree on long signal.
Exit Long positions when at least 2 time-frames disagree on long signal.
Entry to Short position if all 4 time-frames agree on Short signal.
Exit from Short positions when at least 2 time-frames disagree on Short signal.
Here is the link to my basic Trailing SL Strategy:
Super Algorithm Strategy (Joy Bangla)This is the strategy tester for the
Below are the performance results
Starting with $10,000
Net Profit: 88%
66% profitable trades
34% losing trades. Do look at the losing trades. If one did careful moment management, some of those may end up profitable as well.
4.158 Profit factor.
16.1% drawdown. I would go a bit more and say if I am using this, my risk management should ensure for a stop loss of 20%.
66 bars on average (aka it holds for a long time. So, one needs to look into the funding factor in money management)
Sharpe Ratio: 0.291
Only 7 trades done (with 6 closed) in 2 and a half years. So this absolutely reduces noise as much as possible.
In short, if I had $10000 of BTC beginning of 2018, I would be having $18,878 worth of btc right now.
With 4x leverage, this could be a huge potential.
For info on gaining access see the ⬇ link below ⬇ in our signature field & direct message me. I have a busy schedule at my own workplace. Trading is my hobby. Hence, please be kind to me if I am late in replying.

inwCoin DCA v2.0 StrategyinwCoin DCA v2.0 is the upgraded version of inwCoin DCA strategy
This strategy will show the "actual" profit/loss on the chart, since it cannot calculate by strategy result.
How to use
--------------
1) Specific "position size per entry" for each of your dca budget.
2) "Buy every N candles" is the trigger for strategy to "buy" the asset, it depend on your timeframe on chart. If you want to let it buy every 7 days, set timeframe to daily and set this value to 7.
3) Entry/Exit filter is the condition for you to continue dca buy or stop when some condition met.
3.1) Restart every N candles = the strategy will sell all of your dca position to realize profit/loss every N candles specific in "Reset at N candles" parameter.
3.2) Price above EMA = IF price above specific "Slow EMA length" value, the strategy will dca buy, else, it will sell to realize profit/loss.
3.3) Price above MA = same as 3.2 but use MA instead.
3.4) Price above WMA = same as 3.2 but use WMA instead.
3.5) MACD Above zero = will buy if MACD > 0 and sell all if MACD < 0. Set MACD value in 3 boxes below.
4) Close position at specific profit % = self explanatory
5) Close remaining position at last bar = self explanatory
6) Date = self explanatory
How to read result
================
Everything in result are self explanatory.
Have fun!

Cracking Cryptocurrency - Bottom Feeder Strategy TesterBottom Feeder - Strategy Tester
The Bottom Feeder is designed to algorithmically detect significantly oversold conditions in price that represent profitable buying opportunities. Combining this with it’s unique Stop and Target System, the Bottom Feeder is designed to return consistent return with minimal draw down. Whether used as a Market Bottom Detector or as a system for executing safe, profitable mean reversion trades, the Bottom Feeder is a powerful tool in any trader’s arsenal.
Bottom Feeder was designed to be used on BTCUSD, however it is also effective on other USD/USDT pairs. One will have to check the individual pair they wish to trade with the Strategy Tester to simulate performance.
Strategy displayed is from 2018-2021 on **Conservative Mode** with Percent of Equity (30%) enabled.
Options
Let’s go through the input options one by one, so that you are able to comfortably navigate all that this indicator has to offer. The link below will display a picture of the layout of the settings for your convenience.
For the sake of simplicity, let’s note now that all settings marked **Conservative Mode** will not work in Aggressive Mode.
Mode : Determines how aggressively Bottom Feeder generates a buy signal. In Conservative Mode, trades can only be opened once per candle and the stop and target will update as new signals appear. In Aggressive Mode, a separate trade is opened each time Bottom Feeder signals, which may be multiple times within one Daily candle.
Position Sizing Strategy : Determines what Risk Management system you will deploy when trading Bottom Feeder. Your options are “Percent of Equity” and “Distance to Stop Loss”. If Percent of Equity is selected, a trade size will be equal to a percentage of your equity, pursuant to the value in the ‘Percent of Equity’ box. If Distance to Stop Loss is selected, then your Position Size will be determined based off the distance to your stop loss and the value in the ‘Risk Percentage’ box.
Percent Of Equity : Determines what percentage of your equity will be allocated to each trade when ‘Position Sizing Strategy’ is enabled.
Risk Percentage : Determines the size of each trade if ‘Distance to Stop Loss’ strategy is enabled. This value reflects what percent of your account you will lose per trade if the trade hits your stop loss.
Plot Target and Stop Loss : Toggles on/off the visualized take profit and stop losses on the chart.
**Conservative Mode** TP Multiplier : This is an input box, it requires a float value. That is, it can accept either a whole number integer or a number with a decimal. This number will determine your Take Profit target. It will take whatever number is entered into this box and multiply the Average True Range against it to determine your Take Profit.
**Conservative Mode** SL Multiplier : See above - this will modify your Stop Loss Value.
**Conservative Mode** Average or Median True Range : This is a drop-down option, the two options are Average True Range or Median True Range. If Average True Range is selected, then this indicator will use the Average True Range calculation, that is, the average of a historical set of True Range values to determine the Average True Range value for Target and Stop Loss calculation. If Median True Range is selected, it will not take an average and will instead take the Median value of your historical look back period.
**Conservative Mode** True Range Length : This is an input that requires an integer. This will represent your historical lookback period for Average/Median True Range calculation.
**Conservative Mode** True Range Smoothing : This is a drop-down with the following options: Exponential Moving Average ( EMA ), Simple Moving Average ( SMA ), Weighted Moving Average ( WMA ), Relative Moving Average (RMA). This will determine the smoothing type for calculating the Average True Range if it is selected. Note: if Median True Range is selected above, this option will not have any effect as there is no smoothing for a Median value.
**Conservative Mode** Custom True Range Value? : This is a true/false option that is false by default. If enabled, it will override the Average/Median True Range calculation in favor of a users custom True Range value to be input below.
**Conservative Mode** Custom True Range Value : This is an input box that requires a float value. If Custom True Range is enabled this is where a user will input their desired custom True Range value for Target and Stop Loss calculation.
From Month/Day/Year to Month/Day/Year : This sets the Time Frame of your backtest for the Bottom Feeder Strategy. It will run FROM the date selected TO the date selected.
Stop and Target Description
Because Bottom Feeder is designed only to scalp the various market bottoms that can appear over time in the market and not to identify trends or to trade ranges, it’s imperative that the indicator notify us not just to when to enter our trades, but when to exit! In the service of that, CC Bottom Feeder has a built in Stop and Target system that tracks and displays the stop loss and take profit levels of each individual open trade, whether in Aggressive or Conservative Mode.
Conservative Mode Targeting: In Conservative Mode, Bottom Feeder signals are aggregated into a compound trade. The signal will appear as a green label pointing up below a candle, and will appear upon a candle close. If Bottom Feeder then generates another signal the stop loss and target price will be updated. The process will continue until the aggregated trade completes in either direction. On a trade with multiple signals, a larger position is slowly entered into upon each buy signal.
Aggressive Mode Targeting: In Aggressive Mode, Bottom Feeder signals are individually displayed as they are generated, regardless of how many signals are generated on any single candle. If Bottom Feeder continues to signal, each individual open trade will have their own stop loss and target that will be displayed on the chart until the individual trade completes in either direction. As opposed to a large compound position, aggressive mode represents a higher number of independent signals with their own stop and target levels.
Stop losses and targets are designed to be hard, not soft. That is, they are intended to be stop market orders, not mental stop losses. If price wicks through the target or stop, it will activate.

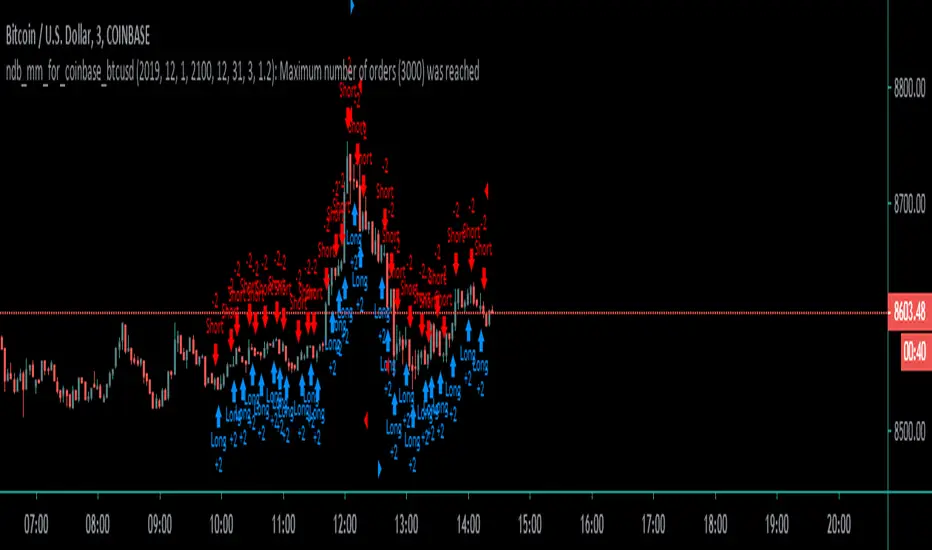
Coinbase_3-MIN_HFT-StrategyThis conceptual strategy trades against the short-term trend. The first position can be either long or short.
In the short-term, prices fluctuate up and down on wide spread exchanges.
And if the price moves to one side, the price tends to return to its original position momentarily.
This strategy set stop order. Stop price is calculated with upper and lower shadows.
Easy Loot Trailing Stop Bot - (PSAR) StrategyHello World,
Today I am bringing you a Parabolic Stop and Reverse Strategy that uses a 5% trailing stop loss.
Tested the strategy on the 1D timeframe of Bitcoin from the time period starting from 2018 onwards.
As you may know the price in the start of 2018 for Bitcoin was around $11,000 meaning if you bought and HODL'd since then you'd be down a good %, as current price is $8650.
Below is the strategy testing results, up 844% profits in the last two years.
Easy Loot Members Only, contact me if you'd like access to the strategy.
Parabolic Stop and Reverse (PSAR) Strategy
Parabolic SAR is a time and price technical analysis tool primarily used to identify points of potential stops and reverses. In fact, the SAR in Parabolic SAR stands for "Stop and Reverse". The indicator's calculations create a parabola which is located below price during a Bullish Trend and above Price during a Bearish Trend.
Trailing Stop Loss
A trailing stop-loss order is a special type of trade order where the stop-loss price is not set at a single, absolute dollar amount, but instead is set at a certain percentage or a certain dollar amount below the market price.

inwCoin Sto RSI Bullish/Bearish Divergence + Scalping StrategyStochastic RSI is well-known oscillator indicator for finding potential bottom/top within each timeframe.
Inspired by some dude from twitter that showing how his bot is working. So I tried to write this strategy to work with small timeframe.
After trial and error, I found out that if we take profit by using previous high of lookback period, we still able to make some profit with small TF.
How it work?
---------------
1) This strategy will find the STO RSI bullish or bearish divergence in 15 min timeframe, if found one, it will enter the trade long or short.
2) If price sideway and the candle since last entry is more than "Cooldown period", it will start looking for STO RSI bull/bear divergence again.
3) It will keep pyramid your entry to "max pyramid" option
4) If price close above or below previous high/low from "TP lookback period" option, it will take profit or take loss of that position.
Cautions
-----------
1) The result is good because in the pass 2 months, we enter bull trend for BTC and other crypto.. So chance that we able to close position with profit is alot higher than loss.
2) But if trend change. This scalping strategy is dangerous to use, because you will take loss down and your loss will build up every single day. ( Make sure to filter trend first )
3) I tried with bear trend with short trade, and it seem profitable. ( But you'll bankrupt if you run long scalp in downtrend, and vise versa )
Alert?
------
I also have alert version of this strategy, if you want to use, please let me know.

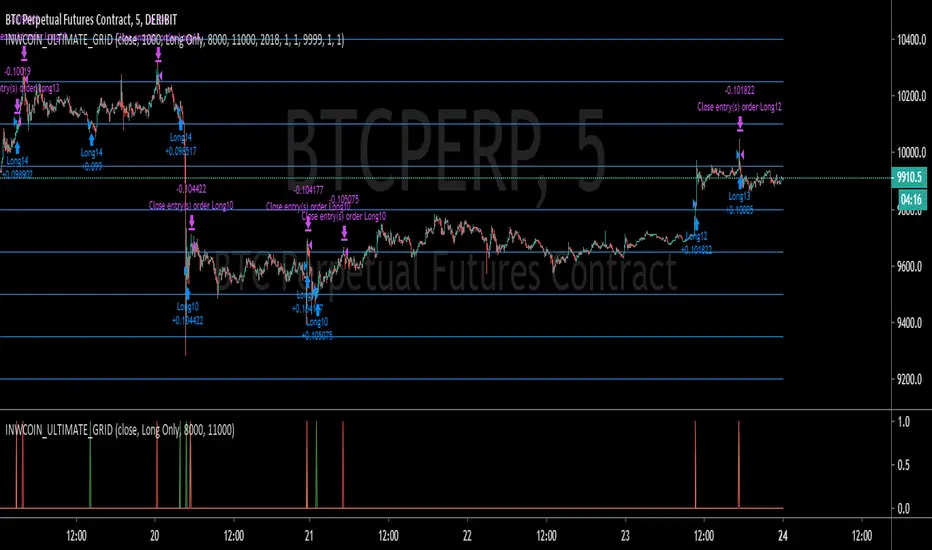
inwCoin Ultimate Grid StrategyinwCoin Ultimate Grid Strategy is the proof of concept of infamous grid trading strategy.
IDEA :
- The idea is to put the price level as a grids on the chart and when price cross up or cross down it will enter position.
- If the price move to next level it will take profit the last level and enter new position.
Caution :
- If market is trending into one direction, it's not wise to run this strategy counter trend. eg. run short grid when trend is up or run long grid when trend is down.
- So make sure you have something to define the big trend like Moving Average (18) TF weekly.
- I still can't try in range market ( sideway ) because this strategy using 5 min TF to work and tradingview don't provide data back that far.
How to use
1) Find out which start value of your asset that you want to use. Eg. BTC is 8000 for this time ( 22/2/2020 )
2) Define the spread of each grid as percent. ( eg. 2% for BTC ). You can choose small percent like 0.2% or 0.01 in asset like currency or altcoin/btc
3) The default grid level is 20 grids, so you can try and try again until you happy with the result.
4) This strategy is fix position size so it can easily calculate.
5) Don't forget to check "Properties" tab to try changing capital size and fee rate to match your criteria
6) This strategy is not perfect, it just some proof of concept to see if the strategy is working in real trade.
Extra :
If you want to access to alert for this strategy you can inbox me for detail.
1337 MoonStar H4 RVI Exit Backtest- H4 BTC/USD
simple Trendfollowing Strategy :
- based on Vwaps and Hull
- early Exit on RVI Signals
it try to catch the Trend, thats why in Consolidation it switches very often between long/short
you can switch between longonly/shortonly or both
you can define a Backtestperiod to check different marketbehaviour

MONEY WORKERThe settings are only for bitfinex exchange btcusd.
Tested against a 5 minute time interval. The settings on it are for a 5 minute time frame.
Different settings may be required for different exchanges, parities and time periods.
Note that different parities and exchanges require new settings.
In non-pro free accounts, the profit results may differ as the time frame is deleted after a certain period of time.
Please note that you have to make different settings for different parities.
If you have questions and suggestions, you can send me a private message.
Note: I cannot recommend using Heikin ashi because this misleads you. It also includes a rule violation by house rules. And MOD PineCoders hides the strategy.


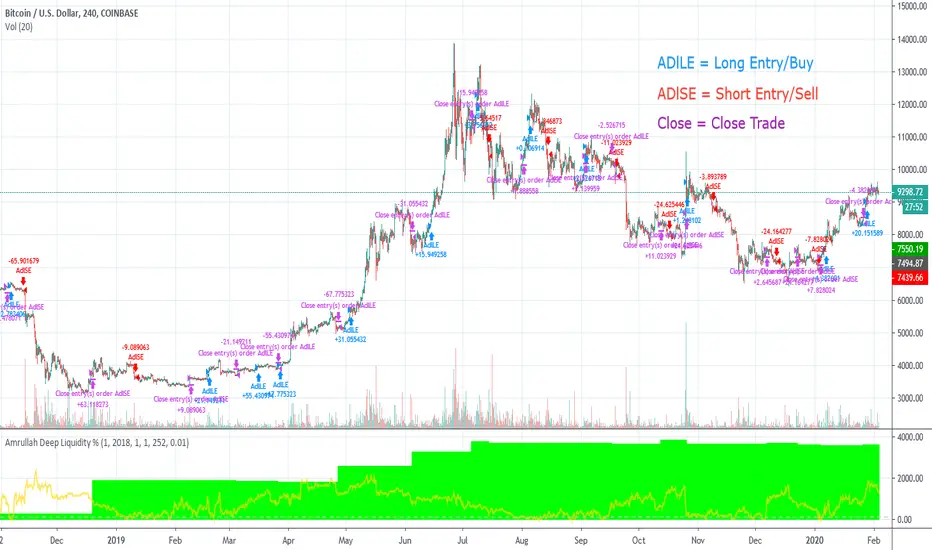
Amrullah Deep Liquidity for BTCUSDAmrullah Deep Liquidity (ADL)
Amrullah Deep Liquidity (ADL) is a high profit factor strategy based on models designed by Muhd Amrullah.
Choosing your trading pair that you are planning to backtest
Check that you have been given access to Amrullah Deep Liquidity (ADL). Select BTCUSD with the default 4H time frame. Once done, open Indicators > Invite-Only Scripts > Amrullah Deep Liquidity %.
Choosing your initial capital that you want to begin backtesting
Go to Settings > Properties > Initial Capital and type in the amount of capital you're starting with. For the BTCUSD trading pair, the initial capital is denominated in USD.
Adjusting your equity at risk until the trades match your risk profile and comfort level
Go to Inputs > Equity Risk and adjust the value you are comfortable with. To analyse performance, you also want to choose the Start Year, Start Month and Start Date. Select lower equity risk for trades that you intend to take without the use of leverage. You can select an equity risk from 0.001 to 0.05 or all the way to 1.
Finding the time frame with the highest profit factor
Profit factor is defined as the gross profit a strategy makes across a defined period of time divided by its gross loss. You may choose to scroll through other time frames to find better models. You can select a different time frame from 1 min to 1H or all the way to 1M. Once you find the model you desire, you are encouraged to check that the model has a backtested profit factor of >3.5. You can then begin looking through the Performance Summary to find other detailed statistics.
Analysing the equity curve from the Amrullah Deep Liquidity (ADL) strategy
A green equity curve indicates that the trades are accumulating profits. A red equity curve indicates that the trades are accumulating losses. A healthy equity curve is one that is green and grows steadily to the right and upward direction.
Analysing the display arrows on the chart
Amrullah Deep Liquidity (ADL) tells you when to take a trade and how much to put in a trade. ADL can do this as the model identifies inventory risk in traders and market makers in the chosen market. On your Tradingview chart, ADL will display an arrow that tells you when to enter a trade. You can also see the amount to trade beside the arrow.
Opting for a trial
Yes you may opt for a trial which has limited availability.
The author's background and experience
My career in software and deep learning development spans across more than 5 years. At work, I lead a team to solve core computer vision tasks for large companies. I continually read all kinds of computer science books and papers, and follows progress on tools used in financial markets.