NOVA Breakout Strategy v2.1 (TF M30)A clean, rules-based breakout signal tool for 30-minute charts.
It detects Dow swing breakouts and filters them with RSI, MACD and Volume so you only see the higher-quality entries. The script does not place trades and does not calculate SL/TP – it only prints clear LONG/SHORT labels at the entry price.
⸻
How it works
1. Timeframe enforcement – Signals are generated only on M30. On other timeframes the script shows a notice and stays silent.
2. Breakout engine (Dow swings) – The last confirmed swing high/low (pivots) is tracked.
• Breakout Up: bar closes above the last swing high by a small buffer.
• Breakout Down: bar closes below the last swing low by a small buffer.
3. Quality filters (all must be true):
• RSI (default length 30):
• Long: RSI > threshold and rising.
• Short: RSI < threshold and falling.
• MACD (12/26/9):
• Long: histogram > 0 and line > signal.
• Short: histogram < 0 and line < signal.
• Volume: current volume > SMA(volume, 20) × multiplier.
4. Debounce / anti-spam
• Cooldown of 4 hours (8 M30 bars) after any signal.
• Minimum price distance from the previous signal to avoid clustered labels.
5. Optional trend filter – Require EMA34 > EMA89 for Longs (and the opposite for Shorts).
Signals appear once the bar closes (barstate.isconfirmed). No swing lines are drawn to keep the chart clean; only entry labels are shown.
⸻
Inputs (key)
• RSI length & thresholds for Long/Short confirmation.
• MACD uses 12/26/9 (fixed).
• Volume multiplier (relative to SMA 20).
• Breakout buffer %, Cooldown hours, Min distance %.
• Enable EMA 34/89 trend filter (on/off).
• Show labels (on/off).
⸻
Usage tips
• Start with gold/major FX/indices on M30; use “Once per bar close” if you attach alerts.
• Increase the breakout buffer and volume multiplier in choppy markets.
• Tighten RSI thresholds (e.g., 55/45) if you want fewer but stronger signals.
⸻
Notes & limitations
• Pivots confirm after a few bars by definition; signals themselves are printed only on confirmed bar close and do not repaint once shown.
• This is a signal indicator, not investment advice. Always manage risk.
Breakout!

Magnus Bestest 2This indicator is a sophisticated version of my Magnus Bestest signature move only as this script is highly advanced and has a huge amount of lines of code and structures so I had to create a new separate indicator for it. It signals only when there is a very nice liquidity and broken pivot points, confirming a truly nice trade opportunity.
My main indicator named Magnus Bestest is still working great and has all the other signals and alerts.
DISCLAIMER: I'm not a financial adviser and this is not a financial advise, just for educational purposed. Remember, most traders lose money.

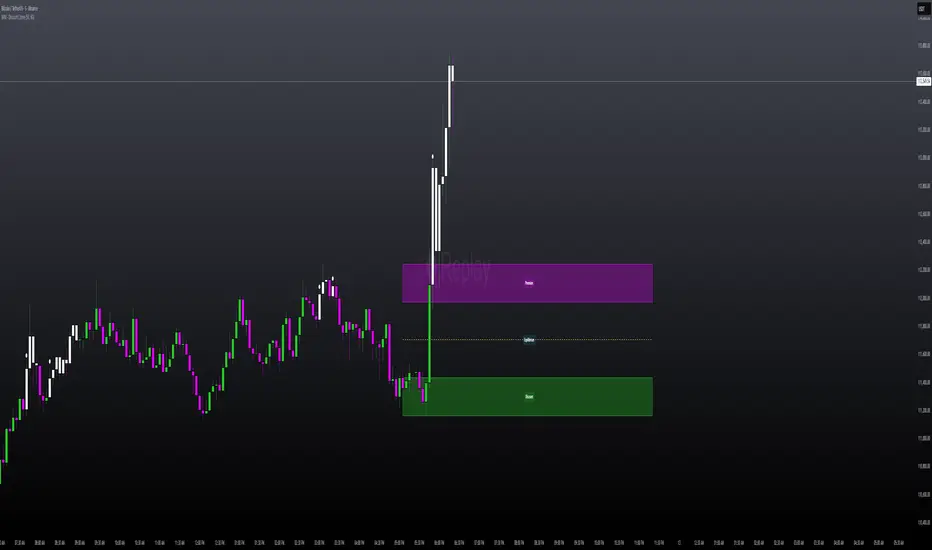
MILLION MEN - Discount Zone BreakoutsWhat it is
MILLION MEN — Discount Zone Breakouts (Lite & Stable) highlights a structure-based trading range from the latest confirmed swing high/low, renders Premium/Equilibrium/Discount zones, and raises one-shot breakout signals when price closes outside the range. It focuses on stable visuals and simple breakout logic suitable for intraday and swing trading.
How it works (high-level)
Confirmed swings: Uses ta.pivothigh/ta.pivotlow with auto or manual pivot length.
Range & zones: From the swing range, the tool derives Premium (top 25%), Equilibrium (50%), and Discount (bottom 25%).
Anchoring: Left edge is locked at the bar where the pivot confirms; the right edge can extend N bars.
One-shot breakouts:
Up breakout: first close > swingHigh (resets on new range).
Down breakout: first close < swingLow (resets on new range).
Optional on-close only mode to avoid intrabar noise.
Clean UI: Optional zone boxes, dashed equilibrium line, mid-labels (“Premium / Equilibrium / Discount”), and minimal candle coloring by regime.
How to use
Treat Discount as value area in bullish contexts and Premium as distribution area in bearish contexts.
Breakout dots (up/down) mark regime shifts beyond the current range; confirm with your higher-TF bias, volume, or momentum.
Tune pivot length and forward extension to your timeframe (e.g., smaller for scalping, larger for swings).
Originality & value
Unlike generic S/R overlays, this lite tool prioritizes confirmed swing structure with a fixed anchor, clear 25/50/75 zone mapping, and one-shot breakout logic to prevent repetitive signals until a new range forms. The emphasis is on stability + readability, making it a dependable building block in multi-indicator workflows.
Limitations & transparency
Breakouts on strong trends can retest or fail; always add confirmation (structure/volume).
Pivots confirm with delay equal to pivot length—this reduces repaint and is intentional.
Non-standard bar types are not supported for signal logic.
This indicator provides analysis, not financial advice.
Arabic
يعرض السكربت آخر مدى مؤكد من قمّة/قاع ويرسم مناطق Premium / Equilibrium / Discount، ويعطي إشارة اختراق لمرة واحدة عند إغلاق السعر فوق القمّة أو تحت القاع. الفكرة بسيطة وثابتة بصريًا، وتصلح للإنترادي والسوينغ. يُفضّل تأكيد الاختراق بهيكل أعلى إطار أو فوليوم/مومنتُم. تذكير: تأكيد القمم/القيعان متأخر بحسب طول البيفوت لتفادي إعادة الرسم.
Advanced Candle Compression BollingerColors candles based on Bollinger Band width relative to its average — showing when volatility tightens.
Orange = medium compression
Red = strong compression
Candle color appears only after several consecutive bars meet the condition.
You can adjust thresholds, colors, bar count, and the Bollinger source (default: (High+Low+Close)/3).
Useful to spot low-volatility zones that often precede breakouts.

Luxy Momentum, Trend, Bias and Breakout Indicators V7
TABLE OF CONTENTS
This is Version 7 (V7) - the latest and most optimized release. If you are using any older versions (V6, V5, V4, V3, etc.), it is highly recommended to replace them with V7.
Why This Indicator is Different
Who Should Use This
Core Components Overview
The UT Bot Trading System
Understanding the Market Bias Table
Candlestick Pattern Recognition
Visual Tools and Features
How to Use the Indicator
Performance and Optimization
FAQ
---
### CREDITS & ATTRIBUTION
This indicator implements proven trading concepts using entirely original code developed specifically for this project.
### CONCEPTUAL FOUNDATIONS
• UT Bot ATR Trailing System
- Original concept by @QuantNomad: (search "UT-Bot-Strategy"
- Our version is a complete reimplementation with significant enhancements:
- Volume-weighted momentum adjustment
- Composite stop loss from multiple S/R layers
- Multi-filter confirmation system (swing, %, 2-bar, ZLSMA)
- Full integration with multi-timeframe bias table
- Visual audit trail with freeze-on-touch
- NOTE: No code was copied - this is a complete reimplementation with enhancements.
• Standard Technical Indicators (Public Domain Formulas):
- Supertrend: ATR-based trend calculation with custom gradient fills
- MACD: Gerald Appel's formula with separation filters
- RSI: J. Welles Wilder's formula with pullback zone logic
- ADX/DMI: Custom trend strength formula inspired by Wilder's directional movement concept, reimplemented with volume weighting and efficiency metrics
- ZLSMA: Zero-lag formula enhanced with Hull MA and momentum prediction
### Custom Implementations
- Trend Strength: Inspired by Wilder's ADX concept but using volume-weighted pressure calculation and efficiency metrics (not traditional +DI/-DI smoothing)
- All code implementations are original
### ORIGINAL FEATURES (70%+ of codebase)
- Multi-Timeframe Bias Table with live updates
- Risk Management System (R-multiple TPs, freeze-on-touch)
- Opening Range Breakout tracker with session management
- Composite Stop Loss calculator using 6+ S/R layers
- Performance optimization system (caching, conditional calcs)
- VIX Fear Index integration
- Previous Day High/Low auto-detection
- Candlestick pattern recognition with interactive tooltips
- Smart label and visual management
- All UI/UX design and table architecture
### DEVELOPMENT PROCESS
**AI Assistance:** This indicator was developed over 2+ months with AI assistance (ChatGPT/Claude) used for:
- Writing Pine Script code based on design specifications
- Optimizing performance and fixing bugs
- Ensuring Pine Script v6 compliance
- Generating documentation
**Author's Role:** All trading concepts, system design, feature selection, integration logic, and strategic decisions are original work by the author. The AI was a coding tool, not the system designer.
**Transparency:** We believe in full disclosure - this project demonstrates how AI can be used as a powerful development tool while maintaining creative and strategic ownership.
---
1. WHY THIS INDICATOR IS DIFFERENT
Most traders use multiple separate indicators on their charts, leading to cluttered screens, conflicting signals, and analysis paralysis. The Suite solves this by integrating proven technical tools into a single, cohesive system.
Key Advantages:
All-in-One Design: Instead of loading 5-10 separate indicators, you get everything in one optimized script. This reduces chart clutter and improves TradingView performance.
Multi-Timeframe Bias Table: Unlike standard indicators that only show the current timeframe, the Bias Table aggregates trend signals across multiple timeframes simultaneously. See at a glance whether 1m, 5m, 15m, 1h are aligned bullish or bearish - no more switching between charts.
Smart Confirmations: The indicator doesn't just give signals - it shows you WHY. Every entry has multiple layers of confirmation (MA cross, MACD momentum, ADX strength, RSI pullback, volume, etc.) that you can toggle on/off.
Dynamic Stop Loss System: Instead of static ATR stops, the SL is calculated from multiple support/resistance layers: UT trailing line, Supertrend, VWAP, swing structure, and MA levels. This creates more intelligent, price-action-aware stops.
R-Multiple Take Profits: Built-in TP system calculates targets based on your initial risk (1R, 1.5R, 2R, 3R). Lines freeze when touched with visual checkmarks, giving you a clean audit trail of partial exits.
Educational Tooltips Everywhere: Every single input has detailed tooltips explaining what it does, typical values, and how it impacts trading. You're not guessing - you're learning as you configure.
Performance Optimized: Smart caching, conditional calculations, and modular design mean the indicator runs fast despite having 15+ features. Turn off what you don't use for even better performance.
No Repainting: All signals respect bar close. Alerts fire correctly. What you see in history is what you would have gotten in real-time.
What Makes It Unique:
Integrated UT Bot + Bias Table: No other indicator combines UT Bot's ATR trailing system with a live multi-timeframe dashboard. You get precision entries with macro trend context.
Candlestick Pattern Recognition with Interactive Tooltips: Patterns aren't just marked - hover over any emoji for a full explanation of what the pattern means and how to trade it.
Opening Range Breakout Tracker: Built-in ORB system for intraday traders with customizable session times and real-time status updates in the Bias Table.
Previous Day High/Low Auto-Detection: Automatically plots PDH/PDL on intraday charts with theme-aware colors. Updates daily without manual input.
Dynamic Row Labels in Bias Table: The table shows your actual settings (e.g., "EMA 10 > SMA 20") not generic labels. You know exactly what's being evaluated.
Modular Filter System: Instead of forcing a fixed methodology, the indicator lets you build your own strategy. Start with just UT Bot, add filters one at a time, test what works for your style.
---
2. WHO WHOULD USE THIS
Designed For:
Intermediate to Advanced Traders: You understand basic technical analysis (MAs, RSI, MACD) and want to combine multiple confirmations efficiently. This isn't a "one-click profit" system - it's a professional toolkit.
Multi-Timeframe Traders: If you trade one asset but check multiple timeframes for confirmation (e.g., enter on 5m after checking 15m and 1h alignment), the Bias Table will save you hours every week.
Trend Followers: The indicator excels at identifying and following trends using UT Bot, Supertrend, and MA systems. If you trade breakouts and pullbacks in trending markets, this is built for you.
Intraday and Swing Traders: Works equally well on 5m-1h charts (day trading) and 4h-D charts (swing trading). Scalpers can use it too with appropriate settings adjustments.
Discretionary Traders: This isn't a black-box system. You see all the components, understand the logic, and make final decisions. Perfect for traders who want tools, not automation.
Works Across All Markets:
Stocks (US, international)
Cryptocurrency (24/7 markets supported)
Forex pairs
Indices (SPY, QQQ, etc.)
Commodities
NOT Ideal For :
Complete Beginners: If you don't know what a moving average or RSI is, start with basics first. This indicator assumes foundational knowledge.
Algo Traders Seeking Black Box: This is discretionary. Signals require context and confirmation. Not suitable for blind automated execution.
Mean-Reversion Only Traders: The indicator is trend-following at its core. While VWAP bands support mean-reversion, the primary methodology is trend continuation.
---
3. CORE COMPONENTS OVERVIEW
The indicator combines these proven systems:
Trend Analysis:
Moving Averages: Four customizable MAs (Fast, Medium, Medium-Long, Long) with six types to choose from (EMA, SMA, WMA, VWMA, RMA, HMA). Mix and match for your style.
Supertrend: ATR-based trend indicator with unique gradient fill showing trend strength. One-sided ribbon visualization makes it easier to see momentum building or fading.
ZLSMA : Zero-lag linear-regression smoothed moving average. Reduces lag compared to traditional MAs while maintaining smooth curves.
Momentum & Filters:
MACD: Standard MACD with separation filter to avoid weak crossovers.
RSI: Pullback zone detection - only enter longs when RSI is in your defined "buy zone" and shorts in "sell zone".
ADX/DMI: Trend strength measurement with directional filter. Ensures you only trade when there's actual momentum.
Volume Filter: Relative volume confirmation - require above-average volume for entries.
Donchian Breakout: Optional channel breakout requirement.
Signal Systems:
UT Bot: The primary signal generator. ATR trailing stop that adapts to volatility and gives clear entry/exit points.
Base Signals: MA cross system with all the above filters applied. More conservative than UT Bot alone.
Market Bias Table: Multi-timeframe dashboard showing trend alignment across 7 timeframes plus macro bias (3-day, weekly, monthly, quarterly, VIX).
Candlestick Patterns: Six major reversal patterns auto-detected with interactive tooltips.
ORB Tracker: Opening range high/low with breakout status (intraday only).
PDH/PDL: Previous day levels plotted automatically on intraday charts.
VWAP + Bands : Session-anchored VWAP with up to three standard deviation band pairs.
---
4. THE UT BOT TRADING SYSTEM
The UT Bot is the heart of the indicator's signal generation. It's an advanced ATR trailing stop that adapts to market volatility.
Why UT Bot is Superior to Fixed Stops:
Traditional ATR stops use a fixed multiplier (e.g., "stop = entry - 2×ATR"). UT Bot is smarter:
It TRAILS the stop as price moves in your favor
It WIDENS during high volatility to avoid premature stops
It TIGHTENS during consolidation to lock in profits
It FLIPS when price breaks the trailing line, signaling reversals
Visual Elements You'll See:
Orange Trailing Line: The actual UT stop level that adapts bar-by-bar
Buy/Sell Labels: Aqua triangle (long) or orange triangle (short) when the line flips
ENTRY Line: Horizontal line at your entry price (optional, can be turned off)
Suggested Stop Loss: A composite SL calculated from multiple support/resistance layers:
- UT trailing line
- Supertrend level
- VWAP
- Swing structure (recent lows/highs)
- Long-term MA (200)
- ATR-based floor
Take Profit Lines: TP1, TP1.5, TP2, TP3 based on R-multiples. When price touches a TP, it's marked with a checkmark and the line freezes for audit trail purposes.
Status Messages: "SL Touched ❌" or "SL Frozen" when the trade leg completes.
How UT Bot Differs from Other ATR Systems:
Multiple Filters Available: You can require 2-bar confirmation, minimum % price change, swing structure alignment, or ZLSMA directional filter. Most UT implementations have none of these.
Smart SL Calculation: Instead of just using the UT line as your stop, the indicator suggests a better SL based on actual support/resistance. This prevents getting stopped out by wicks while keeping risk controlled.
Visual Audit Trail: All SL/TP lines freeze when touched with clear markers. You can review your trades weeks later and see exactly where entries, stops, and targets were.
Performance Options: "Draw UT visuals only on bar close" lets you reduce rendering load without affecting logic or alerts - critical for slower machines or 1m charts.
Trading Logic:
UT Bot flips direction (Buy or Sell signal appears)
Check Bias Table for multi-timeframe confirmation
Optional: Wait for Base signal or candlestick pattern
Enter at signal bar close or next bar open
Place stop at "Suggested Stop Loss" line
Scale out at TP levels (TP1, TP2, TP3)
Exit remaining position on opposite UT signal or stop hit
---
5. UNDERSTANDING THE MARKET BIAS TABLE
This is the indicator's unique multi-timeframe intelligence layer. Instead of looking at one chart at a time, the table aggregates signals across seven timeframes plus macro trend bias.
Why Multi-Timeframe Analysis Matters:
Professional traders check higher and lower timeframes for context:
Is the 1h uptrend aligning with my 5m entry?
Are all short-term timeframes bullish or just one?
Is the daily trend supportive or fighting me?
Doing this manually means opening multiple charts, checking each indicator, and making mental notes. The Bias Table does it automatically in one glance.
Table Structure:
Header Row:
On intraday charts: 1m, 5m, 15m, 30m, 1h, 2h, 4h (toggle which ones you want)
On daily+ charts: D, W, M (automatic)
Green dot next to title = live updating
Headline Rows - Macro Bias:
These show broad market direction over longer periods:
3 Day Bias: Trend over last 3 trading sessions (uses 1h data)
Weekly Bias: Trend over last 5 trading sessions (uses 4h data)
Monthly Bias: Trend over last 30 daily bars
Quarterly Bias: Trend over last 13 weekly bars
VIX Fear Index: Market regime based on VIX level - bullish when low, bearish when high
Opening Range Breakout: Status of price vs. session open range (intraday only)
These rows show text: "BULLISH", "BEARISH", or "NEUTRAL"
Indicator Rows - Technical Signals:
These evaluate your configured indicators across all active timeframes:
Fast MA > Medium MA (shows your actual MA settings, e.g., "EMA 10 > SMA 20")
Price > Long MA (e.g., "Price > SMA 200")
Price > VWAP
MACD > Signal
Supertrend (up/down/neutral)
ZLSMA Rising
RSI In Zone
ADX ≥ Minimum
These rows show emojis: GREEB (bullish), RED (bearish), GRAY/YELLOW (neutral/NA)
AVG Column:
Shows percentage of active timeframes that are bullish for that row. This is the KEY metric:
AVG > 70% = strong multi-timeframe bullish alignment
AVG 40-60% = mixed/choppy, no clear trend
AVG < 30% = strong multi-timeframe bearish alignment
How to Use the Table:
For a long trade:
Check AVG column - want to see > 60% ideally
Check headline bias rows - want to see BULLISH, not BEARISH
Check VIX row - bullish market regime preferred
Check ORB row (intraday) - want ABOVE for longs
Scan indicator rows - more green = better confirmation
For a short trade:
Check AVG column - want to see < 40% ideally
Check headline bias rows - want to see BEARISH, not BULLISH
Check VIX row - bearish market regime preferred
Check ORB row (intraday) - want BELOW for shorts
Scan indicator rows - more red = better confirmation
When AVG is 40-60%:
Market is choppy, mixed signals. Either stay out or reduce position size significantly. These are low-probability environments.
Unique Features:
Dynamic Labels: Row names show your actual settings (e.g., "EMA 10 > SMA 20" not generic "Fast > Slow"). You know exactly what's being evaluated.
Customizable Rows: Turn off rows you don't care about. Only show what matters to your strategy.
Customizable Timeframes: On intraday charts, disable 1m or 4h if you don't trade them. Reduces calculation load by 20-40%.
Automatic HTF Handling: On Daily/Weekly/Monthly charts, the table automatically switches to D/W/M columns. No configuration needed.
Performance Smart: "Hide BIAS table on 1D or above" option completely skips all table calculations on higher timeframes if you only trade intraday.
---
6. CANDLESTICK PATTERN RECOGNITION
The indicator automatically detects six major reversal patterns and marks them with emojis at the relevant bars.
Why These Six Patterns:
These are the most statistically significant reversal patterns according to trading literature:
High win rate when appearing at support/resistance
Clear visual structure (not subjective)
Work across all timeframes and assets
Studied extensively by institutions
The Patterns:
Bullish Patterns (appear at bottoms):
Bullish Engulfing: Green candle completely engulfs prior red candle's body. Strong reversal signal.
Hammer: Small body with long lower wick (at least 2× body size). Shows rejection of lower prices by buyers.
Morning Star: Three-candle pattern (large red → small indecision → large green). Very strong bottom reversal.
Bearish Patterns (appear at tops):
Bearish Engulfing: Red candle completely engulfs prior green candle's body. Strong reversal signal.
Shooting Star: Small body with long upper wick (at least 2× body size). Shows rejection of higher prices by sellers.
Evening Star: Three-candle pattern (large green → small indecision → large red). Very strong top reversal.
Interactive Tooltips:
Unlike most pattern indicators that just draw shapes, this one is educational:
Hover your mouse over any pattern emoji
A tooltip appears explaining: what the pattern is, what it means, when it's most reliable, and how to trade it
No need to memorize - learn as you trade
Noise Filter:
"Min candle body % to filter noise" setting prevents false signals:
Patterns require minimum body size relative to price
Filters out tiny candles that don't represent real buying/selling pressure
Adjust based on asset volatility (higher % for crypto, lower for low-volatility stocks)
How to Trade Patterns:
Patterns are NOT standalone entry signals. Use them as:
Confirmation: UT Bot gives signal + pattern appears = stronger entry
Reversal Warning: In a trade, opposite pattern appears = consider tightening stop or taking profit
Support/Resistance Validation: Pattern at key level (PDH, VWAP, MA 200) = level is being respected
Best combined with:
UT Bot or Base signal in same direction
Bias Table alignment (AVG > 60% or < 40%)
Appearance at obvious support/resistance
---
7. VISUAL TOOLS AND FEATURES
VWAP (Volume Weighted Average Price):
Session-anchored VWAP with standard deviation bands. Shows institutional "fair value" for the trading session.
Anchor Options: Session, Day, Week, Month, Quarter, Year. Choose based on your trading timeframe.
Bands: Up to three pairs (X1, X2, X3) showing statistical deviation. Price at outer bands often reverses.
Auto-Hide on HTF: VWAP hides on Daily/Weekly/Monthly charts automatically unless you enable anchored mode.
Use VWAP as:
Directional bias (above = bullish, below = bearish)
Mean reversion levels (outer bands)
Support/resistance (the VWAP line itself)
Previous Day High/Low:
Automatically plots yesterday's high and low on intraday charts:
Updates at start of each new trading day
Theme-aware colors (dark text for light charts, light text for dark charts)
Hidden automatically on Daily/Weekly/Monthly charts
These levels are critical for intraday traders - institutions watch them closely as support/resistance.
Opening Range Breakout (ORB):
Tracks the high/low of the first 5, 15, 30, or 60 minutes of the trading session:
Customizable session times (preset for NYSE, LSE, TSE, or custom)
Shows current breakout status in Bias Table row (ABOVE, BELOW, INSIDE, BUILDING)
Intraday only - auto-disabled on Daily+ charts
ORB is a classic day trading strategy - breakout above opening range often leads to continuation.
Extra Labels:
Change from Open %: Shows how far price has moved from session open (intraday) or daily open (HTF). Green if positive, red if negative.
ADX Badge: Small label at bottom of last bar showing current ADX value. Green when above your minimum threshold, red when below.
RSI Badge: Small label at top of last bar showing current RSI value with zone status (buy zone, sell zone, or neutral).
These labels provide quick at-a-glance confirmation without needing separate indicator windows.
---
8. HOW TO USE THE INDICATOR
Step 1: Add to Chart
Load the indicator on your chosen asset and timeframe
First time: Everything is enabled by default - the chart will look busy
Don't panic - you'll turn off what you don't need
Step 2: Start Simple
Turn OFF everything except:
UT Bot labels (keep these ON)
Bias Table (keep this ON)
Moving Averages (Fast and Medium only)
Suggested Stop Loss and Take Profits
Hide everything else initially. Get comfortable with the basic UT Bot + Bias Table workflow first.
Step 3: Learn the Core Workflow
UT Bot gives a Buy or Sell signal
Check Bias Table AVG column - do you have multi-timeframe alignment?
If yes, enter the trade
Place stop at Suggested Stop Loss line
Scale out at TP levels
Exit on opposite UT signal
Trade this simple system for a week. Get a feel for signal frequency and win rate with your settings.
Step 4: Add Filters Gradually
If you're getting too many losing signals (whipsaws in choppy markets), add filters one at a time:
Try: "Require 2-Bar Trend Confirmation" - wait for 2 bars to confirm direction
Try: ADX filter with minimum threshold - only trade when trend strength is sufficient
Try: RSI pullback filter - only enter on pullbacks, not chasing
Try: Volume filter - require above-average volume
Add one filter, test for a week, evaluate. Repeat.
Step 5: Enable Advanced Features (Optional)
Once you're profitable with the core system, add:
Supertrend for additional trend confirmation
Candlestick patterns for reversal warnings
VWAP for institutional anchor reference
ORB for intraday breakout context
ZLSMA for low-lag trend following
Step 6: Optimize Settings
Every setting has a detailed tooltip explaining what it does and typical values. Hover over any input to read:
What the parameter controls
How it impacts trading
Suggested ranges for scalping, day trading, and swing trading
Start with defaults, then adjust based on your results and style.
Step 7: Set Up Alerts
Right-click chart → Add Alert → Condition: "Luxy Momentum v6" → Choose:
"UT Bot — Buy" for long entries
"UT Bot — Sell" for short entries
"Base Long/Short" for filtered MA cross signals
Optionally enable "Send real-time alert() on UT flip" in settings for immediate notifications.
Common Workflow Variations:
Conservative Trader:
UT signal + Base signal + Candlestick pattern + Bias AVG > 70%
Enter only at major support/resistance
Wider UT sensitivity, multiple filters
Aggressive Trader:
UT signal + Bias AVG > 60%
Enter immediately, no waiting
Tighter UT sensitivity, minimal filters
Swing Trader:
Focus on Daily/Weekly Bias alignment
Ignore intraday noise
Use ORB and PDH/PDL less (or not at all)
Wider stops, patient approach
---
9. PERFORMANCE AND OPTIMIZATION
The indicator is optimized for speed, but with 15+ features running simultaneously, chart load time can add up. Here's how to keep it fast:
Biggest Performance Gains:
Disable Unused Timeframes: In "Time Frames" settings, turn OFF any timeframe you don't actively trade. Each disabled TF saves 10-15% calculation time. If you only day trade 5m, 15m, 1h, disable 1m, 2h, 4h.
Hide Bias Table on Daily+: If you only trade intraday, enable "Hide BIAS table on 1D or above". This skips ALL table calculations on higher timeframes.
Draw UT Visuals Only on Bar Close: Reduces intrabar rendering of SL/TP/Entry lines. Has ZERO impact on logic or alerts - purely visual optimization.
Additional Optimizations:
Turn off VWAP bands if you don't use them
Disable candlestick patterns if you don't trade them
Turn off Supertrend fill if you find it distracting (keep the line)
Reduce "Limit to 10 bars" for SL/TP lines to minimize line objects
Performance Features Built-In:
Smart Caching: Higher timeframe data (3-day bias, weekly bias, etc.) updates once per day, not every bar
Conditional Calculations: Volume filter only calculates when enabled. Swing filter only runs when enabled. Nothing computes if turned off.
Modular Design: Every component is independent. Turn off what you don't need without breaking other features.
Typical Load Times:
5m chart, all features ON, 7 timeframes: ~2-3 seconds
5m chart, core features only, 3 timeframes: ~1 second
1m chart, all features: ~4-5 seconds (many bars to calculate)
If loading takes longer, you likely have too many indicators on the chart total (not just this one).
---
10. FAQ
Q: How is this different from standard UT Bot indicators?
A: Standard UT Bot (originally by @QuantNomad) is just the ATR trailing line and flip signals. This implementation adds:
- Volume weighting and momentum adjustment to the trailing calculation
- Multiple confirmation filters (swing, %, 2-bar, ZLSMA)
- Smart composite stop loss system from multiple S/R layers
- R-multiple take profit system with freeze-on-touch
- Integration with multi-timeframe Bias Table
- Visual audit trail with checkmarks
Q: Can I use this for automated trading?
A: The indicator is designed for discretionary trading. While it has clear signals and alerts, it's not a mechanical system. Context and judgment are required.
Q: Does it repaint?
A: No. All signals respect bar close. UT Bot logic runs intrabar but signals only trigger on confirmed bars. Alerts fire correctly with no lookahead.
Q: Do I need to use all the features?
A: Absolutely not. The indicator is modular. Many profitable traders use just UT Bot + Bias Table + Moving Averages. Start simple, add complexity only if needed.
Q: How do I know which settings to use?
A: Every single input has a detailed tooltip. Hover over any setting to see:
What it does
How it affects trading
Typical values for scalping, day trading, swing trading
Start with defaults, adjust gradually based on results.
Q: Can I use this on crypto 24/7 markets?
A: Yes. ORB will not work (no defined session), but everything else functions normally. Use "Day" anchor for VWAP instead of "Session".
Q: The Bias Table is blank or not showing.
A: Check:
"Show Table" is ON
Table position isn't overlapping another indicator's table (change position)
At least one row is enabled
"Hide BIAS table on 1D or above" is OFF (if on Daily+ chart)
Q: Why are candlestick patterns not appearing?
A: Patterns are relatively rare by design - they only appear at genuine reversal points. Check:
Pattern toggles are ON
"Min candle body %" isn't too high (try 0.05-0.10)
You're looking at a chart with actual reversals (not strong trending market)
Q: UT Bot is too sensitive/not sensitive enough.
A: Adjust "Sensitivity (Key×ATR)". Lower number = tighter stop, more signals. Higher number = wider stop, fewer signals. Read the tooltip for guidance.
Q: Can I get alerts for the Bias Table?
A: The Bias Table is a dashboard for visual analysis, not a signal generator. Set alerts on UT Bot or Base signals, then manually check Bias Table for confirmation.
Q: Does this work on stocks with low volume?
A: Yes, but turn OFF the volume filter. Low volume stocks will never meet relative volume requirements.
Q: How often should I check the Bias Table?
A: Before every entry. It takes 2 seconds to glance at the AVG column and headline rows. This one check can save you from fighting the trend.
Q: What if UT signal and Base signal disagree?
A: UT Bot is more aggressive (ATR trailing). Base signals are more conservative (MA cross + filters). If they disagree, either:
Wait for both to align (safest)
Take the UT signal but with smaller size (aggressive)
Skip the trade (conservative)
There's no "right" answer - depends on your risk tolerance.
---
FINAL NOTES
The indicator gives you an edge. How you use that edge determines results.
For questions, feedback, or support, comment on the indicator page or message the author.
Happy Trading!

Smart Breakout Detector: Trendline Retest & Angle FilteringDetect trendline breakouts with two important filtering controls: retest validation and angle filtering. Require multiple price retests (2-4 touches) before a trendline is considered valid, eliminating weak single-touch lines. Set precise angle limits to filter out unreliable steep or shallow trendlines. Three independent timeframe sets (fast/medium/slow) with customizable pivot lengths allow you to get low risk entry point for both short-term and major trend continuations/reversals.
═══════════════════════════════════════════
CORE METHODOLOGY
═══════════════════════════════════════════
This indicator identifies trendline breakouts using two configurable filtering parameters that are uncommon in publicly available indicators:
1. RETEST VALIDATION
Requires a specified number of price touches (2-4) before considering a trendline valid. This reduces false signals from randomly aligned single-touch lines. Higher thresholds decrease signal frequency while increasing reliability.
2. ANGLE FILTERING
Applies maximum angle constraints (0-20) to trendlines independently for resistance and support, both upward and downward slopes. This filters trendlines with extreme angles that typically lack predictive value.
═══════════════════════════════════════════
TECHNICAL IMPLEMENTATION
═══════════════════════════════════════════
DETECTION ALGORITHM:
1. Identifies pivot highs/lows using configurable lookback periods
2. Connects pivots within ATR-based proximity threshold
3. Validates trendlines only after minimum retest requirement is met
4. Applies angle constraints using arctangent calculations
5. Verifies no price penetration occurred between pivot points
6. Triggers breakout signals when price breaches validated lines
THREE INDEPENDENT TREND LINE BANKS:
The indicator operates three parallel detection systems with separate parameters:
- Level Set A: Short pivot periods (default 5 bars)
- Level Set B: Medium pivot periods (default 10 bars)
- Level Set C: Long pivot periods (default 6 bars)
Each system maintains independent arrays of resistance and support lines.
ADAPTIVE COMPONENTS:
- Proximity tolerance scales with ATR(40) to accommodate volatility
- Angle thresholds adjust using combined absolute and percentage ATR factors
- Line lifespan configurable by bar count (default 180/200/300 bars per set)
══════════════════════════════════════════
USE CASES
══════════════════════════════════════════
Appropriate for:
- Filtering breakout candidates by reliability metrics
- Multi-timeframe trendline analysis
- Automated breakout monitoring
- Reducing chart noise from weak trendlines
Not appropriate for:
- Range-bound or highly choppy markets
- Instruments with insufficient historical data
- Strategies requiring predictive (non-historical) trendlines

Session Gap Fill [LuxAlgo]The Session Gap Fill tool detects and highlights filled and unfilled price gaps between regular sessions. It features a dashboard with key statistics about the detected gaps.
The tool is highly customizable, allowing users to filter by different types of gaps and customize how they are displayed on the chart.
🔶 USAGE
By default, the tool detects all price gaps between sessions. A price gap is defined as a difference between the opening price of one session and the closing price of the previous session. In this case, the tool uses the opening price of the first bar of the session against the closing price of the previous bar.
A bullish gap is detected when the session open price is higher than the last close, and a bearish gap is detected when the session open price is lower than the last close.
Gaps represent a change in market sentiment, a difference in what market participants think between the close of one trading session and the open of the next.
What is useful to traders is not the gap itself, but how the market reacts to it.
Unfilled gaps occur when prices do not return to the previous session's closing price.
Filled gaps occur when prices come back to the previous session's close price.
By analyzing how markets react to gaps, traders can understand market sentiment, whether different prices are accepted or rejected, and take advantage of this information to position themselves in favor of bullish or bearish market sentiment.
Next, we will cover the Gap Type Filter and Statistics Dashboard.
🔹 Gap Type Filter
Traders can choose from three options: display all gaps, display only overlapping gaps, or display only non-overlapping gaps. All gaps are displayed by default.
An overlapping gap is defined when the first bar of the session has any price in common with the previous bar. No overlapping gap is defined when the two bars do not share any price levels.
As we will see in the next section, there are clear differences in market behavior around these types of gaps.
🔹 Statistics Dashboard
The Statistics Dashboard displays key metrics that help traders understand market behavior around each type of gap.
Gaps: The percentage of bullish and bearish gaps.
Filled: The percentage of filled bullish and bearish gaps.
Reversed: The percentage of filled gaps that move in favor of the gap
Bars Avg.: The average number of bars for a gap to be filled.
Now, let's analyze the chart on the left of the image to understand those stats. These are the stats for all gaps, both overlapping and non-overlapping.
Of the total, bullish gaps represent 55%, and bearish ones represent 44%. The gap bias is pretty balanced in this market.
The second statistic, Filled, shows that 63% of gaps are filled, both bullish and bearish. Therefore, there is a higher probability that a gap will be filled than not.
The third statistic is reversed. This is the percentage of filled gaps where prices move in favor of the gap. This applies to filled bullish gaps when the close of the session is above the open, and to filled bearish gaps when the close of the session is below the open. In other words, first there is a gap, then it fills, and finally it reverses. As we can see in the chart, this only happens 35% of the time for bullish gaps and 29% of the time for bearish gaps.
The last statistic is Bars Avg., which is the average number of bars for a gap to be filled. On average, it takes between one and two bars for both bullish and bearish gaps. On average, gaps fill quickly.
As we can see on the chart, selecting different types of gaps yields different statistics and market behavior. For example, overlapping gaps have a greater than 90% chance of being filled, whereas non-overlapping gaps have a less than 40% chance.
🔶 SETTINGS
Gap Type: Select the type of gap to display.
🔹 Dashboard
Dashboard: Enable or disable the dashboard.
Position: Select the location of the dashboard.
Size: Select the dashboard size.
🔹 Style
Filled Bullish Gap: Enable or disable this gap and choose the color.
Filled Bearish Gap: Enable or disable this gap and choose the color.
Unfilled Gap: Enable or disable this gap and choose the color.
Max Deviation Level: Enable or disable this level and choose the color.
Open Price Level: Enable or disable this level and choose the color.

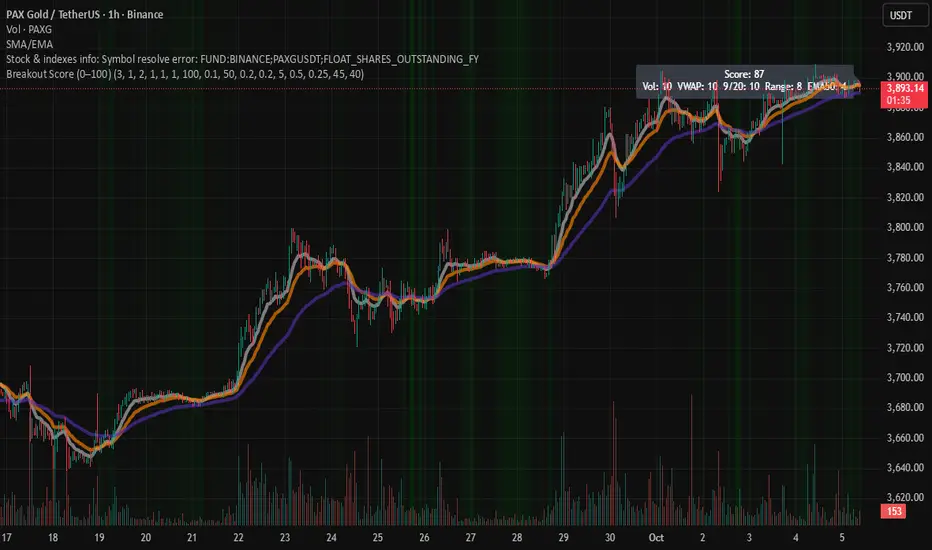
Breakout Score (0–100)Breakouts are often the trader's best setups. Often seen on the chart as wedges and flags, consolidation before a pop up or down. This script attempts to visualize breakout potential with gradients in the background. I built this to place on my side charts to quickly visualize that a setup was forming.
For this indicator, Breakouts have generally been assumed as:
Decrease in average volume over N candles
Proximity to VWAP
Convergence/cross of price to the 9, 20 and 50 EMAs
Range compression (formation of flag or consolidation)
each of these factors are scored and rated. Multiple signals exponentially increase the gradient. Depending on the score, the chart will display a visual gradient behind the chart. Color, opacity and filtering fully customizable.
Enjoy!
Quant Trend + Donchian (Educational, Public-Safe)What this does
Educational, public-safe visualization of a quant regime model:
• Trend : EMA(64) vs EMA(256) (EWMAC proxy)
• Breakout : Donchian channel (200)
• Volatility-awareness : internal z-scores (not plotted) for concept clarity
Why it’s useful
• Shows when trend & breakout align (clean regimes) vs conflict (chop)
• Helps explain why volatility-aware systems size up in smooth trends and scale down in noise
How to read it
• EMA64 above EMA256 with price near/above Donchian high → trend-following alignment
• EMA64 below EMA256 with price near/below Donchian low → bearish alignment
• Inside channel with EMAs tangled → range/chop risk
Notes
• Indicator is educational only (no orders).
• Built entirely with TradingView built-ins.
• For consistent visuals: enable “Indicator values on price scale” and disable “Scale price chart only” in Settings → Scales .

Power Hour Breakout Signals [LuxAlgo]The Power Hour Breakout tool helps traders identify key price levels from the Power Hour and spot breakouts from those levels easily. This tool features Power Hour extensions, Fibonacci levels, and session break marks for the trader's convenience.
🔶 USAGE
The Power Hour is defined as the last hour of the trading session and is set by default from 3:00 p.m. to 4:00 p.m. New York time. During this period, volume and volatility enter the market. Traders using higher timeframes may use this period to enter or exit positions by placing MOC (Market on Close) orders.
This tool highlights the Power Hour and the top and bottom price levels. Each time prices break out from these levels, a signal is displayed on the chart.
We can use the Power Hour to gauge market sentiment:
Bullish sentiment: Price trades above the Power Hour.
Mixed sentiment: Price trades within the Power Hour.
Bearish sentiment: Price trades below the Power Hour.
🔹 Displaying Power Hours and Breakouts
By default, all detected Power Hours are displayed. Traders can manually adjust this number by disabling the "Display All" parameter in the Settings panel.
Breakouts are displayed by default, too, but this feature can be disabled as well.
The chart above shows different configurations of these parameters.
🔹 Power Hour Extensions
Traders can use Power Hour extensions as potential targets for breakout signals.
In the settings panel, traders can select the percentage of the Power Hour price range to use for each extension. For example, 100% uses the full range, 200% uses the range twice, and so on.
As seen on the chart, traders can configure different percentages for the top and bottom extensions.
🔹 Fibonacci Levels
Traders can display default or custom Fibonacci levels on the Power Hour range to identify retracement opportunities and evaluate market movement strength. Each level can be enabled or disabled, as well as customized by level, color, and line style.
For example, as we can see on the chart, prices attempt to break out at the Power Hour top level, then retrace to the 0.618 Fibonacci level, and then rise to the 200% Power Hour top extension.
🔶 SETTINGS
Display Last X Power Hours: Select how many Power Hours to display or enable the Display All feature.
Power Hour (NY Time): Choose a custom Power Hour in New York time.
🔹 Breakouts
Breakouts: Enable or disable breakouts.
Bullish Breakout: Select color for bullish breakouts.
Bearish Breakout: Select color for bearish breakouts.
🔹 Extensions
Top Extension: Enable or disable the top extension and choose the percentage of Power Hour to use.
Bottom extension: Enable or disable the bottom extension and choose the percentage of Power Hour to use.
🔹 Fibonacci Levels
Display Fibonacci: Enable or disable Fibonacci levels.
Reverse: Reverse Fibonacci levels.
Levels, Colors & Style
Display Labels: Enable or disable labels and choose text size.
🔹 Style
Power Hour Colors
Extension Transparency: Choose the extension's transparency. 0 is solid, and 100 is fully transparent.
Session Breaks: Enable or disable session breaks.

Opening Candle Zone with ATR Bands by nkChartsThis indicator highlights the opening range of each trading session and projects dynamic ATR-based zones around it.
Key Features
Plots high and low levels of the opening candle for each new daily session.
Extends these levels across the session, providing clear intraday support and resistance zones.
Adds ATR-based offset bands above and below the opening range for volatility-adjusted levels.
Customizable colors, ATR length, and multiplier for flexible use across markets and timeframes.
Adjustable session history limit to control how many past levels remain on the chart.
How to Use:
The opening range high/low often acts as strong intraday support or resistance.
The ATR bands give an adaptive volatility buffer, useful for breakout or mean-reversion strategies.
Works on any market with clear session opens.
This tool is designed for traders who want to combine session-based price action with volatility insights, helping identify potential breakouts, reversals, or consolidation areas throughout the day.
⚠️ Disclaimer: This indicator is for educational purposes only. It does not provide financial advice or guarantee profits. Always perform your own analysis before making trading decisions.

Breakout Volume
指标名称:Breakout Volume (BrkVol)
功能:本指标用于识别成交量异常放大,同时结合价格新高,帮助交易者发现潜在突破机会。
主要特性:
可调成交量均线周期(MA Length)
可调放量倍数(Volume Multiplier)
可调价格新高周期(Lookback High Length)
成交量柱颜色区分:绿色=阳线放量,红色=阴线放量,灰色=无信号
蓝色均量阈值线,可直观比较放量情况
出现成交量突破 + 新高时,图表上显示绿色三角形标记
支持提醒功能,可在条件触发时收到通知
使用建议:
调整参数以适应不同品种和时间周期
可结合趋势、支撑阻力位使用,避免假信号
适合快速发现短线或中长线突破机会
English Description
Name: Breakout Volume (BrkVol)
Function: This indicator detects unusual volume spikes combined with new highs in price, helping traders identify potential breakout opportunities.
Key Features:
Adjustable moving average period (MA Length) for volume
Adjustable volume multiplier (Volume Multiplier)
Adjustable lookback period for price highs (Lookback High Length)
Color-coded volume bars: Green = bullish candle with volume breakout, Red = bearish candle with volume breakout, Gray = normal volume
Blue threshold line (volume MA × multiplier) for easy comparison
Green triangle marker appears when both volume breakout and new high conditions are met
Supports alerts for real-time notifications
Usage Tips:
Adjust parameters to suit different symbols and timeframes
Combine with trend or support/resistance levels to reduce false signals
Useful for spotting short-term or medium/long-term breakout opportunities

Initial Balance Breakout Signals [LuxAlgo]The Initial Balance Breakout Signals help traders identify breakouts of the Initial Balance (IB) range.
The indicator includes automatic detection of IB or can use custom sessions, highlights top and bottom IB extensions, custom Fibonacci levels, and goes further with an IB forecast with two different modes.
🔶 USAGE
The initial balance is the price range made within the first hour of the trading session. It is an intraday concept based on the idea that high volume and volatility enter the market through institutional trading at the start of the session, setting the tone for the rest of the day.
The initial balance is useful for gauging market sentiment, or, in other words, the relationship between buyers and sellers.
Bullish sentiment: Price trades above the IB range.
Mixed sentiment: Price trades within the IB range.
Bearish sentiment: Price trades below the IB range.
The initial balance high and low are important levels that many traders use to gauge sentiment. There are two main ideas behind trading around the IB range.
IB Extreme Breakout: When the price breaks and holds the IB high or low, there is a high probability that the price will continue in that direction.
IB Extreme Rejection: When the price tries to break those levels but fails, there is a high probability that it will reach the opposite IB extreme.
This indicator is a complete Initial Balance toolset with custom sessions, breakout signals, IB extensions, Fibonacci retracements, and an IB forecast. All of these features will be explained in the following sections.
🔹 Custom Sessions and Signals
By default, sessions for Initial Balance and breakout signals are in Auto mode. This means that Initial Balance takes the first hour of the trading session and shows breakout signals for the rest of the session.
With this option, traders can use the tool for open range trading, making it highly versatile. The concept behind open range (OR) is the same as that of initial balance (IB), but in OR, the range is determined by the first minute, three or five minutes, or up to the first 30 minutes of the trading session.
As shown in the image above, the top chart uses the Auto feature for the IB and Breakouts sessions. The bottom chart has the Auto feature disabled to use custom sessions for both parameters. In this case, the first three minutes of the trading session are used, turning the tool into an Open Range trading indicator.
This chart shows another example of using custom sessions to display overnight NASDAQ futures sessions.
The left chart shows a custom session from the Tokyo open to the London open, and the right chart shows a custom session from the London open to the New York open.
The chart shows both the Asian and European sessions, their top and bottom extremes, and the breakout signals from those extremes.
🔹 Initial Balance Extensions
Traders can easily extend both extremes of the Initial Balance to display their preferred targets for breakouts. Enable or disable any of them and set the IB percentage to use for the extension.
As the chart shows, the percentage selected on the settings panel directly affects the displayed levels.
Setting 25 means the tool will use a quarter of the detected initial balance range for extensions beyond the IB extremes. Setting 100 means the full IB range will be used.
Traders can use these extensions as targets for breakout signals.
🔹 Fibonacci Levels
Traders can display default or custom Fibonacci levels on the IB range to trade retracements and assess the strength of market movements. Each level can be enabled or disabled and customized by level, color, and line style.
As we can see on the chart, after the IB was completed, prices were unable to fall below the 0.236 Fibonacci level. This indicates significant bullish pressure, so it is expected that prices will rise.
Traders can use these levels as guidelines to assess the strength of the side trying to penetrate the IB. In this case, the sellers were unable to move the market beyond the first level.
🔹 Initial Balance Forecast
The tool features two different forecasting methods for the current IB. By default, it takes the average of the last ten values and applies a multiplier of one.
IB Against Previous Open: averages the difference between IB extremes and the open of the previous session.
Filter by current day of the week: averages the difference between IB extremes and the open of the current session for the same day of the week.
This feature allows traders to see the difference between the current IB and the average of the last IBs. It makes it very easy to interpret: if the current IB is higher than the average, buyers are in control; if it is lower than the average, sellers are in control.
For example, on the left side of the chart, we can see that the last day was very bullish because the IB was completely above the forecasted value. This is the IB mean of the last ten trading days.
On the right, we can see that on Monday, September 15, the IB traded slightly higher but within the forecasted value of the IB mean of the last ten Mondays. In this case, it is within expectations.
🔶 SETTINGS
Display Last X IBs: Select how many IBs to display.
Initial Balance: Choose a custom session or enable the Auto feature.
Breakouts: Enable or disable breakouts. Choose custom session or enable the Auto feature.
🔹 Extensions
Top Extension: Enable or disable the top extension and choose the percentage of IB to use.
Bottom extension: Enable or disable the bottom extension and choose the percentage of IB to use.
🔹 Fibonacci Levels
Display Fibonacci: Enable or disable Fibonacci levels.
Reverse: Reverse Fibonacci levels.
Levels, Colors & Style
Display Labels: Enable or disable labels and choose text size.
🔹 Forecast
Display Forecast: Select the forecast method.
- IB Against Previous Open: Calculates the average difference between the IB high and low and the previous day's IB open price.
- Filter by Current Day of Week: Calculates the average difference between the IB high and low and the IB open price for the same day of the week.
Forecast Memory: The number of data points used to calculate the average.
Forecast Multiplier: This multiplier will be applied to the average. Bigger numbers will result in wider predicted ranges.
Forecast Colors: Choose from a variety of colors.
Forecast Style: Choose a line style.
🔹 Style
Initial Balance Colors
Extension Transparency: Choose the extension's transparency. 0 is solid, and 100 is fully transparent.

SMC BOS - Structure Breaks & Median Continuation ProjectionsThis tool shows what usually happens after a Break of Structure (BOS).
It scans past BOS events on your chart, finds the ones most similar to the latest break (using ATR to filter by volatility), and then plots the median continuation path.
Optional percentile bands (P10–P90) display the possible range of outcomes around the median.
Key features:
• Automatic detection of bullish and bearish BOS events
• Library of past BOS with adjustable size and spacing
• ATR-based similarity and recency weighting
• Median continuation projections with optional percentile bands
• Customizable colors, signals, and stats table
• Works on any market and timeframe
Use cases:
• See how price typically behaves after a BOS
• Support SMC analysis with data-driven projections
• Improve trade planning by visualizing likely continuations
• Apply across crypto, forex, stocks, and futures
Originality:
Instead of only marking BOS, this script learns from history and projects forward the median path of the most similar past cases, adjusted for volatility. It turns BOS signals into practical continuation scenarios.
Instructions:
Add the indicator to your chart. When a BOS is detected, the projection is drawn automatically.
Use the settings to adjust the library, ATR weighting, projection style, percentile bands, and the display of signals or stats.
For questions or customization, contact Julien Eche (Julien_Eche) on TradingView.

ORB + Session VWAP Pro (London & NY) — fixedORB + Session VWAP Pro (London & NY) — Listing copy (EN)
What it is
A clean, non-repainting intraday tool that fuses the classic Opening Range Breakout (ORB) with a session-anchored VWAP filter for London and New York. It highlights only the higher-quality breakouts (above/below session VWAP), adds an optional retest confirmation, and scores each signal with an intuitive Confidence metric (0–100).
Why it works
• ORB provides the day’s first actionable structure (range high/low).
• Session VWAP filters “cheap” breaks and favors flows aligned with session value.
• Optional retest reduces first-tick whipsaws.
• Confidence blends breakout depth (vs ATR), VWAP slope and band distance.
Key visuals
• LDN/NY OR High/Low (line break style) + optional OR boxes.
• Active Session VWAP (resets per signal window; falls back to daily VWAP outside).
• Optional VWAP bands (stdev or %).
• Session shading (London/NY windows).
• Signal markers (LDN BUY/SELL, NY BUY/SELL) fired with cooldown.
Signals
• London Long / Short: Break of LDN OR High/Low ± ATR buffer, aligned with VWAP side.
• NY Long / Short: Same logic during NY window.
• Retest (optional): Requires a tag back to the OR level ± tolerance before confirmation.
• Confidence: 0–100; gate via Min Confidence (default 55).
Inputs that matter
• Open Range Length (min): Default 15.
• London/NY times & timezones.
• ATR buffer & retest tolerance.
• Bands mode: Stdev (with lookback) or % (e.g., 1%).
• Signal cooldown: Avoids clutter on fast moves.
Non-repaint policy
• OR lines build within fixed time windows using the current bar’s timestamp.
• VWAP is cumulative within the session window; no lookahead.
• All ta.crossover/ta.crossunder are precomputed every bar (no conditional execution).
• Signals are based on live bar values, not future bars.
⸻
Quick start (examples)
1) EURUSD, London momentum
• Chart: 5m or 15m.
• OR: 15 min starting 08:00 Europe/London.
• Signals: Use defaults; keep ATR buffer = 0.2 and Retest = ON, Min Confidence ≥ 55.
• Play:
• BUY when price breaks LDN OR High + buffer and stays above VWAP; retest confirms.
• Trail behind VWAP or band #1; partials into band #2.
2) NAS100, New York breakout & run
• Chart: 5m.
• NY window: 09:30 America/New_York, OR = 15 min.
• Retest OFF on high momentum days; Min Confidence ≥ 60.
• Use band mode Stdev, bandLen=50, show ±1/±2.
• Momentum continuation: add on pullbacks that hold above VWAP after the breakout.
3) XAUUSD, London fake & VWAP fade
• Chart: 5m.
• Keep Retest ON; accept only shorts that break OR Low but retest fails back under VWAP.
• Confidence gate ≥ 50 to allow more mean-reversion setups.
⸻
Pro tips
• Adjust ATR buffer to the instrument: FX 0.15–0.25, indices 0.20–0.35, metals 0.20–0.30.
• Retest ON for choppy conditions; OFF for news momentum.
• Use VWAP bands: take partials at ±1; stretch targets at ±2/±3.
• Session timezones are explicit (London/New York). Ensure they match your instrument’s behavior.
• Pair with a higher-TF bias (e.g., 1H/4H trend) for directional filtering.
⸻
Alerts (ready to use)
• ORB+SVWAP — LDN Long, LDN Short, NY Long, NY Short
(Respect your cooldown; alerts fire only after confirmation and confidence gate.)
⸻
Known limits & notes
• Designed for intraday. On 1D+ charts, session windows compress.
• If your broker session differs from London/NY clocks on a holiday, adjust input times.
• Session-anchored VWAP uses the script’s signal window, not exchange sessions, by design.

Volume Profile Auto POC📌 Overview
Volume Profile Auto POC is a trend-following strategy that uses the automatically calculated Point of Control (POC) from the volume profile, combined with ATR zones, to capture reversals and breakouts.
By basing decisions on volume concentration, it dynamically visualizes the price levels most watched by market participants.
⚠️ This strategy is provided for educational and research purposes only.
Past performance does not guarantee future results.
🎯 Strategy Objectives
Automatically detect the volume concentration area (POC) to improve entry accuracy
Optimize risk management through ATR-based volatility adjustment
Provide early and consistent signals when trends emerge
✨ Key Features
Automatic POC Detection : Updates the volume profile over a defined lookback window in real time
ATR Zone Integration : Defines a POC ± 0.5 ATR zone to clarify potential reversals/breakouts
Visual Support : Plots the POC line and zones on the chart for intuitive decision-making
📊 Trading Rules
Long Entry:
Price breaks above the POC + 0.5 ATR zone
Volume is above average to support the breakout
Short Entry:
Price breaks below the POC - 0.5 ATR zone
Volume is above average to support the downside move
Exit (or Reverse Position):
Price returns to the POC area
Or touches the ATR band
⚙️ Trading Parameters & Considerations
Indicator Name: Volume Profile Auto POC
Parameters:
Lookback Bars: 50
Bins for Volume Profile: 24
ATR Length: 14
ATR Multiplier: 2.0
🖼 Visual Support
POC line plotted in red
POC ± 0.5 ATR zone displayed as a semi-transparent box
ATR bands plotted in blue for confirmation
🔧 Strategy Improvements & Uniqueness
This strategy is inspired by traditional Volume Profile + ATR analysis,
while adding the improvement of a sliding-window mechanism for automatic POC updates.
Compared with conventional trend-following approaches,
its strength lies in combining both price and volume perspectives for decision-making.
✅ Summary
Volume Profile Auto POC automatically extracts key market levels (POC) and combines them with ATR-based zones,
providing a responsive trend-following method.
It balances clarity with practicality, aiming for both usability and reproducibility.
⚠️ This strategy is based on historical data and does not guarantee future profits.
Always use proper risk management when applying it.

TradeX ORB SniperTradeX ORB Sniper — Multi-Range Opening Breakout Framework
This invite-only script is a structured Opening Range Breakout (ORB) tool designed to map price interaction with multiple predefined ranges. It is not a collection of generic settings — all versions and filters are coded in-house and connected through a shared logic engine.
Purpose & Core Design
The ORB Sniper provides four internally coded modes, each referencing a distinct opening range. Depending on market context, ranges may include:
Pre-market session range
5-minute opening range
15-minute opening range
Volume-adaptive range variations
Each mode ensures consistent logic across timeframes, allowing traders to analyze breakout dynamics in a rule-based framework.
Breakout Highlighting
When price closes above or below the active range, the script highlights that candle in gold/yellow (“Get Ready Candle”). This highlight is informational only, serving as a visual marker of when price has left the defined range.
Zone Projection & Box Mapping
To help visualize breakout dynamics, the script plots risk and reward boxes:
Risk Box — initial region mapped from the selected range
Reward Box — projected continuation area based on range displacement
These elements are configurable, giving traders flexibility in how the breakout context is displayed.
Custom Visual Inputs
Users can adjust all visual components directly from the settings panel:
ORB Mode — toggle between V1–V4 range types
Risk Box Color — customize the risk region’s display
Reward Box Color — adjust continuation box visuals
Get Ready Candle Color — select the breakout candle highlight color
Inputs in Status Line — optional summary display at the top of the chart
This ensures the framework is adaptable to any chart theme or personal preference.
Development Process
The ORB Sniper was first modeled in Python, where volume, volatility, and technical variations were looped through to refine range definitions. The most effective rules were then coded into Pine Script, creating a streamlined, repeatable breakout framework.
Disclaimer
This is an original, closed-source TradeX Labs tool. It references known concepts (opening ranges, volume dynamics) within a proprietary rule-based framework. It is intended for visual analysis only and does not provide trade signals or guarantee results. Default settings are for illustration; traders should adjust configuration to their instrument and timeframe.

Turtle Body Setup by TradeTech AnalysisOverview
Turtle Body Setup is a minimalist, rules-based pattern detector built around a simple idea: a sequence of shrinking candle bodies (compression) often precedes a directional expansion (breakout). The script identifies those compression phases and then flags the first candle whose body expands significantly beyond the recent average, with polarity taken from the candle’s direction.
This is not a mash-up of many public indicators. It focuses on one original micro-structure concept: strict body-contraction → body-expansion . The logic is fully described below so traders and moderators can understand what it does and how to use it.
How it Works
1. Compression detection (body contraction):
• Over a user-defined window Compression Lookback (N), the script counts strictly shrinking candle bodies (|close-open|).
• When the count ≥ Min Shrinking Candles, we mark the market as in compression.
2. Expansion / Breakout qualification:
• Compute avgBody = SMA(body, N).
• A candle is a breakout when current body > avgBody × Breakout Body Multiplier.
• Polarity: green (close>open) → Bullish breakout; red (close

Smart Money Price Action ProSmart Money Price Action Pro - Smart Money and Price Action Dynamic Toolkit
The Smart Money Price Action Pro is designed to bring together multiple layers of market analysis into a single, cohesive framework, combining trend identification and consolidation detection in an actionable format. While individual indicators can provide useful insights, they often work in isolation. This toolkit integrates market flow detection, range analytics, and adaptive visualization into one system, allowing traders to see the bigger picture without piecing together multiple disconnected tools.
Building on principles from institutional trading behaviors, the toolkit gives traders a clearer picture of where “smart money” may be entering or exiting the market. Its design emphasizes confluence: signals from multiple independent modules overlap to create higher conviction setups, offering a structured edge when planning entries, exits, and risk levels.
At its core, the toolkit addresses the duality of market conditions: trending versus ranging. By offering a combination of trend-following signals and contrarian insights, it helps traders operate with a deeper understanding of market structure. While it provides actionable signals and visual guidance, it is intended as an assistive system, helping traders make more informed decisions rather than serving as a single source of truth.
Key Modules
1. Smart Money Signal Module
The Smart Money Signal Module identifies potential institutional activity by analyzing price swings and momentum shifts. Using configurable swing detection, it highlights potential reversal or continuation zones, expressed as adaptive zones around key market levels.
Signals are augmented with trend-colored candle overlays, offering immediate guidance on market bias. Bullish and bearish zones are clearly marked, while continuation and reversal markers help distinguish between trend shifts and market noise.
At its core, the engine applies swing detection combined with a sensitivity filter to track directional momentum across recent bars. This allows it to pinpoint bullish pivots (where downside momentum fades and strength returns) and bearish pivots (where upside momentum collapses). Once a pivot is confirmed, the system draws flow lines that map the breakout and classify it as either continuation or reversal, depending on broader market bias.
Momentum zones are then plotted to show areas where buyers stepped in with strength or sellers forced price lower. These levels extend forward dynamically, shifting in real time as new data forms. Zones change color the moment they break, visually confirming whether market structure has held or failed. Gradient shading highlights periods of extreme pressure, giving traders a clear visual of when momentum surges into overbought or oversold territory.
Instead of simply showing trend direction, this module also maps accumulation and distribution zones tied to institutional flows. When combined with the Range Module, these zones become more meaningful — for example, when institutional accumulation aligns with a breakout from consolidation.
Practical Use: Traders can use these signals to align trades with institutional flows. For example, entering a long position near a bullish accumulation zone or managing risk when bearish distribution areas form. By combining these insights with higher timeframe analysis, traders can filter out false signals and improve decision-making.
2. Range Detection Module
The Range Detection engine continuously monitors price action to flag when markets transition into consolidation phases. Ranges are defined not just by flat price action, but by a measurable contraction in volatility, repeated touches of boundary levels, and the clustering of traded volume around a central equilibrium point.
Once a valid range is identified, the system assigns a compression strength score (0–100). This score reflects how cleanly defined and structurally sound the consolidation is—higher scores indicate tighter boundaries and stronger evidence of accumulation or distribution.
Breakout tendencies are modeled dynamically. The system updates a forward-looking bias by incorporating:
Boundary time distribution – how often price presses against upper vs. lower edges
Historical breakout patterns – probability benchmarks derived from structurally similar ranges
Volume skew – whether traded volume leans toward buyers or sellers inside the range
Momentum alignment – auxiliary filters such as slope-based oscillators that indicate when energy is building for a directional move
The result is a live breakout forecast that evolves bar by bar as the range matures. Each active range carries a visual strength meter plotted above the consolidation zone, quantifying both compression and breakout potential in real time.
The module also supports range memory, preserving completed consolidations even after a breakout. This allows traders to review the prior structure for post-analysis or to track whether price respects the boundaries of the old range as support or resistance going forward.
Practical Use : Traders can use these ranges to anticipate breakout direction or step aside when conditions are unclear. A tight consolidation near a bullish zone, for instance, often signals a potential long opportunity, while overlapping bearish flows warn of false breakouts.
Integrated Workflow
The strength of the toolkit lies in its synergy. Each module is effective on its own, but the real advantage comes when their signals align.
A typical workflow may include:
Assessing the market trend using the Smart Money Signal Module and its trend-colored overlays
Identifying consolidation and breakout zones with the Range Detection Module
Watching for confluences: institutional accumulation aligning with range compression, or dashboard bias matching local setups
Executing trades with structured confidence, using these layered confirmations rather than relying on a single trigger
This integrated workflow streamlines decision-making and avoids the conflicting signals that can occur when combining unrelated indicators.
Additional Features
Adaptive Visualization : Dynamic zones and trend overlays adjust to volatility, keeping charts clear and focused
Analytics Dashboard : A compact summary panel shows active zones, bullish vs bearish flow counts, and current bias, giving context at a glance
Instead of simply adding more signals, the dashboard provides a meta-layer of analysis — context, bias, and flow strength — helping traders manage risk and stay aligned with broader market conditions.
Use Cases
Trend Confluence : Entering trades in line with prevailing smart money flows while filtering out counter-trend setups
Breakout Trading : Using the Range Detection Module to anticipate breakout zones and confirming direction with institutional flow signals
Contrarian Reversal Trades : Targeting accumulation/distribution zones where both modules indicate potential reversals
Each use case demonstrates how layered confluence creates clarity and conviction, making the toolkit a strong complement to other forms of technical analysis.
Conclusion
The Smart Money Signals Toolkit simplifies complex market analysis into actionable, visually intuitive insights. While standalone indicators provide value, this toolkit goes further by combining smart money flows, range detection, adaptive zones, and dashboard analytics into one cohesive system.
It doesn’t just generate buy/sell markers — it shows why a setup matters, where it is occurring, and how it aligns with broader conditions. This allows traders to operate with greater clarity, structure, and discipline.
Risk Disclaimer : This toolkit and its features are for educational and informational purposes only. Past performance does not guarantee future results. All suggested use cases are theoretical and should be applied with proper risk management.

Advanced Range Analyzer ProAdvanced Range Analyzer Pro – Adaptive Range Detection & Breakout Forecasting
Overview
Advanced Range Analyzer Pro is a comprehensive trading tool designed to help traders identify consolidations, evaluate their strength, and forecast potential breakout direction. By combining volatility-adjusted thresholds, volume distribution analysis, and historical breakout behavior, the indicator builds an adaptive framework for navigating sideways price action. Instead of treating ranges as noise, this system transforms them into opportunities for mean reversion or breakout trading.
How It Works
The indicator continuously scans price action to identify active range environments. Ranges are defined by volatility compression, repeated boundary interactions, and clustering of volume near equilibrium. Once detected, the indicator assigns a strength score (0–100), which quantifies how well-defined and compressed the consolidation is.
Breakout probabilities are then calculated by factoring in:
Relative time spent near the upper vs. lower range boundaries
Historical breakout tendencies for similar structures
Volume distribution inside the range
Momentum alignment using auxiliary filters (RSI/MACD)
This creates a live probability forecast that updates as price evolves. The tool also supports range memory, allowing traders to analyze the last completed range after a breakout has occurred. A dynamic strength meter is displayed directly above each consolidation range, providing real-time insight into range compression and breakout potential.
Signals and Breakouts
Advanced Range Analyzer Pro includes a structured set of visual tools to highlight actionable conditions:
Range Zones – Gradient-filled boxes highlight active consolidations.
Strength Meter – A live score displayed in the dashboard quantifies compression.
Breakout Labels – Probability percentages show bias toward bullish or bearish continuation.
Breakout Highlights – When a breakout occurs, the range is marked with directional confirmation.
Dashboard Table – Displays current status, strength, live/last range mode, and probabilities.
These elements update in real time, ensuring that traders always see the current state of consolidation and breakout risk.
Interpretation
Range Strength : High scores (70–100) indicate strong consolidations likely to resolve explosively, while low scores suggest weak or choppy ranges prone to false signals.
Breakout Probability : Directional bias greater than 60% suggests meaningful breakout pressure. Equal probabilities indicate balanced compression, favoring mean-reversion strategies.
Market Context : Ranges aligned with higher timeframe trends often resolve in the dominant direction, while counter-trend ranges may lead to reversals or liquidity sweeps.
Volatility Insight : Tight ranges with low ATR imply imminent expansion; wide ranges signal extended consolidation or distribution phases.
Strategy Integration
Advanced Range Analyzer Pro can be applied across multiple trading styles:
Breakout Trading : Enter on probability shifts above 60% with confirmation of volume or momentum.
Mean Reversion : Trade inside ranges with high strength scores by fading boundaries and targeting equilibrium.
Trend Continuation : Focus on ranges that form mid-trend, anticipating continuation after consolidation.
Liquidity Sweeps : Use failed breakouts at boundaries to capture reversals.
Multi-Timeframe : Apply on higher timeframes to frame market context, then execute on lower timeframes.
Advanced Techniques
Combine with volume profiles to identify areas of institutional positioning within ranges.
Track sequences of strong consolidations for trend development or exhaustion signals.
Use breakout probability shifts in conjunction with order flow or momentum indicators to refine entries.
Monitor expanding/contracting range widths to anticipate volatility cycles.
Custom parameters allow fine-tuning sensitivity for different assets (crypto, forex, equities) and trading styles (scalping, intraday, swing).
Inputs and Customization
Range Detection Sensitivity : Controls how strictly ranges are defined.
Strength Score Settings : Adjust weighting of compression, volume, and breakout memory.
Probability Forecasting : Enable/disable directional bias and thresholds.
Gradient & Fill Options : Customize range visualization colors and opacity.
Dashboard Display : Toggle live vs last range, info table size, and position.
Breakout Highlighting : Choose border/zone emphasis on breakout events.
Why Use Advanced Range Analyzer Pro
This indicator provides a data-driven approach to trading consolidation phases, one of the most common yet underutilized market states. By quantifying range strength, mapping probability forecasts, and visually presenting risk zones, it transforms uncertainty into clarity.
Whether you’re trading breakouts, fading ranges, or mapping higher timeframe context, Advanced Range Analyzer Pro delivers a structured, adaptive framework that integrates seamlessly into multiple strategies.

Stockbee LabelUnlock the full potential of your TradingView charts with this powerful indicator designed specifically for Stockbee methods. Instantly gain key market insights at a glance with a sleek, easy-to-read label displayed on your chart. This dynamic label provides critical data including Volume, Total Float, Market Capitalization, Trend Intensity, Average Daily Range (ADR), Half-Day Stop Loss level, and Modified Double Trouble (MDT) .
Elevate your trading strategy with real-time, essential metrics all in one place—streamlining your decision-making and boosting your confidence in the market.
Disclaimer: This indicator is inspired by and built upon the original concepts of Stockbee and EG.
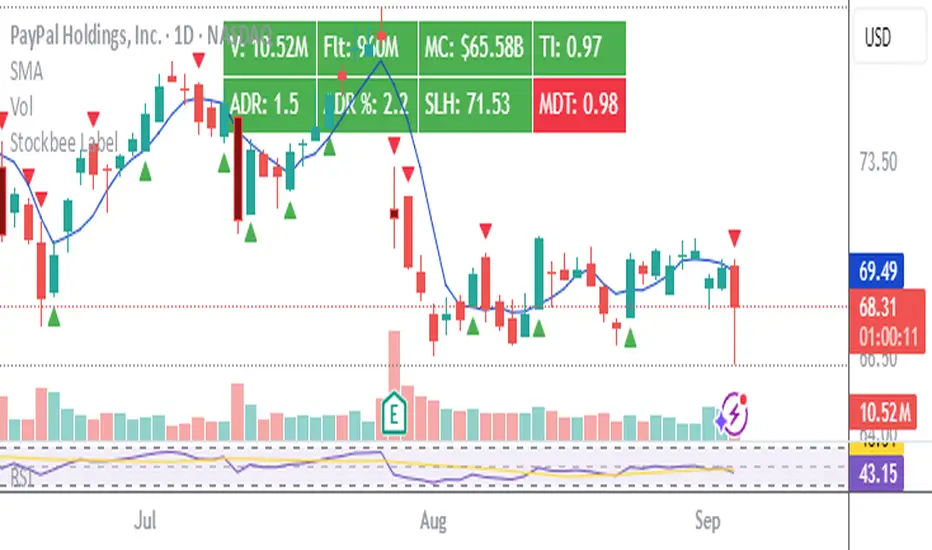
Volumetric Support and Resistance [BackQuant]Volumetric Support and Resistance
What this is
This Overlay locates price levels where both structure and participation have been meaningful. It combines classical swing points with a volume filter, then manages those levels on the chart as price evolves. Each level carries:
• A reference price (support or resistance)
• An estimate of the volume that traded around that price
• A touch counter that updates when price retests it
• A visual box whose thickness is scaled by volatility
The result is a concise map of candidate support and resistance that is informed by both price location and how much trading occurred there.
How levels are built
Find structural pivots uses ta.pivothigh and ta.pivotlow with a user set sensitivity. Larger sensitivity looks for broader swings. Smaller sensitivity captures tighter turns.
Require meaningful volume computes an average volume over a lookback period and forms a volume ratio for the current bar. A pivot only becomes a level when the ratio is at least the volume significance multiplier.
Avoid clustering checks a minimum level distance (as a percent of price). If a candidate is too close to an existing level, it is skipped to keep the map readable.
Attach a volume strength to the level estimates volume strength by averaging the volume of recent bars whose high to low range spans that price. Levels with unusually high strength are flagged as high volume.
Store and draw levels are kept in an array with fields for price, type, volume, touches, creation bar, and a box handle. On the last bar, each level is drawn as a horizontal box centered at the price with a vertical thickness scaled by ATR. Borders are thicker when the level is marked high volume. Boxes can extend into the future.
How levels evolve over time
• Aging and pruning : levels are removed if they are too old relative to the lookback or if you exceed the maximum active levels.
• Break detection : a level can be removed when price closes through it by more than a break threshold set as a fraction of ATR. Toggle with Remove Broken Levels.
• Touches : when price approaches within the break threshold, the level’s touch counter increments.
Visual encoding
• Boxes : support boxes are green, resistance boxes are red. Box height uses an ATR based thickness so tolerance scales with volatility. Transparency is fixed in this version. Borders are thicker on high volume levels.
• Volume annotation : show the estimated volume inside the box or as a label at the right. If a level has more than one touch, a suffix like “(2x)” is appended.
• Extension : boxes can extend a fixed number of bars into the future and can be set to extend right.
• High volume bar tint : bars with volume above average × multiplier are tinted green if up and red if down.
Inputs at a glance
Core Settings
• Level Detection Sensitivity — pivot window for swing detection
• Volume Significance Multiplier — minimum volume ratio to accept a pivot
• Lookback Period — window for average volume and maintenance rules
Level Management
• Maximum Active Levels — cap on concurrently drawn levels
• Minimum Level Distance (%) — required spacing between level prices
Visual Settings
• Remove Broken Levels — drop a level once price closes decisively through it
• Show Volume Information on Levels — annotate volume and touches
• Extend Levels to Right — carry boxes forward
Enhanced Visual Settings
• Show Volume Text Inside Box — text placement option
• Volume Based Transparency and Volume Based Border Thickness — helper logic provided; current draw block fixes transparency and increases border width on high volume levels
Colors
• Separate colors for support, resistance, and their high volume variants
How it can be used
• Trade planning : use the most recent support and resistance as reference zones for entries, profit taking, or stop placement. ATR scaled thickness provides a practical buffer.
• Context for patterns : combine with breakouts, pullbacks, or candle patterns. A breakout through a high volume resistance carries more informational weight than one through a thin level.
• Prioritization : when multiple levels are nearby, prefer high volume or higher touch counts.
• Regime adaptation : widen sensitivity and increase minimum distance in fast regimes to avoid clutter. Tighten them in calm regimes to capture more granularity.
Why volume support and resistance is used in trading
Support and resistance relate to willingness to transact at certain prices. Volume measures participation. When many contracts change hands near a price:
• More market players hold inventory there, often creating responsive behavior on retests
• Order flow can concentrate again to defend or to exit
• Breaks can be cleaner as trapped inventory rebalances
Conditioning level detection on above average activity focuses attention on prices that mattered to more participants.
Alerts
• New Support Level Created
• New Resistance Level Created
• Level Touch Alert
• Level Break Alert
Strengths
• Dual filter of structure and participation, reducing trivial swing points
• Self cleaning map that retires old or invalid levels
• Volatility aware presentation using ATR based thickness
• Touch counting for persistence assessment
• Tunable inputs for instrument and timeframe
Limitations and caveats
• Volume strength is an approximation based on bars spanning the price, not true per price volume
• Pivots confirm after the sensitivity window completes, so new levels appear with a delay
• Narrow ranges can still cluster levels unless minimum distance is increased
• Large gaps may jump past levels and immediately trigger break conditions
Practical tuning guide
• If the chart is crowded: increase sensitivity, increase minimum level distance, or reduce maximum active levels
• If useful levels are missed: reduce volume multiplier or sensitivity
• If you want stricter break removal: increase the ATR based break threshold in code
• For instruments with session patterns: tailor the lookback period to a representative window
Interpreting touches and breaks
• First touch after creation is a validation test
• Multiple shallow touches suggest absorption; a later break may then travel farther
• Breaks on high current volume merit extra attention
Multi timeframe usage
Levels are computed on the active chart timeframe. A common workflow is to keep a higher timeframe instance for structure and a lower timeframe instance for execution. Align trades with higher timeframe levels where possible.
Final Thoughts
This indicator builds a lightweight, self updating map of support and resistance grounded in swings and participation. It is not a full market profile, but it captures much of the practical benefit with modest complexity. Treat levels as context and decision zones, not guarantees. Combine with your entry logic and risk controls.

Long Elite Squeeze (LES) — H.H 22 Lindsay (AI)LES (Long Elite Squeeze)
LES (Long Elite Squeeze) is a trading framework designed to capture the highest-probability long setups. It’s not just another signal script — it’s a structured system built to filter noise, manage risk, and keep you aligned with real momentum.
🔹 Core Logic
Breakout Confirmation – Ensures moves have structure, not just random spikes.
Relative Volume (RVOL) – Confirms participation and fuel behind the move.
RSI Alignment – Avoids overextended traps and fakeouts.
Squeeze Momentum – The backbone of LES. Signals fire only after a defined squeeze pattern shift (6+ dark green bars followed by a light green bar).
🔹 Trade Management Built In
Automated Sell Signals – Trigger on either:
2 consecutive dark green bars on Squeeze Momentum
WaveTrend cross down
(only valid after a Buy signal — no random shorts)
HUD Entry Checklist – Live conditions shown on chart.
Status Tracker HUD – Flips between “Waiting for Entry” and “In Trade” for clear context.
🔹 Flexibility
3 switchable squeeze versions (V1, V2, V3) for different market conditions.
Customizable EMA & ATR settings (with color options).
Session-aware logic — filter signals to prime trading hours.
🔹 Blueprint & Credits
LES is a fusion of proven concepts, standing on the shoulders of respected creators:
-Squeeze Momentum – LazyBear
-WaveTrend Oscillator – LazyBear
-Relative Volume – LonesomeTheBlue
Breakout/structural logic – refined from classic frameworks
Their work laid the foundation — LES expands and integrates them into a complete trading system.
⚡ Why LES Stands Out
LES wasn’t coded overnight. It’s the result of countless hours of live testing, rebuilding, and refining. Every feature earned its place by proving value in real trading, not theory.
LES is more than an indicator. It’s a disciplined framework — crafted to turn chaos into structure, randomness into probability, and noise into clarity.
⚠️ Disclaimer: This is a trading framework, not financial advice. Performance depends on trader discipline, risk management, and market conditions.
