Bias And Sentiment Strength (BASS) Indicator by mattzabBias And Sentiment Strength (BASS) Indicator is designed to be a quick visualization as to the market strength.
Pair with Alligator, MACD, or Moving Average lines on your chart for good results.
How to use this indicator:
Blue above 0 is positive sentiment, red below 0 is negative sentiment.
If you have blue above and red below, be cautious! The Bass is telling you that we have a battle between the Bulls and the Bears!
The purple bars are your volume bias. Volume bias can be positive or negative, despite the direction of the overall trend. Positive Volume Bias along with Bullish Blue Sentiment is a great sign! Go Long! If you have Bullish Sentiment and have a negative Volume Bias, be cautious! Price may not be moving with much conviction, and may be subject to reversal!
This is basically several different histograms overlaying one another, and they are blue above 0 and red below 0.
MACD Histogram - Standard MACD Histogram here.
RSI Histogram - This is a standard RSI. It has been adjusted to "oscillate" above and below zero, which would be the 50 line on a normal RSI chart.
Slow Stochastic Histogram - This is a slow stochastic with a 21 Period K, 14 Period D, and 14 Smoothing K. The "oscillator" histogram is formed by subtracting K from D.
Awesome Oscillator - This is a standard Awesome Oscillator
Alligator Oscillator - This is formed by adding (lips + teeth) + (teeth - jaw)
Volume Bias - The Volume Bias is displayed as purple bars, and is calculated by a highly sophisticated and complex algorithmic function called subtraction. It's just the 30 Period Volume-Weighted Moving Average Minus the 30 Simple Moving Average.
Enjoy!
Bias

Fancy Moving Average [BigBitsIO]This script is for a single moving average with as many features as I can possibly fit into a single moving average. If you can think of more, or have questions regarding this script, please message me or contact me via social media.
Features:
- A single moving average (MA).
- Standard MA inputs.
- MA type.
- MA period.
- MA price.
- MA resolution (time frame).
- Visibility toggle.
- Fancy MA inputs.
- Toggle to show only candles included in the MA calculation ("Highlight inclusion") or display entire MA history.
- Toggle to show a ghost trail when Highlight inclusion is toggled on. Displays a shaded version of past MA history before the inclusion period (as seen on snapshot).
- Toggle to show forecast values for the MA.
- Other inputs related to forecasting:
- Forecast bias. (Neutral forecasts MA if the current price remains the same.)
- Forecast period.
- Forecast magnitude.
*** DISCLAIMER: For educational and entertainment purposes only. Nothing in this content should be interpreted as financial advice or a recommendation to buy or sell any sort of security or investment including all types of crypto. DYOR, TYOB. ***

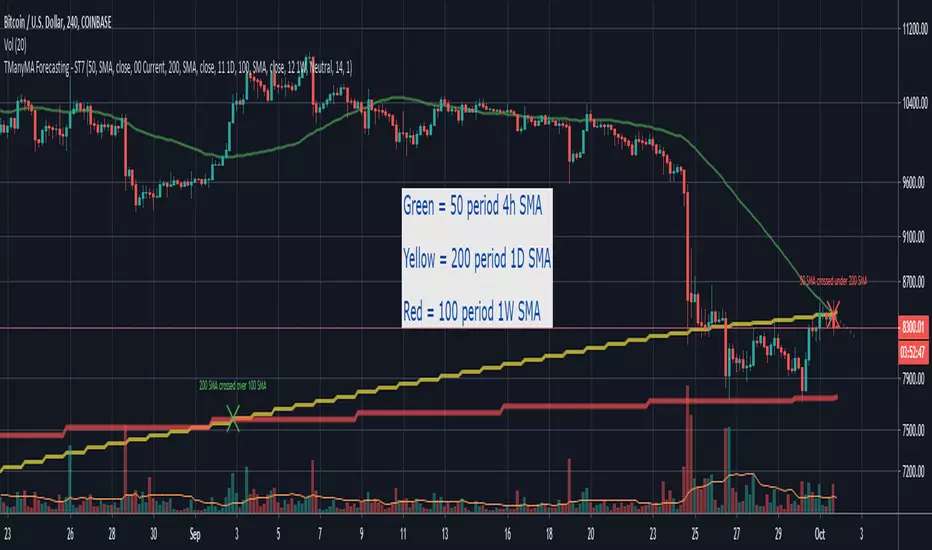
Scripting Tutorial 7 - Triple Many Moving Averages ResolutionsThis script is for a triple moving average indicator where the user can select from different types of moving averages, price sources, lookback periods and resolutions.
Features:
- 3 Moving Averages with variable MA types, periods, price sources, resolutions and the ability to disable each individually
- Crossovers are plotted on the chart with detailed information regarding the crossover (Ex: 50 SMA crossed over 200 SMA )
- Forecasting available for all three MAs. MA values are forecasted 5 values out and plotted as if a continuation to the MA.
- Forecast bias also applies to all forecasting. Bias means we can forecast based on an anticipated bullish, bearish or neutral direction in the market.
- To understand bias, please read the source code, or if you can't read the code just send me a message on here or Twitter. Twitter should be linked to my profile.
This script is meant as an educational script with well-formatted styling, and references for specific functions.
Scripting Tutorial 6 - Triple Many Moving Averages ForecastingThis script is for a triple moving average indicator where the user can select from different types of moving averages, price sources and lookback periods.
Features:
- 3 Moving Averages with variable MA types, periods, price sources and ability to disable each individually
- Crossovers are plotted on the chart with detailed information regarding the crossover (Ex: 50 SMA crossed over 200 SMA )
- Forecasting available for all three MAs. MA values are forecasted 5 values out and plotted as if a continuation to the MA.
- Forecast bias also applies to all forecasting. Bias means we can forecast based on an anticipated bullish, bearish or neutral direction in the market.
- To understand bias, please read the source code, or if you can't read the code just send me a message on here or Twitter. Twitter should be linked on my profile.
This script is meant as an educational script with well-formatted styling, and references for specific functions.

Institutional BiasShows what we at TRI call the institutional bias, i.e. a bull bias when 9 ema is above 18 ema and a bear bias when the 9 ema is below the 18 ema.
Plots the 9 and 18 ema, and fills the background green when the institutional bias is bullish and red when it is bearish.
